Electronic Nose Sensor Array Optimization Using Rough Set Theory Rajib Bandyopadhyay, Anil Kumar Bag, Bipan Tudu, and Nabarun Bhattacharyya Citation: AIP Conf. Proc. 1362, 64 (2011); doi: 10.1063/1.3626308 View online: http://dx.doi.org/10.1063/1.3626308 View Table of Contents: http://proceedings.aip.org/dbt/dbt.jsp?KEY=APCPCS&Volume=1362&Issue=1 Published by the American Institute of Physics.
Related Articles Parametric excitation of a micro Coriolis mass flow sensor Appl. Phys. Lett. 101, 223511 (2012) Frequency-domain correction of sensor dynamic error for step response Rev. Sci. Instrum. 83, 115002 (2012) Application of in-cell touch sensor using photo-leakage current in dual gate a-InGaZnO thin-film transistors Appl. Phys. Lett. 101, 212104 (2012) Microelectromechanical strain and pressure sensors based on electric field aligned carbon cone and carbon black particles in a silicone elastomer matrix J. Appl. Phys. 112, 094324 (2012) Wheatstone bridge piezoresistive sensing for bulk-mode micromechanical resonator Appl. Phys. Lett. 101, 193505 (2012)
Additional information on AIP Conf. Proc. Journal Homepage: http://proceedings.aip.org/ Journal Information: http://proceedings.aip.org/about/about_the_proceedings Top downloads: http://proceedings.aip.org/dbt/most_downloaded.jsp?KEY=APCPCS Information for Authors: http://proceedings.aip.org/authors/information_for_authors
Downloaded 01 Dec 2012 to 203.197.107.98. Redistribution subject to AIP license or copyright; see http://proceedings.aip.org/about/rights_permissions
Electronic Nose Sensor Array Optimization Using Rough Set Theory Rajib Bandyopadhyaya,*, Anil Kumar Bagb, Bipan Tudua, Nabarun Bhattacharyyac a
Department of Instrumentation and Electronics Engineering, Jadavpur University, Kolkata-700 098, India, *
[email protected] b Department of Applied Electronics and Instrumentation Engineering, Future Institute of Engineering and Management, Kolkata-700 150, India. c Centre for Development of Advanced Computing, Kolkata-700 091, India. Abstract. The most important component of an electronic nose instrument is the sensor array and its classification accuracy depends significantly upon the choice of the sensors in the array. In many applications of electronic nose, a few sensors are sometimes redundant and only a subset of the sensor array contributes to the decision. Thus, the number of sensors used in the electronic nose may be minimized for a particular application without affecting the classification accuracy. In many cases, the sensor array produces even an imprecise, redundant and inconsistent dataset. Rough set theory (RST) is a mathematical tool capable of selecting the most relevant and non-redundant features from such datasets. Compared to the other techniques of sensor array optimization, the unique feature of the RST based method is that it optimizes the sensor array while classifying the data. There is no need to execute a special procedure for optimization. This feature makes this method very useful while introducing the electronic nose technology for a new application. The instrument may be deployed with a non-optimized sensor array and the classification procedure, after exposure to a large number of samples, comes out automatically with the optimized sensor array. In this paper, the notion of rough set theory is utilized for pattern classification of black tea samples and optimization of the sensor array. The results section shows that the optimized set is better in terms of the criteria of separability index. Keywords: Electronic Nose, Sensor array optimization, Rough set theory. PACS: 87.19.lt
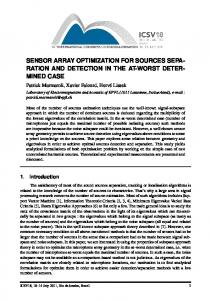
METHODS AND RESULTS Z. Pawlak introduced the concept of rough set theory in the early 1980s [1]. It is an excellent mathematical tool for the analysis of vague description of objects. The technique requires discrete values of the features, and so the real valued attribute features are discretized before presentation for rough set analysis. After discretization, the feature selection process of finding a optimum subset from the original set of pattern features is carried out using a reduct finding algorithm. The reduct is defined as the minimal set of attributes that describes all the inherent variations in the data set. From this, the rule set is generated and is used for classification. The operational flowchart is shown in Fig. 1. The classification method based on rough set theory is implemented on a customized electronic nose setup that has been developed for quality evaluation of tea aroma. Eight gas sensors from Figaro, Japan – TGS 2610, TGS 2620, TGS 2611, TGS 2600, TGS 816, TGS 831, TGS 832, and TGS 823 constitute the sensor array for the setup and Olfaction and Electronic Nose: Proceedings of the 14th International Symposium on Olfaction and Electronic Nose AIP Conf. Proc. 1362, 64-65 (2011); doi: 10.1063/1.3626308 © 2011 American Institute of Physics 978-0-7354-0920-0/$30.00
64 Downloaded 01 Dec 2012 to 203.197.107.98. Redistribution subject to AIP license or copyright; see http://proceedings.aip.org/about/rights_permissions
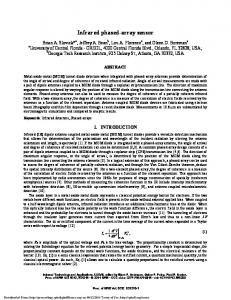
the details of the experimental setup are described in [2]. Experiments have been carried out on 51 samples of CTC tea from Dalmia Plantations, West Bengal, India, where one experienced tea taster was assigned for evaluating the samples. The taster’s scores have been used as the decision attributes of the objects. The details of the samples and their scores are presented in Table 1. On this dataset, the reduct finding algorithm gives the optimum sensor array having only four sensors TGS 2620, TGS 816, TGS 831and TGS 823. The PCA plots with the original set of sensors and the optimized set are shown in Figs. 2 & 3. The quanitative improvement by eliminating the redundant sensors can be observed using the separability criteria, which is presented in Table 2. The classification accuracy obtained by this method on 51 samples is 82.5%. 0.08
Pre-processed data set contains real valued attributes
Taster score 6 Taster score 7 Taster score 8 Taster score 10
0.06 0.04
PC2(6.5150% )
0.02
Assign decision attribute
0 -0.02 -0.04 -0.06 -0.08
Discretization of data set using discretization algorithm
-0.1 -0.15
-0.1
-0.05
0
0.05 0.1 PC1(79.9110%)
0.15
0.2
0.25
FIGURE 2. PCA plot for the data set containing all the eight sensors.
Sensor selection using reduct algorithm
0.08 Taster score 6 Taster score 7 Taster score 8 Taster score 10
0.06 0.04
P C2(6.9572% )
0.02
Rule generation
0 -0.02 -0.04 -0.06
Generate reduct rule set
-0.08 -0.1 -0.25
-0.2
-0.15
-0.1 -0.05 0 PC1(87.7288%)
0.05
0.1
0.15
Classify using the reduct rule set
FIGURE 1. Operational flow chart
FIGURE 3. PCA plot for the data set containing selected sensors.
TABLE 1. Sample details. Serial number of samples 1-13 14-34 35-45 46-51
Score 5 6 7 9
TABLE 2. Separability index. Sensor sets
Separability index
TGS 2610, TGS 2620, TGS 2611, TGS 2600, TGS 816, TGS 831, TGS 832, and TGS 823 TGS 2620, TGS 816, TGS 831and TGS 823
3.8148 3.9309
REFERENCES 1. Z. Pawlak, Cybernetics and Systems: An Int. J. 29, 661-688 (1998). 2. N. Bhattacharyya, R. Bandyopadhyay, M. Bhuyan, B. Tudu, D. Ghosh, and A. Jana, IEEE Trans. Instrum. Meas. 57, 1313-1321 (2008).
65 Downloaded 01 Dec 2012 to 203.197.107.98. Redistribution subject to AIP license or copyright; see http://proceedings.aip.org/about/rights_permissions