Uncharged (core: green; core-shell: black) as well as charged microgels (core: blue; core-shell: red) were used for both methods. Note the break in the abscissa.
Electronic Supplementary Material (ESI) for Soft Matter. This journal is © The Royal Society of Chemistry 2014
Electronic supplementary information Highly Ordered 2D Microgel Arrays: Compression versus Self-Assembly Karen Geisel, Walter Richtering, Lucio Isa* Influence of adsorption time on the particle arrangement (non-uniform microgel assembly) The microstrcuture of the interface obtained from adsorption and self-assembly depends on the time allowed for adsorption. A steady-state interfacial tension (IFT) and thus a saturation interface coverage is reached after a time that depends on the microgel concentration in the aqueous phase, the temperature and the softness of the particles. The adsorption process is purely diffusion-controlled at the beginning but is later influenced by particle spreading and rearrangement at the interface.1 The time between sample loading and freezing in a FreSCa cryo-SEM experiment is below 60 s. From previous results on P(NiPAm) microgels1 and IFTmeasurements of the core and the core-shell microgel (Table S1) it can be concluded that the steady state is not reached when the sample is frozen. Thus it is possible that local variations in the particle density and arrangement are found at the interface. Small deviations in the sample preparation may have a large effect on the particle arrangement. Table S1: Interfacial tension of the core and the core-shell microgels at different conditions after 60 s and in quasi-equilibrium (8000 s).
core microgel core-shell microgel
uncharged (pH 3) charged (pH 9) uncharged (pH 3) charged (pH 9)
0.1 wt% aq. dispersion vs. nheptane after 60 s after 8000 s [mN/m] [mN/m] 19.8 17.0 38.3 21.9 24.9 16.7 23.4 16.8
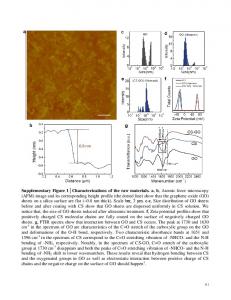
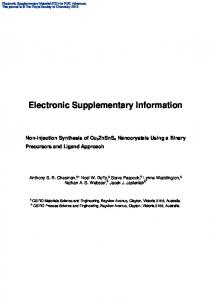
Figure S1 shows a FreSCa cryo-SEM image where the packing density as well as the ordering shows variations. Areas with high order coexist with less ordered regions. The image does not represent an equilibrium state but a snapshot of the particle arrangement at the interface, which is influenced by the concentration gradients that are present at the interface. The evolution of local structure towards more hexagonally ordered packing shows that the particles are able to move at the interface after adsorption. Mobility of P(NiPAm) microgels at the air-water interface was also shown by Cohin et al. who demonstrated that P(NiPAm) microgels at the air-water interface diffuse towards each other and form clusters after adsorption to the interface.2 Nevertheless, most of the images show uniform particle distributions over the field of view. In contrast to the self-assembled microgel layers, the microgel particles in the Langmuir trough have experienced an equilibration time of 30 min when the compression starts. This may also facilitate the formation of highly ordered microgel assemblies.
Figure S1: FreSCa cryo-SEM image of core-shell microgels in the charged state. Different packing densities are observed at the interface. Areas with high concentration show rather close, hexagonal packing, whereas the microgels have a liquid-like structure at areas with lower concentration.
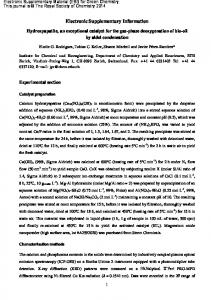
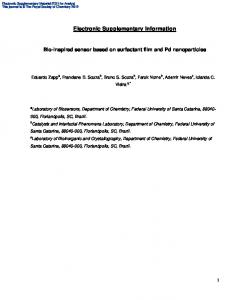
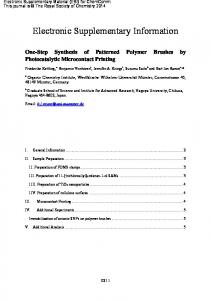
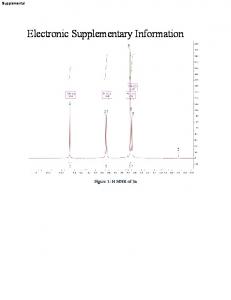
Radial distribution functions of microgel assemblies (determined from AFM images) Figures S2 and S3 show the radial distribution functions of the uncharged (Figure S2) and the charged (Figure S3) microgel. The functions were calculated from the AFM images shown in Figure 4 and Figure 5, respectively. 8
a 4
7
b
6
c
5
6 3
3
4
g (r)
4
g (r)
g (r)
5
2
2
2
1 1
1 0
0 0
500
1000
1500
2000
2500
3000
0 0
r [nm] 5
3
5
d
500
1000
1500
2000
2500
3000
0
500
1000
r [nm]
e
1500
2000
2500
3000
2000
2500
3000
r [nm] 3
f
4 4
2 3
2
2
1
1
1
0
0
0 0
500
1000
1500
2000
2500
0
3000
500
1000
g
1500
2000
2500
3000
r [nm]
r [nm]
0
500
1000
1500
r [nm]
h 2
g (r)
2
g (r)
g (r)
g (r)
g (r)
3
1
0
1
0 0
500
1000
1500
r [nm]
2000
2500
3000
0
500
1000
1500
2000
2500
3000
r [nm]
Figure S2: Radial distribution functions of the uncharged microgel as calculated from the AFM images in Figure 4.
2,5
5
A
D1
5
4
4
3
3
D2
g (r)
g (r)
1,5 1,0 0,5
g (r)
2,0
2
1
1
0,0
0
0
0
500
1000
1500
2000
2500
0
3000
500
1000
1500
2000
2500
3000
r [nm]
r [nm] 5
E
3,0
2
0
500
1000
1500
2000
2500
3000
r [nm]
G
2,5
4
2,0
g (r)
g (r)
3
2
1,5 1,0
1
0,5 0,0
0 0
500
1000
1500
r [nm]
2000
2500
3000
0
500
1000
1500
2000
2500
3000
r [nm]
Figure S3: Radial distribution functions of the charged microgel as calculated from the AFM images in Figure 5.
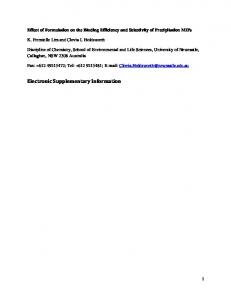
Microgel adsorption from drying droplets In addition to the presented experiments, we investigated dried droplets of microgel solution (0.01 wt%) on solid silicon substrates (Figure S4). We did not observe hexagonal order but random arrangement with small center to center distances, represented by the g(r) functions (Figure S5). We could not reproduce the findings of Tsuji and Kawaguchi, who reported that the center-to-center distance is independent of the microgel concentration and that only the covered area is changing.3 These short experiments showed that direct formation of hexagonal arrays of the presented microgels is not simple when droplets of different concentrations are dried on solid substrates, as drying very sensitively depends on several parameters (e.g. temperature, drop size, surface properties) and drying conditions have to be precisely controlled to ensure reproducibility. This highlights once more the advantages of the Langmuir-Blodgett method.
Figure S4: AFM images of a dried drop of 0.01 wt% microgel solution in the uncharged (left) and the charged (right) state.
2,0
uncharged charged
1,8 1,6 1,4 1,2
g(r)
1,0 0,8 0,6 0,4 0,2 0,0 -0,2 0
200
400
600
800 1000 1200 1400 1600 1800 2000
r [nm]
Figure S5: g(r) functions calculated from the images given in Figure S4. No long range order can be observed.
Normalization of the nearest neighbor distance to the area fraction
800 700
D [nm]
600 500 400 300 200 100 0
1
2 5
6
7
8
9
[a.u.] Figure S6: Nearest neighbor distance D as a function of the area fraction φ, where φ = 1 denotes complete coverage of the interface. The area fraction was calculated from the number of particles per µm2 and the size of the particles at the interface as determined from FreSCa cryo-SEM micrographs. Area fractions above one indicate that the particles are compressed. Imaging was performed for the core and the core-shell microgel after self-assembly (imaging with FreSCa cryo-SEM, squares) and for the core microgel after directed assembly in a Langmuir trough (imaging with AFM, triangles). Uncharged (core: green; core-shell: black) as well as charged microgels (core: blue; core-shell: red) were used for both methods. Note the break in the abscissa.
1. Z. Li, K. Geisel, W. Richtering, T. Ngai, Soft Matter 2013, 9, 9939. 2. Y. Cohin, M. Fisson, K. Jourde, G. G. Fuller, N. Sanson, L. Talini, C. Monteux, Rheol. Acta 2013, 52, 445. 3. S. Tsuji, H. Kawaguchi, Langmuir 2005, 21, 2434.