DEVS-Based Underwater Warfare Simulation Development for Effectiveness Analysis Kyung Min Seo*, Jeong Hee Hong** and Tag Gon Kim*** School of EECS KAIST 373-1 Kusong-dong, Yusong-gu Daejeon, Korea 305-701 Tel: +82-42-869-5454 Fax: +82-42-869-8054 E-mail:
[email protected]*,
[email protected]**,
[email protected]***
Keywords: DEVS formalism, Underwater Warfare Simulation, Measure of effectiveness, Monte Carlo simulation Abstract As underwater weapons in underwater warfare systems have become increasingly diverse and complicated, modeling and simulation (M&S) techniques have been widely used for the design and evaluation of those systems. This paper proposes a DEVS based underwater warfare simulation with which to analyze military effectiveness. The proposed simulation provides an overall engagement scenario, for example, from underwater weapon launch to hit. It is designed to support users in evaluating the effectiveness of underwater warfare systems through Monte Carlo simulation and assess tactical development and antitorpedo countermeasure effectiveness. INTRODUCTION As underwater weapons in underwater warfare, such as torpedoes, decoys, and submarines, have been more diverse and complicated the factors of risk in thses system development increase [1]. In order to determine requirements for underwater warfare systems, and to design and evaluate these systems, various modeling and simulation (M&S) techniques have been used for underwater warfare. In past years, there have been some efforts to develop the underwater warfare simulation for academic purpose as well as commercial tools [3-5]. ODIN[3] and ORBIS[4] are simulation tools for underwater warfare developed for commercial. Because these tools are not based on the mathematical representations such as the Discrete Event Systems Specifications (DEVS) formalism, it brings modelers difficulty to extend their own developed models. For academic purpose, there has been a research about the simulation of a submarine’s evasion against a torpedo in 2007 [5]. In this research, all of the simulation models are developed using the DEVS formalism, but if the user would like to evaluate the alternative evasion tactic of the submarine, the user should develop another DEVS model. It is a disadvantage for modelers in an aspect of model reusability.
This paper proposes the DEVS based underwater warfare simulation development for Effectiveness Analysis. Using the DEVS formalism, it enables a more straight-forward model comparison and the bigger model development with less cost. Moreover, the proposed modeling methodology provides the generic representations of underwater platforms and each model is reusable for other different platform models. The proposed simulation development provides to simulate with the overall engagement scenario, for example from underwater weapon launch to hit. The established simulation development involves the attacking platform and the target platform. The attacking platform launches the underwater weapon and the target platform alerts the threat weapon and attempt to evade by maneuver and deploy countermeasures. It is designed to support a range of applications for users whose requirements include:
1.
Statistical evaluation of underwater warfare system effectiveness through Monte Carlo simulation Assessment of anti-torpedo countermeasure effectiveness Support the decision making process for future equipment procurements Assessment of tactical development
This paper is organized as follows. Section 2 introduces the DEVS formalism and the collaborative modeling methodology for basic knowledge about modeling a system. Section 3 exploits an underwater warfare model design, and Section 4 and 5 explain implementation and simulation of underwater warfare model. Section 6 illustrates the effectiveness analysis utilizing the experimental results from the anti-torpedo combat simulator. Section 7 concludes this research and proposes future extensions for a more complete solution. 2.
BACKGROUND This section describes background knowledge about modeling a system. The DEVS formalism is a general methodology for describing discrete event systems and the collaborative modeling methodology extends the classic DEVS formalism in order to explain the activities within the
discrete event modeling and behavioral modeling. 2.1. DEVS formalism The DEVS formalism, a set-theoretic formalism, specifies discrete event systems in a hierarchical and modular form [6]. The formalism, which represents a discrete event system from the system-theoretic viewpoints, is known to be compatible with the object-oriented (OO) world view. With the formalism, the modeler can specify a discrete event system more easily by decomposing a large system into smaller component models. The DEVS formalism consists of two kinds of models: Atomic model and Coupled model. An atomic model is the basic model and has specifications for the dynamics of the model, and a coupled model provides the method of assembly of several atomic and/or coupled models. An overall system consists of a set of component models, either atomic or coupled, thus being in a hierarchical structure. Each DEVS model has correspondence to an object in a real-world system to be modeled. Within the DEVS framework, the model design may be performed in a top-down fashion; model implementation in a bottom-up manner. 2.2. Collaborative Modeling Methodology The collaborative modeling methodology has been proposed to overcome the difficulty of developing domainspecific simulation systems [2]. The methodology guarantees to put the right professional engineers in the right place. Domain engineers analyze functional requirements about domain knowledge, and M&S engineers design the discrete event model using the analyzed requirements. Platform engineers implement the models and compose the real systems. Within the collaborative modeling methodology, the model is decomposed into sub-models from a top-down perspective. The architectural design is completed from an OO modeling viewpoint. The OO modeling approach for system modeling views a system as an object in which its representation and associated operations are explicitly defined. A designed model presents an object, and the model is partitioned into two modeling levels of the object: discrete event-level model (DEM) and detailed behaviorallevel model (BM). DEMs deal with abstracted level of behaviors, mostly in state-transition level. Technically, DEVS models represent discrete event systems and employ DEVS formalism to do modeling. In order to transit between states, algorithms for decision-making or calculations that involve domain-specific knowledge are necessary in most cases. These algorithms and calculations are represented by BMs. The methodology extends the classic DEVS formalism in order to explain the interface the DEM and the BM.
3.
MODEL DESIGN The proposed model is designed based on the DEVS formalism. The model provides the user with a generic model architecture for an underwater warfare model, in which detailed behavioral description relating to underwater warfare systems can be constructed. 3.1. Overall Model Structure The overall model architecture of the underwater warfare system is described in Figure 1. The overall model architecture consists of two main models; a simulation model for users’ system and an experimental frame model for analysis of the users’ system.
Figure 1. Structure of Proposed Model Design
The experimental frame is a specification of the conditions under which the system is observed or experimented with [6]. The experimental frame consists of two atomic models. The generator generates an input scenario to the system and the transducer observes and analyzes the system output segments. The simulation model depicted in Figure 1 includes four underwater platform models as follows: a) Attacking platform: This may be a submarine or a surface ship. b) Target platform: This may also be a submarine or a surface ship. c) Torpedo: This may be an anti-ship/anti-submarine torpedo or fire and a forget/wire guidance torpedo. d) Countermeasures: The following countermeasure types are available: i. Anti-platform sonar decoys ii. Anti-torpedo sonar decoys
Figure 2. Instantiation of Underwater Platform Model
Four models are instances of the underwater platform model indicated in Figure 2. The dotted arrow is actually a dependency relation that has been given a special meaning by the stereotype 《instantiate》, and the 《instantiate》 turns an ordinary dependency into an instantiation relationship between a class and objects of that class, underwater platform model [7]. Each platform model is consist of three parts; maneuver, sensor and controller model. The right part of Figure 1 represents the structure of the torpedo model which is one of the underwater platform model. The functional role of each model is described in the following subsections. 3.2. Underwater Platform Model War game models such as underwater warfare models are often required to apply new algorithms or detailed behaviors during its maintenance. For example, the types of the sensor algorithms of the underwater warfare model are various like as Cylindrical Array (CAS), Mine Avoidance (MAS), Flank Array (FAS), Passive Ranging (PRS), Towed Array (TAS) and any sensor algorithms among them can be applied for analyzing the system. In some cases, we need to develop the model which is specified as an open architecture accommodating various algorithms in order to compare Measures Of Effectiveness (MOEs) between algorithms. In these cases, the collaborative modeling methodology clearly gives us how we can change detailed behaviors of the model. In the collaborative modeling methodology, M&S experts and domain experts partition the target system into two parts; discrete event modeling and behavioral-level modeling [2]. The right part of Figure 1 depicts the simple relation between the underwater platform models. The underwater platform model is divided into three sub-models: Controller model, Sensor model, Maneuver model. Each sub-model consists of a DEM represented by the DEVS formalism and various BMs described as detailed behaviors. This threeparted modeling methodology provides the generic representations of underwater platforms and each sub-model is reusable for other different platform models. 3.2.1. Controller Model The controller model takes a role of dynamic decisionmaking under some uncertainty. The major roles of the controller models are as follow: i. Target Detection : Detect based on data from sensor models ii. Identification : Identify threats from detected targets iii. Battle Planning : Decide how to deal with the identified threat iv. Weapon-to-target Assignment : Set of decisions which lead to the assignment of one or more weapons to engage each threat
The following specification represents the DEM and BM of the controller model in detail.
DEM Layer AM CONTROL_DEM = < X, Y, S, I, δext, δint, ψI, λ, ta >, X = {“start”, “search_position”, “friendly_position”} Y = {“move_order”, “fire”} S = {IDLE, WAIT, IDENTIFY, CONTROL} I = {If, Ig} δext : IDLE × “start” → WAIT WAIT × “search_position” → IDENTIFY WAIT × “friendly_position” → WAIT CONTROL × “friendly_position” → CONTROL δint : IDENTIFY → CONTROL ψI : IDENTIFY → If, CONTROL → Ig λ : CONTROL → “move_order” CONTROL → “fire” ta(IDLE) = ∞, ta(WAIT) = ∞, ta(IDENTIFY) = 0 ta(MOVE ) = tc2 (time step for command and control operation)
BM Layer If : Identification If : (x, y, z, dx, dz, v, flag) = f(x, y, z, dx, dz, v) Ig : CommandAndControl Ig : (x, y, z, dx, dz, v, δt) = f(x, y, z, dx, dz, v, flag)
(x, y, z) represent the current position, which is considered in the Cartesian coordinate system xyz, and dx, dz, v and δt represent pitch and yaw angles, speed and time step for updating position, respectively, and flag reports whether the detected target actually becomes a threat or not. There are two communication interfaces, If and Ig, and each interface is linked at IDENTIFY and CONTROL state. The If identifies threats and the I g decides how to deal with the identified threat, and represents the tactics of command and control (C2) system. In BM, the interfaces are described in detail as equations or flow chart.
Figure 3. Example of Flowchart of Torpedo Controller BM
For one simple example of the I g, the flow chart of the torpedo BM is depicted in Figure 3. In this example, we consider a heavy-weight torpedo, which is a submarinelaunched torpedo for surface ship targets. The BM of the torpedo controller model includes three different types of search modes; Snake Search, Circular Search, Straight Search. The name of the mode reveals the navigation patterns of the torpedo. In accordance with the combination of these three search modes, various searching algorithms can be developed, and it has an effect on MOEs. 3.2.2. Maneuver Model The maneuver model represents the movement of the underwater platform model. The DEM controls the overall event messages. Especially, the model receives the request of the position information and sends the information to the controller model. The BM calculates the next position using maneuver equations. The following specification represents the DEM and BM of the controller model in detail.
DEM Layer AM MANEUVER_DEM = < X, Y, S, I, δext, δint, ψI, λ, ta >, X = {“move_order”} Y = {“friendly_position”} S = {WAIT, MOVE} I = {Ih} δext : WAIT × “move_order” → MOVE δint : MOVE → WAIT ψI : MOVE → Ih λ : MOVE → “friendly_position” ta(WAIT) = ∞ ta(MOVE ) = tmove (time step for move operation) BM Layer Ih : CalcualteNextPosition Ih : (xn, yn, zn, dx, dz, v) = f(xc, yc, zc, dx, dz, v, δt) xn = xc + vcos(dx)cos(dz) δt yn = yc + vsin(dx)cos(dz) δt zn = zc - vsin(dz) δt,
Where, (xc, yc, zc) and (xn, yn, zn) represent the current position and the next position after calculation, which are considered in the Cartesian coordinate system xyz, and dx, dz, v and δt represent pitch and yaw angles, speed and time step for updating position, respectively. The equation in Ih can be exchanged according to the instance of the underwater platform model.
3.2.2. Sensor Model The sensor model is a part of tracking maneuvering targets according to its own algorithm. Similar to the maneuver model, the sensor model receives the target and own position information, calculates the threat information using sensor algorithms, and sends the threat information to the controller model. The types of the sensor algorithms are various as mentioned previously. Therefore, in this paper, we do not describe the BM in detail. As the modeler identifies the communication interface between the DEM and the BM, the modeler can apply various sensor algorithms represented by the BMs without any modification of the DEM.
DEM Layer AM SENSOR_DEM = < X, Y, S, I, δext, δint, ψI, λ, ta >, X = {“friendly_position”, “enemy_position”} Y = {“search_position”} S = {WAIT, RECEIVE, DETECT} I = {Ii, Ij} δext : WAIT × “enemy_position” → RECEIVE δext : RECEIVE × “friendly_position” → DETECT ψI : RECEIVE → Ii, DETECT → Ij δint : MOVE → WAIT λ : MOVE → “position_information” ta(WAIT) = ∞, ta(RECEIVE) = ∞ ta(MOVE ) = tdetect (time step for target detection operation)
BM Layer Ii : UpdatePosition Ii : f(x, y, z. dx, dz, v, SL, id) Ij : TargetDetection Ij : (x, y, z. dx, dz, v) = f(x, y, z. dx, dz, v, SL, id)
Where, all of the variables except id and SL are identical with controller BM model. id means the threat’s id to distinguish from other threats and SL is the underwater noise emitted by the instance of the underwater platform model. The Ii updates the information of threats and the Ij decides which one can be detected using given sensor algorithm. 4.
MODEL IMPLEMENTATION In the previous chapter, the DEMs and the BMs are designed for the underwater warfare model according to the collaborative modeling methodology. In this chapter, implementation of the designed DEMs and BMs for simulation will be described. Figure 4 represents the implementation of the designed model. The experimental frame model and the DEMs of the underwater platform model are implemented using C++
language with DEVSim++[8] library, and the detailed algorithms and equations of the BM are implemented using C++ language. As mentioned previously, the change in detailed algorithms and dynamic equations is more frequent than the change in abstract behavior. For supporting this phenomenon effectively, shared library technique such as the dynamically linked library (DLL) is used, which enables to switch the algorithms or dynamic equations at the runtime without re-compiling [9].
maneuver model is MOVE, the DEM calls the CalculateNextPosition function to the BM. The CalculateNextPosition function can be changeable as the user applies alternative maneuver algorithms to the BM. The CalculateNextPosition function may realize various maneuver algorithms and tactics such as uniform motion, parabolic motion and accelerated motion, etc. Each function is developed as a separate DLL, for example, Maneuver Equation 1 and Maneuver Equation 2 in Figure 5. 5.
MODEL SIMULATION Now, we set up model implementation using C++ language. Finally, we design the overall architecture of the underwater warfare simulation.
Figure 4. Structure of Overall Model Implementation
In other words, the BM provides various algorithm candidates implemented with the DLL. For linking the DEM and corresponding BM, there is a communication interface called function prototype in C++ language [2]. The DEM can pick a BM in the DLL pool via a function call. For selecting the BM, the DEM is only interested in the inputs, the output and the name of function prototype. This means that the BM is available for another DEM if the DEM is implemented using the same name of function prototype and same input and output (I/O).
Figure 5. Implementation of Torpedo Maneuver Model
Figure 5 shows implementation of a DEM and a BM of a torpedo maneuver model. The DEM describes the maneuver behavior of the torpedo and the BM describes the dynamic equation of torpedo. Whenever the state of the torpedo
Figure 6. High Level View of Underwater Warfare System
Figure 6 illustrates the high-level view of the discrete event simulation for the underwater warfare. The underwater warfare simulation is not a live simulation, but a constructive simulation. Generally, the constructive simulation has various simulation parameters. We identify these parameters as the scenario parameters and enumerate the input parameters in Table 1. As our goal is to evaluate the MOEs of the simulation, such as the survivability of the surface ship and the operational success rate, in various situations, we will conduct the simulation to vary the input parameters in later case study. The simulation result is represented in SIMDIS, which is a set of software tools that provide two and three-dimensional interactive graphical display tools that provide two and three-dimensional interactive graphical and video display of live and post processed simulation, test and operational data [10]. The developed simulation enables statistical evaluation of underwater warfare system effectiveness through Monte Carlo simulation. The feature of Monte Carlo simulation depicted in Table 1 allows for random variations in certain parameters and simulated events to develop probabilistic assessments of system effectiveness. For example, the torpedo is launched randomly within the scenario guidelines
and the reliability of the decoy is influenced by the normal random variable. Table 1. Input Parameters for Underwater Warfare Simulation Platform
Surface ship
Torpedo
Submarine
Parameter Name
Default Value
Length, width
135, 5 (m)
Speed
15 (knts)
Revolution angle per a second Detection range
3 (degree/sec) 3000 (m)
Live time
2400 (sec)
Detection range
3000 (m)
Angle to launch
10 (degree)
Angle of sweepforward Revolution angle per a second
40 (degree) 3 (degree/sec)
Speed
18, 23, 35 (knts)
Length, width
230, 10 (m)
Speed
12 (knts)
Revolution angle per a second Detection range
3 (degree/sec) 6000 (m)
Motion type
static
Launch type
rocket
Num. of decoy
4
Speed of decoy
12 (knts)
Decoy Reliability
90 (%)
Launch time
3 (degree/sec)
operation time
540 (sec)
source level
140 (dB)
6. CASE STUDY – ANTI-TORPEDO WARFARE SIMULATOR This section illustrates the developed anti-torpedo simulator for effectiveness analysis
Implications The volume of the surface ship The movement speed of the surface ship The revolution angle per a second of the surface ship The detection range of the surface ship The live time of the torpedo The detection range of the torpedo The angle to launch from attacking platform. The angle is influenced by the random variable. The maximum turning angle when snake search pattern is used. The revolution angle per a second of the surface ship Low speed middle speed high speed The different speed is applied according to the pattern of torpedo movement. The volume of the submarine The movement speed of the submarine The revolution angle per a second of the submarine The detection range of the submarine The motion types are mobile and static decoy The launch types are rocket and air pressed
6.1. Torpedo Engagement In this case study, the attacking platform and the target platform are the submarine and the surface ship, respectively. The anti-torpedo sonar decoys are used for countermeasures and the heavy-weight torpedo is applied which is a submarine-launched torpedo toward surface ship target. The objective of the simulation is to measure the survivability of the surface ship as the MOE. The simulator is useful to increase the survivability of the surface ship by applying various parameters of the each model. The brief scenario of the developed simulator illustrated in Figure 7 is as follows: 1. A submarine is launching a torpedo to the detected surface ship. 2. The torpedo is searching the threats through its own searching algorithm. 3. The surface ship is detecting the torpedo toward oneself, which is located in the boundary of the detection range. 4. The surface ship has only the decoy system to defend the threats. After operating the decoy system, the surface ship is making a detour for evasion. 5. The torpedo detects the decoy instead of the surface ship, and attacks the decoy. 6. The torpedo is searching other threats through its own searching algorithm.
The number of decoys The speed of mobile decoy. If the user does not use mobile decoys, this parameter is ignored The prob. to work normally. The reliability is influenced by the random variable. The delay time after launch command Time period from launch to expiration The source level of decoy
Figure 7. Anti-Torpedo Warfare Scenario
The MOE can be analyzed by varying the input parameters and BMs in Table 2. After running the simulator, we performed analysis of the results, which is described in Section 6.2. 100 replications per each scenario are experimented for statistical evaluation, and total replications are 40,000.
Table 2. Virtual Experiment Design Table Variable Name
Detection range of surface ship
Variation Cases 2000, 2500, 3000, 3500, 4000m (5 cases)
Experiment 1
Implications
The different detection range results in differences in the survival of surface ship.
default : 3000 m
Search pattern of torpedo
From pattern 1 to pattern 4 (4 cases) default : pattern 4
From pattern 1 to pattern 4 (4 cases)
Pattern of decoy operating system
default : pattern 3
Speed of mobile decoy
Total Experiment Design
3, 6, 9, 12, 15knts (5 cases) default : 12 knts 400 Cells (42 ⅹ52 Cases)
The different pattern results in differences in the survival of surface ship. This enables to exchange alternative BMs of torpedo controller model. ∙ pattern 1 : straight search pattern used ∙ pattern 2 : snake search pattern used ∙ pattern 3 : circular search pattern used ∙ pattern 4 : all of three patterns used The different pattern results in differences in the survival of surface ship. ∙ pattern 1 : four static decoys ∙ pattern 2 : four mobile decoys ∙ pattern 3 : two static decoys at the front of warship, two mobile decoys at the rear of warship ∙ pattern 4 : two mobile decoys at the front of warship, two static decoys at the rear of warship The different speed of decoy results in differences in the survival of surface ship.
No. of replication per each case : 100 times
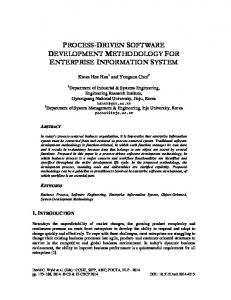
6.2. Experimental Results Figure 8 to 10 show the experimental results applied to the developed simulator. In Figure 8 and 9, the x-axis represents the detection range of the surface ship, and the yaxis shows the probability of the surface ship survival. In Figure 10, the x-axis represents the search pattern of torpedo, the y-axis shows the probability of the surface ship survival as same as Figure 8 and 9. Table 3 shows relationships between simulation objectives and experiments.
Figure 8. Experimental Result of Patterns of Decoy Operating System
The first experimental result shows the probability of the surface ship survival according to the detection range of the surface ship and the decoy operating system depicted in Figure 8. Basically, the experimental result shows that the higher detection range results in the higher probability of survival. Another analysis is the survival probability according to the patterns of the decoy operating system. Four patterns of the decoy operating system are applied and they are depicted in Table 2. Comparing the pattern 1 with the pattern 2, the mobile decoy system shows the better performance than the static decoy system, and comparing the pattern 3 with patter 4, the experimental result shows that the kind of decoys used at the front of the surface ship is influenced intensively by the survival probability. This experimental result represents that an effective way to make a successful mix of decoys is heavily dependent on the coordination of the timing and position to be released and the type of decoys
Experiment 2
Table 3. Simulation Objectives and Experiments Simulation Objectives
Experiments
Statistical evaluation of underwater warfare system effectiveness through Monte Carlo simulation
All of experiments are applicable.
Assessment of anti-torpedo countermeasure effectiveness
Experiment 1
Support the decision making process for future equipment procurements
Experiment 2
Assessment of tactical development
Experiment 3
Figure 9. Experimental Result of Mobile Decoy Speed
Figure 9 shows the second experimental result. Like the first experimental result, the detection range higher, the
probability of the surface ship’s survival is higher. In addition, as another analysis, when the detection range is fixed, the probability of the surface ship’s survival is higher in the higher speed of the decoy. Especially, in the case that the speed of the decoy is higher than 9knts, the decoy speed does not have deep influence on the surface ship’s survival. It supports to the decision making process for future equipment procurements
Experiment 3
Figure 10. Experimental Result of Search patterns of Torpedo
The third experimental result depicted in Figure 10 shows the survival probability according to the search patterns of the torpedo. In this experiment, four different patterns, depicted in Table 2, are used. The pattern represents the detailed algorithm which is designed in the BM of the torpedo controller model. The result shows that the case of combination of all three search patterns results in the higher probability of survival. By exchanging the BM, it enables to assess alternative tactical deployment of maneuver pattern of torpedo. Obviously, the experimental results from Figure 9 to Figure 11 have its limitations. First, the input parameters are not real values, and external environmental factors such as wind speed, ocean current are not considered. Despite some concerns, we can obtain the experimental tendency using proposed simulator and if users apply real values for input parameters users can be acquired more meaningful experimental results using the proposed simulation development. 7.
CONCLUSION This paper proposes the DEVS based underwater warfare simulation development for effectiveness analysis. It is designed to support for users to evaluate effectiveness of underwater warfare systems through Monte Carlo simulation and to assess tactical development and antitorpedo countermeasure effectiveness. The three-parted modeling methodology provides the generic representations of underwater platforms and each sub-model is reusable for other different platform models. Addition of the
environmental models and simulation of many-to-many engagement should be considered in a future work. 8.
ACKNOWLEDMENT This work was supported by Defense Acquisition Program Administration and Agency for Defense Development under the contract UD080042AD, Korea. 9. REFERENCES [1] Stewart Robinson, “Modes of simulation practice: approaches to business and military simulation,” IEEE Transactions on Simulation Modeling Practice and Theory, vol. 10, no. 8, pp. 513-523, 2002. [2] Chang Ho Sung and Tag Gon Kim, “Collaborative Modeling Process for Development of DomainSpecific Descrete Event Simulation Systems,” IEEE Transactions of System, Man, And Cybernetics Part C: Applications & Reviews [Under the submission]. [3] Terence Robinson, “ODIN – AN UNDERWATER WARFARE SIMULATION ENVIRONMENT,” in Proceedings of the 2001 Winter Simulation Conference, pp. 672-679, 2001. [4] Tina M. Higgins, Arthur E. Turriff and David M. Patrone, “Simulation-based undersea warfare assessment,” Johns Hopkins APL technical digest, vol. 23, no. 4, pp. 396-402, 2002. [5] Doo-Yeoun Cho, Myeong-Jo Son and Kyu-Yeul Lee, “Analysis of a submarine’s evasive capability against an antisubmarine warfare torpedo using DEVS modeling and simulation,” in Proceedings Spring Simulation Multi-conference, pp.307-315, 2007. [6] B.P. Zeigler, H. Praehofer and Tag Gon Kim, Theory of Modeling and Simulation, second ed., Academic Press, London, 2000. [7] Jim Arlow and Ila Neustadt, UML 2 and the Unified Process, second ed., Addison Wesley, 2005. [8] Tag Gon Kim and Sung Bong Park, “The DEVS formalism: Hierarchical Modular systems Specification in C++,” in Proceedings European Simulation Multi-conference, York, United Kingdom, pp. 152-156, Jun., 1992. [9] D. Beazley, B. Ward and I. Cooke, “The indie story on shared libraries and dynamic loading,” Computing in Science & Engineering, vol. 3, no. 5, pp. 90-97, sep., 2001. [10] SIMDIS User’s Manual, U.S. Naval Research Laboratory, 2006.