Electronic Research Archive of Blekinge Institute of Technology http://www.bth.se/fou/
This is an author produced version of a journal paper. The paper has been peer-reviewed but may not include the final publisher proof-corrections or journal pagination. Citation for the published Journal paper: Title: Empirical extension of a classification framework for addressing consistency in model based development
Author: Ludwik Kuzniarz, Lefteris Angelis
Journal: Information and Software Technology
Year: 2011 Vol. 53 Issue: 3 Pagination: 214-229 URL/DOI to the paper: 10.1016/j.infsof.2010.10.004 Access to the published version may require subscription. Published with permission from: Elsevier
Empirical Extension of a Classification Framework for Addressing Consistency in Model-based Development Ludwik Kuzniarz∗ ,1 School of Computing Blekinge Institute of Technology, Sweden
Lefteris Angelis2 Aristotle University of Thessaloniki, Thesaloniki, Greece
Key words: consistency in Model Driven Development, consistency classification framework, empirical evaluation and extension
∗
the corresponding author Email addresses:
[email protected] ( Ludwik Kuzniarz ),
[email protected] ( Lefteris Angelis ) 1 School of Computing Blekinge Institute of Technology, Soft Center, 372 25 Ronneby, Sweden, tel.+46 455 385853, fax. +46 455 38 00 00 2 Department of Informatics Aristotle University of Thessaloniki, Greece, tel. & fax.+30-2310998230 Preprint submitted to Information System Technology
October 15, 2010
Empirical Extension of a Classification Framework for Addressing Consistency in Model-based Development Ludwik Kuzniarz∗ ,1 School of Computing Blekinge Institute of Technology, Sweden
Lefteris Angelis2 Aristotle University of Thessaloniki, Thesaloniki, Greece
Abstract Context: Consistency constitutes an important aspect in practical realization of modeling ideas in the process of software development and in the related research which is diverse. A classification framework has been developed, in order to aid the model based software construction by categorizing research problems related to consistency. However, the framework does not include information on the importance of classification elements. Objective: The aim was to extend the classification framework with information about the relative importance of the elements constituting the classification. The research question was how to express and obtain this information. Method: A survey was conducted on a sample of 24 stakeholders from ∗
the corresponding author Email addresses:
[email protected] ( Ludwik Kuzniarz ),
[email protected] ( Lefteris Angelis ) 1 School of Computing Blekinge Institute of Technology, Soft Center, 372 25 Ronneby, Sweden, tel.+46 455 385853, fax. +46 455 38 00 00 2 Department of Informatics Aristotle University of Thessaloniki, Greece, tel. & fax.+30-2310998230 Preprint submitted to Information System Technology
October 15, 2010
academia and industry, with different roles, who answered a quantitative questionnaire. Specifically, the respondents prioritized perspectives and issues using an extended hierarchical voting scheme based on the hundred dollar test. The numerical data obtained were first weighted and normalized and then they were analyzed by descriptive statistics and bar charts. Results: The detailed analysis of the data revealed the relative importance of consistency perspectives and issues under different views, allowing for the desired extension of the classification framework with empirical information. The most highly valued issues come from the pragmatics perspective. These issues are the most important for tool builders and practitioners from industry, while for the responders from academia theory group some issues from the concepts perspective are equally important. Conclusion: The method of using empirical data from a hierarchical cumulative voting scheme for extending existing research classification framework is useful for including information regarding the importance of the classification elements. 1. Introduction. Modeling is becoming a commonly accepted and used technique in research and practice related to software engineering and also one of the fundamental ideas behind Model Driven Development (MDD) paradigm [1], [2]. The idea is expressed in such a way that in software projects the focus is put on models which, in a very orthodox approach, constitute the basic and the only type of artifacts considered and built within the development process. When applying model based developments, consistency between mod-
3
els used and produced within the development process is one of the most important issues. Recently, there has been a growing interest towards consistency by the research community working on a proper usage of models. The interest was particularly reflected by the number of papers addressing consistency issues, as well as in a series of events dedicated to consistency, aiming to present the ongoing research during annual conferences related to UML and modeling [3], [4], [5]. The research so far was focused on the consistency itself, in order to understand the notion and its definition, to classify its issues and to check for consistency between involved artifacts. An observation regarding the contemporary research and also the outcome of the workshops related to consistency in modeling is the diversity of research and the lack of a unified way to understand and approach various research problems associated to consistency [6]. This impression of diversity in research is enhanced by potential practical consequences of inadequate understanding of consistency problems encountered in industry [7]. In an attempt to overcome the aforementioned deficiency, a classification framework for research on consistency was introduced in [8]. The proposed Model Driven Consistency Classification Framework (MDC-F), is structured into research perspectives and subsequently into research issues within perspectives (detailed description can be found in [9]) and is also summerized in Appendix A. The issues in the classification represent particular research problems, whereas the perspectives represent groups of issues with a common denominator. The development of this framework started with eliciting the perspectives and issues, followed by their refinement and a sample application of the framework. The elicitation was carried out as a post workshop
4
activity, after a series of workshops on consistency problems in modeling [8], and it was refined afterwards. Originally, the classification was intended to allow positioning of ongoing and planned research as well as to provide better understanding which research problems are addressed. But it may also be used for planning research related to consistency, to find out what kind of problems have been identified and which issues can be addressed in the research, and furthermore, how to set up relevant research questions. However, in the search for a good subject for further research and also for assessment of already conducted research, it is also crucial to have some indication of the importance of the problem under investigation. The abovementioned reasons stimulated the idea of extending the classification framework with additional information on its elements. The two main questions that arose concerned the sort of information that should be included and the ways of obtaining this information. Regarding the sort of information, the importance of elements was chosen. As for how to express the importance, the answer was to prioritize the elements. Furthermore, as the classification is structured into perspectives and issues within each perspective, the included information had to be arranged accordingly. This was addressed by using a two levels ranking scheme. The question on how to obtain the required information was translated into three targets for determining: (a) the source of the data, (b) the means for getting the data and (c) the means for extracting information from the acquired data The entire process of obtaining the foreseen information is described in the main body of the paper. The stakeholders involved in consistency in
5
modeling, were chosen as the source for providing data. An empirical study based on survey was used as a means for obtaining the information required for the evaluation of perspectives and issues. A framework approach for such kind of study was elaborated, justified and executed. The framework consists of two elements: elicitation of initial data and interpretation of the data. The elicitation was performed using a survey, based on hierarchical hundred dollar voting [10]. The interpretation was accomplished by applying a method for the analysis of data acquired from the survey, which is presented and justified in the paper. The findings presented in this paper are based on descriptive analysis of the data obtained from the responses of stakeholders and are focused on the prioritization of perspectives and issues by different groupings of respondents. The rest of the paper is organized as follows: Background of the study and related work is reviewed in Section 2. The description of the study is given in Section 3, including presentation of the ideas behind the study, an outline of the consistency classification framework (MDC-F), goals and research questions, subjects involved in the study together with their categorization, description of the structure and contents of the questionnaire used in the survey, followed by information regarding the execution of the study. In Section 4, the Extended Hierarchical Voting Analysis Framework (EHAF) for the analysis of the results is introduced and justified. Application of the framework for analyzing the data of the survey is presented in Section 5. Section 6 contains a discussion on the results of the analysis and on the threats to the validity of the study. The final Section 7 includes conclusions and remarks on possible further usage of the results of the study.
6
2. Research background and related work. Consistency has been recognized early as an important aspect of software engineering in general [11],[12],[13] and later in modeling and UML in particular [14], [15], [16], [17]. Approaches to identify, address and solve various consistency problems, have been presented and discussed in a series of dedicated workshops [3], [4]. Within the overall research related to consistency, proper understanding of the notion together with a systematic view and approach, was of special interest in the early stages of research. In one of the first studies related to the subject, Engels and others considered in [18], [14], [19] syntactic and semantic consistency between models and consistency between different versions of the same model. A model based on two dimensional views for considering and approaching consistency is presented in [15]. According to the model there are two dimensions related to consistency: consistency between models in different phases of development process (horizontal or inter-consistency), and consistency between models on different level of abstraction (vertical or intra-consistency). Another way of approaching the problem is presented in [17], where inconsistency in UML-based modeling is examined by introducing a classification and formal specification of the inconsistencies and also a method for detecting and resolving them. Consistency aspects related to model driven user interface development are discussed in [20], where several dimensions of consistency are considered. Apart of the research on local issues of consistency, there were also efforts to elaborate on methodologies and systematic processes of consistency management. A representative example is a general methodology proposed in [21]. It aims at a step-wise systematic construction of a consistency man7
agement process, by providing a number of activities to be performed by the software engineer in order to define, establish and manage consistency, tailored specifically to the development context. Another example is the methodical tackling of consistency in complex software systems presented in [22] using variants and invariants in conceptual and semantic consistency conditions to ensure the quality of the development process. However, the research efforts related to consistency were oriented on understanding and dealing with the notion itself. The interest was in grouping, classifying and defining consistency instead of grouping and classifying the research problems related to consistency. The MDC-F classification framework that is further examined in this paper is intended to fill the gap and to classify the research related to consistency into perspectives and issues. The classification has been elaborated during follow up activities of the consistency workshops, aiming to serve as a guide in understanding and planning research. The idea behind the research reported in this paper was to extend the classification framework by providing classified complementary data that would express the importance of the classification elements. Empirical research has been used as a means to obtain and analyze the appropriate data. Empirical research is becoming a well established field in software engineering, with an increasing number of dedicated events and tracks in software engineering conferences. Methods and guidelines for empirical research in general [23] and more specifically in software engineering [24] , are being also adapted and applied in the modeling and consistency related research [25], [26], [27], [28] as a means to obtain data and perform empirical evaluation. The empirical data used in this paper were collected by a survey based on
8
hierarchical voting. The method has already been used in studies related to prioritization of requirements [10]. According to this method, the collection of data is based on the hundred dollar test, where the respondents allocate an amount of dollars, out of hundred, to the elements of a set of items which have to be prioritized. In the hierarchical voting the items to be prioritized are structured into groups, the elements on the higher level (groups) are prioritized first and then the items of the lower level are prioritized separately within each group. So, taking into account the structure of the MDC-F classification framework, this technique was used in our study in order to collect the data. Furthermore, a specific method for accurate interpretation of the local data on a global level was developed and justified. The problem of global interpretation of local data was discussed in [10] but the presented solution was not formally justified. The empirical research presented in this paper was carried out in order to fill an identified gap regarding research related to consistency. The study was designed so as to be innovative from the object perspective, providing useful data for further usage in context of the consistency related research (e.g. positioning the ongoing and planning future research). Furthermore, it offers a framework for the interpretation of the data from cumulative hierarchical voting. A research complementary to the elaborated prioritized classification was a systematic review of UML model consistency management reported in [29], where over 900 related papers were identified and 42 selected for further analysis. The review aimed to identify the current state-of-the-art regarding UML model consistency management research along with open issues, trends
9
and future research. It was carried out to find various concepts, models, problems, proposals and solutions related to the consistency in UML software development. 3. Presentation of the study. The study was intended to contribute to the development of the consistency classification framework (MDC-F), introduced in [8], by extending it with empirical data related to the elements which constitute the framework. The appropriate data were collected on the basis of an investigation of the importance of the constituents of the framework. 3.1. The classification framework. The MDC-F classification framework structures the research areas and the research problems related to consistency into perspectives and issues. A perspective represents a specific view on the research problems related to consistency. Each perspective embodies a number of research problems with a common denominator. The following five perspectives were identified: • Concepts perspective: deals with the problem of how to understand and perceive consistency in general and in particular contexts, • Pragmatics perspective: is focused on how to realize consistency in practice, namely how to check and ensure consistency, given that the notion has been clearly defined, • Development Process perspective: investigates what is the relationship between consistency of artifacts constructed within different elements 10
constituting the development process (phases, activities and tasks) and also how to maintain consistency within development process, • Language perspective: addresses consistency within a modeling language and between modeling languages, • Quality perspective: considers relationship between consistency and quality. Each perspective can be considered as a set of issues. An issue is a particular research problem to be addressed within a perspective, that is, when approaching consistency from that perspective. The numbers of indicated issues in each perspective differ; they are between 6 and 10. Complete list of issues in each perspective can be found in Appendix A. 3.2. Aim and objectives. As the framework is based on perspectives and issues, the aim of the study was to investigate how the perspectives and issues of the framework are perceived by the stakeholders related to the research on consistency in modeling, and how theirimportance varies among different groups of stakeholders. More specifically, the objectives of the study could be listed as: • to expose how consistency research stakeholders value perspectives and issues from the classification framework, • to provide initial guidelines for classifying and valuing the ongoing as well as planned research related to consistency, • to prepare a background for more elaborative work on approaching consistency in modeling. 11
3.3. Research questions. The following two basic research questions related to the importance were identified: • how important are the perspectives? • how important are the issues globally and locally in perspectives? The aforementioned basic questions were later broken down into detailed questions based on the respondents roles (the roles were introduced in order to group and categorize the respondents and are explained in the following subsection). The breakdown was intended to answer the questions of: How the stakeholders in general and how different categories of stakeholders prioritize the perspectives and issues linked to the research related to consistency in modeling? In particular: • what are the most important perspectives and issues in general? and • what are the most important perspectives and issues for different categories of the respondents? 3.4. Research method. In general, several empirical methods, such as experiments, field studies or surveys, can be used to gather data and extract information needed to answer research questions [23]. In our case, the basic foreseen information was the information on the importance of elements from the classification as they are
12
perceived by the stakeholdes invlved. The idea behind the way of conducting the study was first to approach a number of stakeholders and ask them questions targeting prioritization of the perspectives and issues constituting the classification and then to analyze the data obtained from the answers in order to extract the desired information. As a natural mean for expressing the prioritization, cumulative hierarchical voting [10], i.e. a structured version of cumulative voting [30] was chosen. In this test, a respondent is given hundred dollars which later should be allocated across the elements that have to be evaluated. The amount allocated to an element, is supposed to represent the relative importance of that element with respect to other issues. The test was used both globally, to obtain data for the prioritization of the perspectives as well as locally within each perspective, in order to obtain data representing prioritization of the issues inside each perspective. The questionnaire used in the survey was design to mirror the perspective and issues from the investigated classification. The basic elements of the questionnaire, described in section 3.6 and provided in Appendix B, were the information about the respondent and the hierarchical hundred dollar voting table. 3.5. Population. When designing a survey there are two important issues that should be addressed: (a) the definition of the population under investigation and (b) the decision on how to sample the population, namely how the representatives of the population are to be chosen. In the context of the present study, the sampled population was defined as consisting of the stakeholders involved in the research on consistency in mod13
eling; that is, those who are doing research related to consistency, producing research results related to consistency or those who use the results produced by others. In other words, those who are or could be directly interested in the research related to consistency or who influence this research. 3.5.1. Categorization of respondents. It has been noticed that the population is not homogeneous and its members may come from different places of professional activity or may have different backgrounds, different aims and targets in performing the activity. For the purpose of the study the following six categories of stakeholders were distinguished: • Academia-Theory (AT) - persons working in academia and conducting research directed to the theory rather than applications (a.k.a. basic research), • Academia-Practice (AP) - persons working in academia and conducting applied research, • Industry-Practice (IP) - persons who work in industry and are directly involved in the work related to concrete software products, • Industry-Research (IR) - persons who work in industry with research involvement and responsibilities, • Tool Building-Academia (TA) - persons who are working in academia and are involved in development of an MDD oriented tools,
14
• Tool Building-Industry (TI) - persons who are employed in companies and are working on development of professional tools for MDD and who are involved in construction of such tools. The identified categories of responders were used later for organizing the results of the survey. Specifically, the performed analysis of the otained data was structured in four different ways: • Flat analysis : global analysis, without considering the categories of the stakeholders, i.e. no grouping of the respondents was considered, • Basic Grouping : analysis driven by categorizing the stakeholders into the six basic stakeholders categories, • A-I Grouping : the analysis based on grouping the stakeholders into two major categories: stakeholders from Academia and stakeholders from Industry, • A-T-I Grouping : based on grouping the stakeholders into three major categories: Academia, Tool-Building and Industry. Based on that categorization, each of the main research questions was broken up into four sub-questions taking into account the grouping of the stakeholders. 3.5.2. Sampling. The sampling was essentially based on the stakeholders availability. The sample of the entire population that has been approached was formed by persons that were known and were considered experts in their field. 15
There were two sources of respondents: (a) participants of the consistency workshops and (b) persons who were recognized either as directly involved in different sorts of activities related to consistency or those doing research in software engineering in general and having potential interest in using the results of various consistency related research. An overall idea was to acquire a reasonable amount of data from a reasonable number of stakeholders. The sampling of the individuals was continued until fulfilling the requirement of having at least three individuals in each of the six basic categories of respondents. Allocation of each of the respondents to a specific category was done by the respondents themselves. This was achieved by asking identification questions in the questionnaire used in the study. 3.6. The questionnaire. Two basic sorts of information were foreseen from the survey: information on the subjects involved in the investigation, conforming to the the categories of the respondents, and the information on prioritization of the elements of the classification. The features obtained from the questionnaire are: • C : represents the category of the respondents, it takes values from the set {AT, AP, IR, IP, T A, T I} reflecting the introduced categorizing of stakeholders (see Section 3.5.1), • pi : i=1,. . . ,5; represent the amount of dollars allocated to the perspectives, and must sum up to 100, (1=Concepts, 2=Pragmatics, 3=Development Process, 4=Language, 5=Quality); and 16
global classification (6 categories)
No Resp.
A-T-I classification ( 3 categories )
No Resp.
A-I classification 2 categories
No Resp.
Academia-Theory
3
Academia
9
.
Academia-Practice
6
.
.
Academia
Industry-Researchy
4
Industry
8
.
Industry-Practice
4
.
Tool Building-Academia
4
Tool-Building
7
.
.
Tool Building-Industry
3
.
.
.
.
Industry
. 13 . 11
Table 1: Distribution of respondents
• qi ,j : i=1,. . . ,5, j = 1, . . . , |i|; represent the amount of dollars allocated to issue j in perspective i, and for each i must sum up to 100. Note that by |i| we denote the number of issues in perspective i. These numbers are respectively 10, 8, 8, 7 and 6 for each one of the perspectives. The distribution of respondents to categories is given in Table 1.
4. Framework for the analysis. Data obtained by executing the survey contained two main sorts on information: • prioritization of perspectives and issues, expressed by allocation of the appropriate values in the extended hundred dollar test, and • information, allowing categorizing the respondents. 4.1. EHV-F framework for analysis of the hierarchical voting. To perform the analysis in a systematic and structured way an extended hierarchical voting analysis framework (EHV-F) framework was set up. Within
17
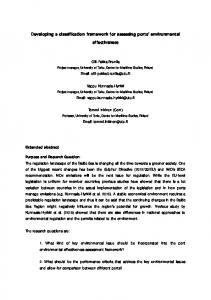
the framework, the data are to be examined in a systematic way using descriptive analysis in order to study the preferences of the respondents. The data are to be analyzed from two basic points of view: • objects point of view, where the analysis is structured by the categories of objects, that is the consistency classification framework, • subjects point of view, where the analysis is structured by the categories of subjects, that is the categorization of subjects discussed in section 3.5.1. In both cases the analysis is to be shaped according to the structuring and categorization imposed earlier on the objects and subjects. In the case of objects, the arrangement is based on the categories of objects, that is, on the consistency classification framework. In the case of subjects, the structuring is done in agreement with the categorization of subjects. In the objects driven view, two specific grouping and sub-grouping of data are considered: • P : Perspectives view – when the part of answers related only to perspectives is considered, • I: Issues view – when the parts of data related to issues within perspectives are considered and the analysis will be split into: – IL: Local view : when issues within a particular perspective are locally analyzed, – IG: Global view : when all issues from all perspectives are analyzed and weighted by the perspectives. 18
Grouped
Perspectives
P
All
B
A-I
A-T-I
N
N
N
N
N
N
N
N
IL1 Local Issues
IL2 IL3 IL4 IL5
Global Issues
IG
Figure 1: Roadmap for analysis
The subjects driven view is built up in line with the categorization of roles of the respondents, so two main categories will be used: • F lat view - where answers of all respondents are considered • Structured view - influenced by the roles of the respondents, where the answers are grouped according to the categorization of the roles of the respondents imposed by the introduced stakeholders categorization. The structuring is done in order to reflect the groupings of the respondents into the following sub-views: – { A-I } : Academia-Industry view : categorizing into Academia and Industry is done, – { A-T-I } : Academia-ToolBuilding-Industry view : categorizing into these three categories is taken into account, – { B } : Basic view : all six categories of roles are concerned.
19
The analysis in EHV-F is structured by two groups of views: perspective views (P), and issues views (I), see Figure 1. The analysis is to be performed N only on cases marked by because local analysis of issues in perspectives can be derived from the global analysis. For each of the views, two types of artifacts are used: • numerical: Statistics (minimum, maximum, mean, median and standard deviation) • graphical: Mean Bar Plots figures. The above artefacts include some overlapping information. Specifically, the figures that can be seen in the bar plot show the mean of each of the perspectives with a vertical line is extending in an interval of one standard deviation above and below the mean. Using the two forms may seem redundant but is deliberate, as the graphical form was used to observe some evident characteristics of the data for more detailed examination with numerical forms. The analysis of each perspective views is to be done with the original values of the allocated amounts. For the global views, weighted values are to be used. 4.2. Discussion of hierarchical voting analysis. When planning the analysis, apart from analyzing the data separately on global and local level, we decided to analyze local data in the global context. Initially, in order to have another way of looking on the data, but it was found out that such perspective can reduce considerably the number
20
of cases in the analysis. However such approach led to the question of a proper interpretation of the local data in the global context - that is how to perceive the amount of dollars allocated locally to an issue from a global perspective. Below we present the problem of global interpretation of local data, followed by a method we suggest as a proper way of dealing with the problem, together with a justification of the method. 4.2.1. The problem. The problem in general concerns the question of how to use the local values of issues while performing the analysis from a global view. When we want to analyze global importance of the issues, the importance of the issue should be related to the context or to be considered in the context of the importance of the perspective. An intuitive approach is to multiply importance of the issue by that of perspective encapsulating the issue. But in the case of our survey the number of local issues in perspectives is not the same. When we have to distribute 100 dollars among 10 issues in one perspective, and 100 dollars among 6 issues in another perspective, then allocating 10 dollars to issues i1 in the first perspective and 10 dollars to issue i2 in the second perspective should be interpreted differently when the issues are considered from the global perspective. Thus the local prioritization within perspectives should be adjusted to the same scale or be normalized in order to be properly interpreted on the global view. The question is how to do this.
21
4.2.2. The method. The way of analyzing the local issues globally is to normalize the data representing the issues. The normalization is done by weighting of the allocated amounts, taking into account the number of issues in each perspective. A good ad hoc solution is to multiply the amount allocated locally for an issue within the perspective by the number of issues within the perspective. The values can also be divided by the maximal number of issues within perspective in order to keep the amounts within the upper limit for the allocations. Another possible normalization operation is to divide all the allocated values by 100 so that the values can be treated as probability values, and this will be used in the following justification and in the analysis section. Using the following notation n : number of respondents, k : number of perspectives, rj : number of issues in perspective j, j = 1, .., k, pi,j : percentage of money allocated by respondent i to perspective j, i = 1, ..., n, j = 1, .., k j qi,s : percentage of money allocated by respondent i to issue s
of perspective j, i = 1, ..., n, j = 1, .., k, s = 1, ..., rj the formula for the interpretation of the local issue s from perspective j on global level is j qi,s ∗ pi,j ∗ rj .
22
4.2.3. Justification. The weighting can be justified by considering it as a problem of relative importance of the issues. If respondent is asked to allocate just 1$ to an issue, the probabilities of allocating it to each different issue (issue s of perspective j) are computed j by pji,s = pi,j ∗ qi,s .
The question is: How important, respondent thinks, a specific issue is? In order to answer this question let us assume that the respondent allocates the 1$ completely at random. This means that first the respondent chooses a perspective j at random with probability
1 k
and then allocates the 1$ to an issue of the perspective
randomly with probability
1 . rj
So, finally the probability for respondent i of allocating 1$ to issue s of 1 1 perspective j completely at random is p∗j ∗ . i,s = k rj In order to measure the importance the respondent i gives to every issue, (or the degree of preference of each issue) we can compute the ratio pji,s p∗j i,s
= k ∗ rj ∗ pji,s
Thus this importance measure is taking values between 0 and krj in each perspective. A value > 1 means that the importance of this issue is above average (expected), while a value < 1 shows importance below average (expected). Since k is a constant, it can be omitted from the calculations. Then in each perspective the measure takes values between 0 and rj . Finally, in order to have all values in the range [0, 1] they can be divided 23
by max {rj }
1≤j≤k
. 5. The Analysis. The observations and comments presented in the paper are restricted to interpretation of basic inclinations that can be spotted from preliminary statistical analysis. Firstly, the classification of the respondents is presented and then we proceed to the analysis of their responses from different views using the analysis framework introduced in previous section. The organization of the subsections 5.2 and 5.3 reflects the structure of the framework, that is starting with the higher level information related to perspectives and proceeding to the lower level concerning issues. In both cases, the analysis starts start with the all-respondents view, going into more specific groupings. The most visible findings are highlighted, leaving more general reflections to the discussion section. 5.1. Global analysis of the respondents. There were 24 respondents in total. Their allocation to the identified categories is presented on figure 1. There was one slightly dominating category when the fine grain grouping is considered – Academia-Practice. But this discrepancy disappears when coarser grouping is done. Otherwise the distribution of the respondents was relatively even and fair.
24
Figure 2: Bar chart for (P.All) view
5.2. Perspectives view The analysis of the view is structured according to the groupings of the stakeholders into roles, starting from the overall general view and going into more fine grained groupings. 5.2.1. (P, All) view : perspectives for all of the respondents. The composite bar chart in Figure 2 shows the mean values of all perspectives.while the descriptive statistics for the view is presented in Table 2. The Pragmatics perspective comes first in average importance, followed by the Development Process and the Concepts, while the Language and Quality perspectives get the least importance with a very small difference. It is important to notice the minimum and the maximum values of all perspectives. 25
Figure 3: Bar chart for (P, A-I) view
5.2.2. (P, A-I) view: perspectives with respect to 2 roles. The mean values of all perspectives in each of A-I roles are shown in Figure 3 and Table 3 presents the corresponding descriptive statistics. The Pragmatics perspective keeps to be considered as the most important by both Academia and Industry categories, but has also the highest standard deviation in both – meaning that even it is considered as the most important; there is not consensus on the level of the importance. Agreement within the categories on evaluating the perspectives is similar, except for Quality in Academia and for Pragmatics in Industry – where there is more disagreement.
26
Figure 4: Bar chart for (P,A-T-I) view.
5.2.3. (P, A-T-I) view: Perspectives with respect to 3 roles. The results of extracting a specific class of stakeholders from Academia and Industry are presented in this view. The appropriate composite bar chart and table are in Figure 4 and in Table 4. The Concepts perspective gets in average the highest amount in the Academia category, and lowest in the Tool-Building, which is in line with expectations, meaning that concepts are important for academia, while not so much for Tool-Building. The most important for the Tool-Building is the Pragmatics. The following three observations reflect their importance for the categories and again are in line with expectations: – the Development Process gets in average highest amount in the Industry category, 27
Figure 5: Bar chart for (P, B) view
– the Language gets highest average amount in the Tool-Building and – the Quality gets highest amounts in the Industry category. It is also visible that all the categories have the same pattern for prioritizing Pragmatics and Development Process, while they differ with respect to Language and Quality: Pragmatics perspective continues to be the most controversial perspective in all categories. 5.2.4. (P, B) view - perspectives with respect to all 6 roles. The mean values of all perspectives in each of the roles are shown in the composite bar chart in Figure 5 and the corresponding detailed values are presented in Table 5. The Pragmatics is the highest valued perspective in general and gets the
28
highest value in all classes except Industry-Research. From the statistics table it can be seen that the Pragmatics takes the highest value of 60 dollars in the Industrial Practitioners category and in the Industrial Tool-Building. Pragmatics was also obtaining the highest values among all perspectives in all categories except Industrial Researchers who assigned the highest value to Development Process (35 dollars). 5.3. Issues – global view. According to the discussion in the description of the analysis framework in Section 4.1, the analysis for the issues was done only for the global view. The tables with statistics are rather large, so we show in full only the panel-bar charts, and we present and comment on only the interesting and relevant figures in the tables. The bars in the charts represent the mean of each issue in the corresponding category. We also placed horizontal lines labeled with Top 5, Top 10 and Bottom 5 in order to point out the highest and the lowest values. We start by examining the issues from the global perspective without grouping the respondents and later go to investigate how the global preferences are distributed among categories, from coarse to fine grouping of the respondents, which is in line with the analysis of perspectives done in the previous subsection. 5.3.1. (IG- All) view : Issues for all of the respondents view. The graph in Figure 6 presents the panel-bar chart (without standard deviation lines) and shows the average of all the issues in a comparative way. Looking for the highest values, a large value for issue 2#6 in Pragmatics 29
Top
5
Top
10
Bo)om
5
Figure 6: Bar chart for (IG, All) view
30
can be spotted, significantly rising above even the other values on issues in Pragmatics and all other perspectives. The value is followed by a group of three highly valued issues all coming also from Pragmatics. Then there is a group of two from Concepts and Development Process, and the next the group of four from Concepts, Pragmatics and Process. The lowest value has been assigned to 5#5. In the lowest five values, we have three issues from Concepts and one from Language. The lowest issue from Pragmatics is the ninth. The highest values for Language and Quality are on the same level as the lowest for Pragmatics (and they will share three neighbor places in the very middle of the sorted sequence of values). The issues in the Concepts are very radically evaluated. Some have high values, while the others rather low. Most of the issues from the Development Process scored relatively high values. Inside Language and Quality the issues are ranked quite uniformly while inside the other perspectives we have large differences. 5.3.2. (IG, A-I) view : Issues with respect to 2 categories. Relative importance of issues within Academia and Industry is presented in Figure 7. The highest valued issue comes from Industry, where it is almost 30 % higher than the next three. In industry the five most important issues come from Pragmatics, while in Academia the five most important issues are three issues from Pragmatics and one issue each from Concepts and Development Process. Pragmatics is also better balanced in Academia than in Industry. Three out of five of the lowest issues for Academia are in Concepts, while Industry places the three lowest issues in Language. For Pragmatics, 31
Top
5
Bo#om
5
Top
5
Bo#om
5
Figure 7: Bar chart for (IG, A-I) view
32
Top
5
Bo#om
5
Top
5
Bo#om
5
Top
5
Bo#om
5
Figure 8: Bar chart for (IG, A-T-I) view
Academia and Industry are in agreement on issues 3-6, while the others are valued differently. For the issues from Language and Quality, there are no strong preferences, while some more preferred issues can be spotted in the valuing in of the Industry. 5.3.3. (IG, A-T-I) view: Issues with respect to 3 A-T-I categories. Results of the distribution of relative importance allocated to issues among the three categories of respondents Academia, Tool-Building and Industry are presented in Figure 8. Issue six from Pragmatics remains the one that obtained the highest value 33
in Industry and Tool-Builder, but not for Academia, where issue 4 from Concepts got the highest score. When we look for the five most valued issues in each category, then in Industry all five are in Pragmatics, in ToolBuilder four are Pragmatics and one in Concepts, and in Academia one is in Concepts, three in Pragmatics, one in Development Process, and they are very close in values. When the smallest values are considered, Industry places them mostly in the Language perspective (four out of five), one in the Concepts and they are very close in value; the other two categories have them more evenly distributed among all the perspectives except the Pragmatics. In general Industry and Tool-Building are more in agreement or use the similar pattern for valuing, while Academia is rather different in prioritizing. Among the views, the Pragmatics view seems to be most similar for the three categories. 5.3.4. (IG, B) view : Issues with respect to 6 categories. The panel-bar charts are presented in Figure 9, where each panel represents one of the 6 Basic categories of respondents. Issues in Pragmatics get high values, but there are obvious differences between categories concerning the distribution of priorities to issues. They are most highly valued by Industry Practitioners as well as Industry ToolBuilding and Academia-Theory. The most highly valued issue 2#6 in the previous views is no longer the same here, it is not the most important in the Academia-Theory and Industry-Research. There are several issues that got very low importance. They come mostly from Concepts and Quality and one comes from Language. The most moderate in prioritization are the members from Industry Re34
Figure 9: Bar chart for (IG, B) view
35
searchers and also Academia-Practice since they distribute the preferences most evenly, the most extreme are those from Academia-Theory, who have very strong high and low priorities Quality issues are of less importance for them as well as issues from Concepts, while strongly prioritizing three issues from Concepts and two from Pragmatics. Issues from Quality get relatively high values in both Industry categories and in Academia-Practice. 6. Discussion. The discussion is divided into two main parts: presentation and comments on the main results of the performed empirical investigation and the identified threads to validity of the study outcomes. 6.1. General observations from the survey In this section, prioritization of all the high level elements from the classification is discussed. Some most visible and interesting findings about low level elements are pointed out and commented. 6.1.1. Prioritization of the perspectives. The perspectives are discussed bellow in the ascending order of their general importance. Pragmatics.. This perspective is considered as the most important in general, in the global view (when all the respondents were considered), but also in all local views (when the respondents were grouped based on their identified roles) with an exception of the Industry-Research category in the finest
36
grouping. The perspective is more important for Industry than for Academia, and even more important for Tool-Building category. It is interesting to spot a significant disagreement in valuing the perspective within Industry. The perspective is very highly appraised by both Practitioners and Tool-Builders (more than twice as much as the next perspective in importance) while it comes third for Industry-Practitioners. Within Academia, the perspective is more important for Theory and Tool-Building subgroups than for Practitioners, but the differences here are not so large. In general, practical aspects on consistency are highly recognized by Academia-Theory and Tool-Building. Development Process.. This perspective is the second important in general. It is valued almost at the same level when coarse grouping into Academia, Industry and Tool-Building is considered. However significant differences occur inside the groups when finer grouping is analyzed. The perspective is more important to Practitioners in Academia than to the Theory group, in Industry it is more important to Researchers than to Practitioners, and Tool-Builders in Academia value it much higher than those in Industry. Generally, the Development Process perspective is perceived similarly by members of Academia-Practice and Industry-Research categories, it is highly valued by Tool-Building-Academia and it is the most important to IndustryResearch. Concepts.. The concepts perspective received medium importance in the global view. The perspective is considered as important from the academia and research point of view, and is of low significance for those who are involved in practical usage of modeling. 37
Language.. In the global view, the Language perspective received almost the lowest importance (the difference between the last two, Language and Quality, is minimal). The differences can be spotted when the groupings are examined. It is more important to Academia than to Industry and even more important for Tool-Building. The distinction becomes strongly visible in the fine grouping. Language is the second important perspective for ToolBuilders-Industry and has got a very small value in the Industry-Practitioners category. Quality.. Quality, in the global view has the lowest importance, but the prioritization of the perspective is becoming very diverse when we examine how it is valued in different categories. It is relatively very important when we consider Industry without Tool Builders, and becomes extremely important for the Industry Practitioners, for whom it is close to be the second important and is three times more important than Language. It has also relatively high value in the Academia-Practice category and lowest value in the AcademiaTheory and Tool-Building Academia categories. On the whole, the more practically oriented the group is, the higher value it assigns to Quality perspective. Patterns in groupings.. When we try to find and examine prioritization patterns in different groupings it can be observed that: Tool-Building category has a similar pattern to Industry when the three most important perspectives are concerned and the category is in agreement with Academia in prioritization of the two perspectives of lowest importance. In the fine grouping only two categories, Academia-Theory and Tool Building-Academia, have similar prioritization patterns. 38
6.1.2. Prioritization of the issues. The presentation and discussion relates to the importance of issues in general, and as they perceived by different groups of stakeholders. Further, it is done mainly for the issues that are considered as the most important in general as well as along the categories of the stakeholders. Next, only a selected set of the most important issues is commented. The majority of the important issues come from the Pragmatics (3 or more out of 5, 5 or more out of 10), both in the global view as well as in almost all groupings, with only two minor exceptions in the fine grouping: Academia-Theory and Industry-Research. The most important issues relate to different aspects of checking and ensuring consistency. The most highly issue voted issue is: 2#6: Tools support for checking and ensuring consistency – from Pragmatics. Only few issues in the fine grouping (from Concepts in Academia-Theory and Development Process in Industry-Research and Academia-Practice categories) are at a comparable level. The following two issues are next in importance under the general view: 2#4: Procedures and algorithms for consistency checking, 2#5: Ensuring consistency with model transformations and refactoring. These, remain highly important within the Academia-Industry grouping, but some differences can be noticed inside finer grouping into six categories. For Tool-Building ensuring consistency is of significantly less importance. In the fine grouping into six categories, these two issues are of very high importance
39
for Academia-Theory and for Industry-Practice, significantly higher than for Industry-Research, a finding which may seem surprising. The issue: 2#3: Verification of the code against the model is fourth in the general ranking and retains this ranking for Industry, but it is less important for Academia. It is really important for Tool-Building, especially for those in Industry. Another interesting remark is that within Industry, it is twice more important for Practitioners than for Researchers. The following two issues do not belong to Pragmatics and are leaders within their perspectives: 1#4: Checking consistency between modeling artifacts – in Concepts, and 3#5: Checking inconsistencies within development process – in Development Process. It is interesting that they both refer to checking consistency (but from different points of view). Both issues are more important for Academia, less for Tool-Building and even less for Industry. The following in the importance are two issues from the Concepts: 1#1: Understanding the concept , and 1#3: Formalization of consistency . The issues are highly and almost equally valued, both in Academia and Industry with an emphasis on formalization in Academia and understanding in Industry. In the most detailed view, both understanding and formalization are the most important for Academia-Theory and Industry Researchers groups, the less important for Industry Practitioners while their importance is relatively high for all the others.
40
The last in the group of the ten highly evaluated issues is: 3#1: Consistency driven development process, which gets the highest values in Industry in all groupings, and within Industry in Researchers. It is also more important for Tool-Building than for Academia. The less important issues in general come from Quality and Concepts. Actually, the issue that is ranked last in importance is: 5#5: Degrees of consistency (as a basis for quality measurement), which gets better ranking when groupings are taken into account. 6.2. A remark on the classification framework. It should be pointed out that intentionally, the classification framework is not orthogonal either when the perspectives or the issues in the perspectives are considered. In fact, it includes cross-cutting issues among the perspectives. This is intentional and realistic, conforms to the general belief and is the result of discussions with several stakeholders. Quality perspective is a good example of the problem. Elements of quality are present in all other four perspectives but quality can also be considered as a separated group of specific issues forming a specific point of view on problems related to consistency, thus being a perspective in the framework. Similar remarks apply to several cross-cutting issues within and between the perspectives. An example of cross cutting within a perspective, are two issues in the concept perspective: #1: understanding the concept and #10: concept of consistency in MDD, 41
The first relates to the overall, general concept of consistency in modeling, while the second addresses consistency in a specific context, where the problems to be solved as well as the approaches are specific and some stakeholders may wish to emphasize their particular interest in that context or even neglect the more general view. An example of cross-cutting between perspectives, are the issues #10 (mentioned above) in Concepts perspective and issue #2: understanding of consistency in the context of MDD in Development Process perspective. The first is supposed to express and valuate the importance of the role of MDD context when we look on consistency from the Concepts perspective (when our main concern is elaborated on concepts), while the second is supposed to express and valuate the importance of understanding the concepts of consistency in MDD context when considering development process view as a perspective. 6.3. Validity of the study. There are two main arguments against possible threats to the validity of the present study: (a) the research is basically exploratory in the sense, that it contributes
to understanding how the opinions of stakeholders on prioritization of perspectives and issues related to consistency research can enhance a proposed classification framework. Therefore there was no explicit and formal hypothesis on a relationship between the cause and the effect of any treatment and the outcome, as it is suggested in the standard model for empirical research [23]. (b) the data were collected as responses from stakeholders which are re-
42
liable professionals, with expertise and substantial interest in research and not from randomly selected individuals. Therefore, the study is actually based on expert judgments, which are in many ways invaluable. The discussion on the validity of the study will be directed by four types of validity pointed out in [23]: construct, internal, external and conclusion validity. Construct validity concerns the design of the instrument used in the study and the assessment that the instrument measures what it is aimed to measure. Internal validity concerns the causal relationship between the treatment and the outcome. External validity has to do with the ability to generalize the results. Finally, conclusion validity is about being able to draw correct conclusions on how the treatment affects the outcome. 6.3.1. External validity. A potential threat of this validity aspect is the fact that the sample size can be considered small and that the sampling was based on convenience, in the sense that the stakeholders can be approached only under very special circumstances. So the participants may not represent the population. The population under investigation was identified as all the persons involved in the research related to consistency in modeling, i.e. those who either perform the research or use (directly or indirectly) the results of the research. The sampling was conducted by approaching well respected individuals, recognized as potential stakeholders. They were mainly persons involved in consistency related workshops, like participants, authors and PC members, but also persons from the research environment of the authors and industry collaborators. Therefore, we believe that the stakeholders approached 43
were good representatives of the population as they carry knowledge and experience in their fields. Moreover, the conferences are well established and recognized forums, gathering both researcher and practitioners involved in modeling in software engineering. The consistency workshop has been carried for several consecutive years and this fact decreases the risk of missing essential stakeholders. One more argument against external validity threat is that the lack of homogeneity within the population has been taken into account very seriously by categorizing the respondents into groups based on the specific role they have. The categories of the stakeholders and their grouping came up during discussions on the design of the study and seemed to be well justified. However, the allocation of each subject to a specific category was subjective, based on the subjects declaration (an appropriate section where the subjects should declare their category was included in the questionnaire). The subjects were asked to choose a category which fits best to their involvement, to answer the main part of the questionnaire and to allocate their preferences from that point of view. All the members of the same category were treated as equal. Weighting the answers based on factors such as kind and time of experience, type of project involved in, would decrease the possible confounding. Regarding the number of respondents, as we already mentioned, it was not easy to convinced the stakeholders to be involved in the study. The initial response rate was not high; around 30 % of the approached persons, and the sampling continued until at least three respondents in each stakeholder group have responded to the survey. This was decided in order to ensure that the
44
data could be further utilized for statistical analysis. On the other hand, this attempt can be a source for another threat to the external validity since it resulted in a relatively evenly distributed sample, while the real distribution of the stakeholders to roles is unknown. 6.3.2. Internal validity. As the present study is an exploratory survey and not a formal experiment, there is no matter of threat, regarding the causal effect of a treatment on the outcome. The respondents prioritized the perspectives and their issues according to their professional interests and expertise. So, there was no intend to make inferences on the effect of any treatment and therefore there is no threat to misinterpret causal relationships. 6.3.3. Construct Validity. A potential threat in this regard is that the instrument used in the study could have been badly designed. We believe that this threat is diminished, since the hierarchical voting prioritization [10] is specially designed to alleviate the prioritization effort of the stakeholders as much as possible. This structured version of the hundred dollar test was explicitly fitted to purpose of the study. Specifically, for the curried out research, it was structured in two levels, perspectives and issues within the perspectives, reflecting the structure of the consistency framework which aimed to enhance. Therefore, in order to ensure proper construct of the survey, the questionnaire was designed in such a way that the elements to be valued, strictly correspond to the elements of the evaluated framework. In order to ensure properly justified prioritization of the elements of the classification, defini45
tions of all the perspectives and issues from the framework were provided together with the questionnaire. 6.3.4. Conclusion Validity. Since the target of the survey was to investigate how the respondents prioritize perspectives and issues, the misinterpretation of the results could be a potential threat. The challenge faced when working on the conclusion of the study, was related to the proper and justified interpretation of the data. The interpretation of the same data at two levels (local and global) was essential in the study. In order to avoid possible threats related to interpretation, we addressed the problem of the prioritization of issues within each perspective. Specifically, since the number of issues was not the same within each perspective, we used the weighting method proposed in [10] in order to put all issues in a common base and obtain the interpretation of their importance under a global view. Moreover, in 4.2 we describe formally the method which was used in[10] but was not properly justified. We believe that all this systematic handling of data contributes to both the conclusion as well as to the internal validity of the study. 7. Summary. The paper reports on an empirical study performed over a framework for classification of the research related to consistency in modeling in order to extend the framework with information on valuation of its elements. The framework is aimed at organizing both the approaches to the research and also the related research problems. It is based on the perception of the research related to consistency in model based development by the stakeholders 46
involved in the research. The empirical study was intended to add information of the relative importance of the elements constituting the framework. The paper describes the stages of the study, including design of the survey, analysis of data and interpretation of the results. The classification framework was intended originally for classification of the research related to consistency. The goal of the empirical study was to extend the framework with empirical data for relative positioning the ongoing research as well as to provide a set of assets that can be used in planning future research. The classification framework can be considered as a sort of a hierarchical map (or structured representation) of consistency related research, while the results from the study can be thought of as a coloring of the areas on the map reflecting the importance of the regions. There were two basic research questions addressed and answered when performing the research: how to design and conduct the study, and how to obtain foreseen classified data from the initial data provided by the respondents. The first is answered in Section 3 by presenting the design of the survey, followed by the description of the way of conducting the survey. The second is answered by development of a framework for the analysis presented in Section 4 and application of the framework described in Section 4.1. Elaborating on the proper ways for analyzing the data, the problem of the global interpretation of the local data in the weighted hundred dollars voting was encountered. A proper way of interpreting the data was built up, justified and applied. The method of interpretation seems to be a considerable contribution that can be reapplied in the studies using such voting. A problem addressed when designing the study, was the diversity of stake-
47
holders involved in the research related to consistency. Instead of treating the population as homogeneous, several categories of stakeholders based on characteristics reflecting their affiliation, type of involvement and type of activity were introduced. The analysis took into account the categories, using fine and coarse groupings of the stakeholders. The categorization of the stakeholders was subjective, based on a self assessment of the subjects. The intent behind the work presented in this paper was to supply empirically enhanced classification. Using the empirical numerical data from the survey, the valuation of the different aspects related to such research (expressed by the importance of perspectives and issues) in general and by specific groups of stakeholders is provided. There is an agreement on the high importance of the issues from the pragmatics perspective, since they are most highly valued when all the stakeholders are considered, as well as when grouping the stakeholders according to the introduced categorization. Otherwise, the prioritization is more dependent on the grouping of the stakeholders, that is, more relative to the context from which the stakeholders evaluate the perspectives and issues. Both the original framework expressed by the questionnaire as well as the framework extended with the classified information from the survey should be considered as a sort of an empirically enhanced compromise, based on stakeholders feedback. The first was influenced indirectly during the discussion on the elements constituting the perspective and the issues, the second was influenced directly through the survey used in order to add prioritization to classification elements. Both can be used in their current state but also are subject to further enhancement and extension.
48
The extended classification framework presents a justified perception of the research related to consistency. It gives rise to awareness of what is really done, what is important and how it is important; increases knowledge related to the research area and stimulates the interest. Furthermore, it is adjustable, can evolve in time and be adapted to a particular research environment by introducing new elements on both levels of the classification, which can be further validated and extended with the empirical data according to schema presented in the reported research. Further research directions based on the reported study and related to both the instruments and method as well as the object can be pointed out. Such directions are the extension of the analysis framework on the obtained data into a statistical framework for similar surveys and statistical analysis of the relationship between perspectives and issues as well as with the groups of respondents. An interesting potential for further work is a research towards combining the results of the work reported here and the systematic literature review reported in [29], into a consistency research guide. This will integrate a structured view of the research problems together with their prioritization and furthermore specification of open and answered research questions. 8. Acknowledgements We would like to thank all those who were involved in the survey and made considerable effort to read the survey artefacts, reflect and provide the answers. We are also grateful to the journal reviewers for their constructive remarks which allowed considerably improve the paper.
49
References [1] D. C. Schmidt, “Model-driven engineering,” IEEE Computer, vol. 39, no. 2, pp. 25–31, 2006. [2] R. France and B. Rumpe, “Model-driven development of complex software: A research roadmap,” in FOSE ’07: 2007 Future of Software Engineering, (Washington, DC, USA), pp. 37–54, IEEE Computer Society, 2007. [3] MoDELS Conferences. http://www.modelsconference.org/. [4] ECMDA conferences. http://www.ecmda-fa.org/. [5] Nordic Workshops on Model Driven Engoneering and UML,. http://nwmode2008.hi.is. [6] Z. Huzar, L. Kuzniarz, G. Reggio, and J.-L. Sourrouille, “Consistency problems in uml-based software development,” in UML Satellite Activities, pp. 1–12, 2004. [7] M. Staron, L. Kuzniarz, and L. Wallin, “Case study on a process of industrial MDA realization: determinants of effectiveness,” Nordic J. of Computing, vol. 11, no. 3, pp. 254–278, 2004. [8] L. Kuzniarz, “Consistency issues in modeling,” in Proceedings of the Workshop on Consistency in Model Driven Engineering at ECMDAFA European Conference on Model Driven Architecture - Foundations and Applications, Nurnberg, November 2005, pp. 1–10, 2005.
50
[9] MDC-F Framework: Description of Perspectives and Issus. http://www.ipd.bth.se/Research/MDC-F.pdf. [10] P. Berander and P. J¨onsson, “Hierarchical cumulative voting (HCV) - prioritization of requirements in hierarchies,” International Journal of Software Engineering and Knowledge Engineering, vol. 16, no. 6, pp. 819–850, 2006. [11] A. Finkelstein, D. Gabbay, A. Hunter, A. Hunter, J. Kramer, and B. Nuseibeh, “Inconsistency handling in multi-perspective specifications,” IEEE Transactions on Software Engineering, vol. 20, pp. 569– 578, 1994. [12] J. Grundy, J. Hosking, and R. Mugridge, “Inconsistency management for multiple-view software development environments,” IEEE Transactions on Software Engineering, vol. 24, pp. 960–981, 1998. [13] P. Fradet, D. L. Metayer, and M. Perin, “Consistency checking for multiple view software architectures,” in Proc. ESEC/FSE99, LNCS series, pp. 410–428, Springer, 1999. [14] G. Engels, J. M. Kuester, and R. Heckel, “A methodology for specifying and analyzing consistency of object-oriented behavioral models,” in Proceedings of the 8th European Software Engineering Conference (ESEC, pp. 186–195, ACM Press, 2001. [15] B. Hnatkowska, Z. Huzar, L. Kuzniarz, and L. Tuzinkiewicz, “Systematic approach to consistency within UML based software development process,” in Proceedings of Workshop on Consistency Problems 51
in UML-based Software Development, UML’02, Dresden (L. K. et.al., ed.), pp. 16–29, 2002. [16] M. Elaasar and L. C. C. Briand, “An overview of uml consistency management,” tech. rep., Department of Systems and Computer Engineering, Carleton University, 2004. [17] T. Mens, Ragnhild, and J. Simmonds, “A framework for managing consistency of evolving uml models,” in Software Evolution with UML and XML (H. Yang, ed.), pp. 1–31, Idea Group Publishing, 2005. [18] G. Engels, R. Heckel, and J. M. K¨ uster, “Rule-based specification of behavioral consistency based on the uml meta-model,” in UML 2001: Proceedings of the 4th International Conference on The Unified Modeling Language, Modeling Languages, Concepts, and Tools, (London, UK), pp. 272–286, Springer-Verlag, 2001. [19] G. Engels, R. Heckel, J. M. K¨ uster, and L. Groenewegen, “Consistencypreserving model evolution through transformations,” in UML ’02: Proceedings of the 5th International Conference on The Unified Modeling Language, (London, UK), pp. 212–226, Springer-Verlag, 2002. [20] M. Trapp and M. Schmettow, “Consistency in use through model based user interface development,” in Formal Methods for Components and Objects, Springer, 2006. [21] G. Engels and J. Kuester, “Consistency management within modelbased object-oriented development of components,” in Formal Methods for Components and Objects, pp. 157–176, Springer, 2004. 52
[22] B. Schatz, P. Braun, F. Huber, and A. Wisspeintner, “Consistency in model-based development,” Engineering of Computer-Based Systems, 2003. Proceedings. 10th IEEE International Conference and Workshop on the, pp. 287–296, 2003. [23] C. Wohlin, P. Runeson, M. H¨ost, M. C. Ohlsson, B. Regnell, and A. Wessl´en, Experimentation in software engineering: an introduction. Norwell, MA, USA: Kluwer Academic Publishers, 2000. [24] B. A. Kitchenham, S. L. Pfleeger, L. M. Pickard, P. W. Jones, D. C. Hoaglin, K. E. Emam, and J. Rosenberg, “Preliminary guidelines for empirical research in software engineering,” IEEE Trans. Softw. Eng., vol. 28, no. 8, pp. 721–734, 2002. [25] J. A. Cruz-Lemus, M. Genero, M. E. Manso, S. Marasca, and M. Piattini, “Assessing the understanding of uml states diagrams with composite states - a family of empirical studies,” Empirical Software Engineering, vol. 14, no. 6, pp. 685–719, 2009. [26] M. Staron, L. Kuzniarz, and C. Wohlin, “Empirical assessment of using stereotypes to improve comprehension of uml models: A set of experiments,” Journal of Systems and Software, vol. 79, no. 5, pp. 727–742, 2006. [27] B. Berenbach, “The evaluation of large, complex uml analysis and design models,” in ICSE ’04: Proceedings of the 26th International Conference on Software Engineering, (Washington, DC, USA), pp. 232–241, IEEE Computer Society, 2004. 53
[28] C. F. J. Lange and M. R. V. Chaudron, “Defects in industrial uml models a multiple case study,” in Proceedings of the 2nd Workshop on Quality in Modelling, collocated with MoDELS 2007, pp. 50–64, 2007. [29] L. F. J, M. Fernando, and T. Ambrosio, “A systematic review of uml model consistency management,” Information and Software Technology, vol. 51, no. 12, p. 1631, 2009. [30] D. Leffingwell and D. Widrig, Managing Software Requirements: A Unified Approach. Addison Wesley, 2000.
54
9. Appendix A. Concise description of elements of the MDC-F consistency classification framework Perspectives 1. Concepts. The perspective deals with the problem of how to understand and perceive consistency in general and in particular contexts, including classifications of understandings of the notion of consistency. 2. Pragmatics. The perspective is focused on how to realize consistency in practice - namely how to check consistency if we know what we mean by it. 3. Development Process. The perspective investigates what is the relationship between consistency of artifacts constructed within different elements constituting the development process (phases, activities and tasks), how to maintain consistency within the process, what are the costs and the benefits of consistency management. 4. Language. The perspective addresses consistency within a modeling language and between modeling languages. 5. Quality. The perspective considers relationship between consistency and quality, whether consistency is a measure of quality, how quality is affected by inconsistencies, which quality attributes are affected by inconsistencies. Isses 1. Concepts. 1#1 : Understanding the concept
55
1#2 : Classification related to the concept 1#3 : Formalization of consistency 1#4 : Checking consistency 1#5 : Ensuring consistency 1#6 : Implications of changes on consistency 1#7 : Decidability and executability 1#8 : Consistency and reuse 1#9 : Entities of consistency 1#10: Concept of consistency in MDD 2. Pragmatics. 2#1 : Validation of models 2#2 : Verification of models 2#4 : Procedures and algorithms for consistency checking. 2#5 : Ensuring consistency with model transformations and refactoring 2#6 : Tools support for checking and ensuring consistency 2#7 : When to perform the consistency checks in tools 2#8 : Consistency of models built with different tools 3. Development Process. 3#1 : Consistency driven development process 3#2 : Understanding of consistency in the context of MDD 3#3 : Consistency between models built in different environments 3#4 : Merging models and consistency
56
3#5 : Checking inconsistencies during development process 3#6 : Consistency management 3#7 : Consistency within a method or methodology 3#8 : Consistency of development methodology itself 4. Language. 4#1 : Consistency of the language itself 4#2 : Conformance of the model to the language 4#3 : Consistency requirements in the language 4#4 : Implications of changes in the language on consistency 4#5 : Consistent customization of the language 4#6 : Semantic consistency 4#7 : Consistency between modeling languages 5. Quality. 5#1 : Consistency as a measure for quality 5#2 : Consistency as a part of quality 5#3 : Traceability as a basis for consistency 5#4 : Application focused consistency rules and conforming to the style 5#5 : Degrees of consistency 5#6 : Measuring consistency.
57
10. Appendix B. Concise presentation of the instruments used in the survey 10.1. The questionnaire. The questionnaire to be filled by the respondent is presented on figure 10. 10.2. Description of the task of the respondent. 1. Your task is to allocate an amount of dollars, out of 100 dollars, to each perspective (distribute 100 $ among five perspectives), and then, within each perspective you have another amount of 100 dollars to distribute among the issues in the perspective. The amount allocated is intended to reflex how important this perspective/issue is to you related to other perspectives/issues. 2. Provide information on you background and the role from which you answer the questionnaire. You should answer the questionnaire choosing ONE of the following roles indicate the appropriate box bellow
Tool-Building-Academia
Industry-Research
Tool-Building-Industry
Academia-Theory
Industry-Practice
Academia-Practice
58
Issues in Concepts
C : 1
Concepts Perspective
# $ for the perspective ( out of 100 )
...
2: Classification
...
3: formalization of consistency
...
4: Checking consistency
...
5: Ensuring consistency
...
6. Implications of changes on consistency
...
7. Decidability and executability
...
8: Consistency and reuse
...
9: Entities of consistency
...
10. Concept of consistency in MDD Issues in Concepts
P : 2
Pragmaticas Perspective
# $ for the perspective ( out of 100 )
...
2: Verification of models
...
3: Validation of code vs. model
...
4: Procedures and algorithms for checking consistency
...
5: Consistency ensuring with model transformations
...
6: Tools support for checking and ensuring
...
7: When to check consistency in tools
...
Issues in Concepts
Development Process Perspective
# $ for the perspective ( out of 100 )
... # $ for issue
1: Validation of models
8: Consistency of models built with different to
D : 3
# $ for issue
1: Understanding the concept
... # $ for issue
1: Consistency driven development processt
...
2: Understanding consistency in the context of MDA
...
3:Consistency between models built in different environments
...
4: Merging models and consistency (PIM+PM-¿PSM)
...
5: Checking consistencies during development process
...
6: Consistency management
...
7: Consistency with a methodology
...
8: Consistency of methodology itself Issues in Concepts
... # $ for issue
1: Consistency of the language itself
...
L : 4
2: Conformance of the model to the language
...
Language Perspective
3. Consistency requirements in the language
...
4: Implications of changes in the language on consistency
...
5: Consistent customization of the langue
...
6: Semantic consistency
...
# $ for the perspective ( out of 100 )
7. Consistency between modeling languages Issues in Concepts Q : 5 Quality Perspective
# $ for the perspective ( out of 100 )
... # $ for issue
1: Consistency as a measure for quality
...
2: Consistency as a part of Quality
...
3. Traceability as a basis for consistency
...
4: Implications of changes in the language on consistency
...
5: Degrees of consistency
...
6: Measuring consistency
...
Figure 10: The questionnaire
59
View Point All Respondents
Minimum Maximum Std.Dev. Mean Median
Concepts 5,00 30,00 7,70 19,08 20,00
Pragmatics 15,00 60,00 12,20 31,79 30,00
Dev.Process 5,00 40,00 9,59 22,63 22,50
Langage 0,00 30,00 7,81 13,46 10,00
Quality 5,00 30,00 7,42 13,04 10,00
Table 2: Descriptive statistics for (P, All) view. View Point Academia
Industry
Minimum Maximum Std. Dev. Mean Median Minimum Maximum Std. Dev. Mean Median
Concepts 5,00 30,00 6,97 19,85 20,00 10,00 30,00 8,74 18,18 20,00
Pragmatics 15,00 50,00 9,24 29,85 30,00 15,00 60,00 15,14 34,09 30,00
Dev.Process 10,00 40,00 9,02 23,69 25,00 5,00 35,00 10,51 21,36 20,00
Langage 0,00 25,00 7,10 14,46 15,00 5,00 30,00 8,77 12,27 10,00
Table 3: Descriptive statistics for (P,A-I) view
11. Appendix C. Descriptive statistics tables
60
Quality 5,00 30,00 8,44 12,15 10,00 5,00 25,00 6,25 14,09 10,00
View Point Academia
Tool-Building
Industry
. Minimum Maximum Std. Dev. Mean Median Minimum Maximum Std. Dev. Mean Median Minimum Maximum Std. Dev. Mean Median
Concepts 10,00 30,00 6,52 21,44 20,00 5,00 20,00 6,27 16,43 20,00 10,00 30,00 9,91 18,75 15,00
Pragmatics 15,00 50,00 10,57 29,22 30,00 25,00 60,00 11,90 35,00 30,00 15,00 60,00 14,87 31,88 30,00
Dev.Process 10,00 30,00 8,73 21,44 20,00 10,00 40,00 10,75 22,14 20,00 5,00 35,00 10,50 24,38 27,50
Langage 0,00 25,00 7,36 14,78 15,00 10,00 30,00 8,52 16,43 10,00 5,00 25,00 6,78 9,38 7,50
Table 4: Descriptive statistics for (P, A-T-I) view
61
Quality 5,00 30,00 9,20 13,11 10,00 5,00 20,00 5,00 10,00 10,00 5,00 25,00 6,78 15,63 17,50
View Point Academia Theory
Academia Practice
ToolBuilder Academia
ToolBuilder Industry
Industry Practice
Industry Research
Minimum Maximum Std. Deviation Mean Median Minimum Maximum Std. Deviation Mean Median Minimum Maximum Std. Deviation Mean Median Minimum Maximum Std. Deviation Mean Median Minimum Maximum Std. Deviation Mean Median Minimum Maximum Std. Deviation Mean Median
Concepts 20,00 30,00 5,77 26,67 30,00 10,00 25,00 5,49 18,83 20,00 5,00 20,00 7,50 16,25 20,00 10,00 20,00 5,77 16,67 20,00 10,00 20,00 5,00 12,50 10,00 10,00 30,00 10,00 25,00 30,00
Pragmatics 30,00 50,00 11,55 36,67 30,00 15,00 40,00 8,69 25,50 24,00 25,00 40,00 6,29 31,25 30,00 30,00 60,00 17,32 40,00 30,00 35,00 60,00 11,09 43,75 40,00 15,00 25,00 4,08 20,00 20,00
Dev.Process 10,00 30,00 11,55 16,67 10,00 15,00 30,00 6,94 23,83 25,00 20,00 40,00 8,54 28,75 27,50 10,00 20,00 5,77 13,33 10,00 5,00 30,00 10,80 20,00 22,50 15,00 35,00 9,47 28,75 32,50
Langage 0,00 25,00 12,58 13,33 15,00 10,00 20,00 4,64 15,50 16,50 10,00 25,00 7,50 13,75 10,00 10,00 30,00 10,00 20,00 20,00 5,00 10,00 2,50 6,25 5,00 5,00 25,00 8,66 12,50 10,00
Table 5: Descriptive statistics for (P,B)
62
Quality 5,00 10,00 2,89 6,67 5,00 5,00 30,00 9,73 16,33 14,00 5,00 20,00 7,07 10,00 7,50 10,00 10,00 0,00 10,00 10,00 10,00 20,00 5,00 17,50 20,00 5,00 25,00 8,54 13,75 12,50