Tsuyoshi Shuto1,*, Shunsuke Kamei1,2, Hirofumi Nohara1,2, Haruka Fujikawa1,2, Yukihiro Tasaki1,. Takuya Sugahara1, Tomomi Ono1, Chizuru Matsumoto1, ...
Supplementary information
Pharmacological and genetic reappraisals of protease and oxidative stress pathways in a mouse model of obstructive lung diseases
Tsuyoshi Shuto1,*, Shunsuke Kamei1,2, Hirofumi Nohara1,2, Haruka Fujikawa1,2, Yukihiro Tasaki1, Takuya Sugahara1, Tomomi Ono1, Chizuru Matsumoto1, Yuki Sakaguchi1, Kasumi Maruta1, Ryunosuke Nakashima1, Taisei Kawakami1, Mary Ann Suico1, Yoshitaka Kondo3, Akihito Ishigami3, Toru Takeo4, Ken-ichiro Tanaka5, Hiroshi Watanabe6, Naomi Nakagata4, Kohei Uchimura7, Kenichiro Kitamura7, Jian-Dong Li8 and Hirofumi Kai1,*
1
Department of Molecular Medicine, Graduate School of Pharmaceutical Sciences. 2Program for
Leading Graduate Schools “HIGO (Health life science: Interdisciplinary and Glocal Oriented) Program”, Kumamoto University, 5-1 Oe-Honmachi, Chuo-ku, Kumamoto 862-0973, Japan. 3
Molecular Regulation of Aging, Tokyo Metropolitan Institute of Gerontology, 35-2 Sakae-cho,
Itabashi-ku, Tokyo 173-0015, Japan. 4Division of Reproductive Engineering, Center for Animal Resources and Development (CARD), Kumamoto University, 2-2-1 Honjo, Chuo-ku, Kumamoto, 860–0811, Japan. 5Laboratory of Bio-Analytical Chemistry, Research Institute of Pharmaceutical Sciences, Musashino University, Nishitokyo-shi, Tokyo 202-8585, Japan. 6
Department of Biopharmaceutics, Graduate School of Pharmaceutical Sciences, Kumamoto
University, 5-1 Oe-honmachi, Chuo-ku, Kumamoto 862-0973, Japan. 7University of Yamanashi School of Medicine, 1110 Shimokato, Chuo, Yamanashi 409-3898, Japan.
8
Center for
Inflammation, Immunity & Infection, Institute for Biomedical Sciences, Georgia State University, 714 Petit Science Center, 100 Piedmont Ave SE, Atlanta, GA30303, USA.
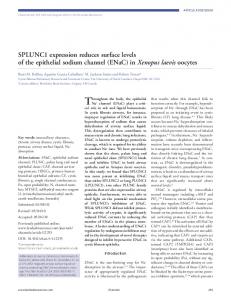
R=-0.448 P=0.00378
Elastance
Resistance
MLI (µm)
FEV0.1/FVC (%)
Fig. S1
R=-0.212 P=0.188
R=0.663 P=1.06E-8
R=0.104 P=0.524
R=-0.822 P=8.07E-11
R=0.386 P=0.0199
R=-0.253 P=0.115
R=-0.294 P=0.0660
R=0.773 P=3.39E-8
R=0.179 P=0.269
R=-0.290 P=0.0692
R=-0.547 P=0.000263
Fig. S1. Correlation analysis of parameters. Analysis between pulmonary parameters and biochemical parameters in BALF in WT and C57/BL6J-βENaC-Tg mice (n=36-41) and correlation scatter plots were shown.
Fig. S2
FVC 2
*
** mL
1
1
0.5
0.5 0
n.s.
1.5
n.s.
1.5 mL
FEV0.1
CON WT
CON
0
CM
C57/BL6J βENaC-Tg
CON
CON
WT
C57/BL6J βENaC-Tg
FVC 2
***
FEV0.1 ##
1.5
***
p=0.097
1 mL
mL
1.5 1
0.5
0.5 0
CM
CON WT
CON ONO C57/BL6J βENaC-Tg
0
CON WT
CON ONO C57/BL6J βENaC-Tg
Fig. S2. Effect of protease inhibitors on FVC and FEV0.1 in C57/BL6J-βENaC-Tg mice. Pulmonary phenotypes (FVC and FEV0.1) were evaluated in oral camostat methylate (CM)- or ONO3403-treated C57/BL6J-βENaC-Tg mice. Age-matched C57/BL6J mice (WT) were used as healthy controls. n=4-7 and n=7-8 for CM and ONO3403 treatments, respectively. *p < 0.05, **p < 0.01, ***p < 0.001, versus WT mice; ##p < 0.01, versus vehicle-treated C57/BL6J-β ENaC-Tg mice; Student's t test.
Fig. S3
A log2[ratio(Cy3/Cy5)] -3 -2 -1 0 1 2 3
WT vs. βENaC-Tg
WT vs. βENaC-Tg ONO
C Cluster
% of the measured genes meeting the set criterion
0
5
10
15
20
25
Down-regulated
Significantly increased pathways I
Up-regulated
Chemokine signaling pathway Osteoclast Spinal Cord Injury Complement and Coagulation Cascades Cytokines and Inflammatory Response Selenium metabolism/ Selenoproteins Blood Clotting Cascade TGF Beta Signaling Pathway
II
Exercise-induced Circadian Regulation Oxidative Stress Matrix Metalloproteinases
βENaC-Tg ClusterI ClusterII ClusterIII Significantly decreased pathways
Nuclear Receptors Macrophage markers III
Keap1-Nrf2 Statin Pathway
IV
Oxidation by Cytochrome P450
βENaC-Tg ClusterIV ClusterV
V
B
βENaC-Tg Cluster I Cluster II Cluster III Cluster IV Cluster V
+ + + -
βENaC-Tg ONO + or ++ ± or -- or -± or +
# of genes 50 155 3 27 28
Fig. S3. Microarray and cluster analyses of ONO3403-treated C57/BL6J-βENaC-Tg mice. (A) A heatmap representing the cluster analysis of gene alteration based on the microarray in lung tissue of ONO-3403-treated and -untreated C57BL/6J-βENaC-Tg mice compared to WT mice. Patterns of five cluster sets were indicated in (B). +, up-regulated; ++, highly up-regulated; ±, not altered; -, down-regulated; --, highly down-regulated: versus WT mice. (C) Comparison of pathway analysis of ONO-3403-treated and -untreated C57BL/6J-βENaC-Tg mice compared to WT mice.
Fig. S4 FVC ***
2
FEV0.1 ##
1.5 1
1
0.5
0.5 0
#
mL
mL
1.5
**
CON
WT
CON
NAC 0.1
C57/BL6J βENaC-Tg
0
CON
CON NAC 0.1
WT
C57/BL6J βENaC-Tg
Fig. S4. Effect of NAC on FVC and FEV0.1 in C57/BL6J-βENaC-Tg mice. Pulmonary phenotypes (FVC and FEV0.1) were evaluated intratracheal N-acethylcysteine (NAC)-treated C57/BL6J-βENaC-Tg mice. Age-matched C57/BL6J mice (WT) were used as healthy controls. n=4-5 mice/group. **p < 0.01, ***p < 0.001, versus WT mice; Student's t test. #p < 0.05, ##p < 0.01, versus vehicle-treated C57/BL6J-βENaC-Tg mice; Dunnett's test.
Y/+ Y/C57/BL6J βENaC-Tg
SMP30
Elastance
30 25 20 15 10 5 0
Y/+ Y/C57/BL6J βENaC-Tg
FVC
1
mL
1
mL
1.5
Y/+
Y/-
SMP30
0
Y/+
C57/BL6J βENaC-Tg
Y/-
Y/+ Y/C57/BL6 βENaC-Tg
SMP30
SMP30
Compliance
+/+
+/-
-/-
SMP30
+/+
+/-
-/-
SMP30
0.07 0.06 0.05 0.04 0.03 0.02 0.01 0
C57/BL6J βENaC-Tg
FVC
2
mL/cmH2O
cmH2O/mL
cmH2Os/mL
0
SMP30
Elastance
30 25 20 15 10 5 0
C57/BL6J βENaC-Tg
2
+/+
+/-
-/-
C57/BL6J βENaC-Tg
FEV0.1
1.5 mL
1.5 mL
0.02
C57/BL6J βENaC-Tg
Resistance
1
1
0.5
0.5 0
0.04
0.5
0.5
1.2 1 0.8 0.6 0.4 0.2 0
0.06
FEV0.1 1.5
0
Compliance
0.08 mL/cmH2O
Resistance
1.2 1 0.8 0.6 0.4 0.2 0
cmH2O/mL
cmH2Os/mL
Fig. S5
+/+
+/-
-/-
C57/BL6J βENaC-Tg
SMP30
0
+/+ +/-/- SMP30 C57/BL6J βENaC-Tg
Fig. S5. Effect of SMP30 deficiency on Pulmonary mechanics, FVC and FEV0.1 in C57/BL6J-βENaC-Tg mice. Pulmonary phenotypes (Resistance, Compliance, Elastance, FVC and FEV0.1) were evaluated in male (Y/+ and Y/-) and female (+/+. +/- and -/-) C57/BL6JβENaC-Tg and C57/BL6J-βENaC-Tg-SMP KO mice. n=6 mice/group.
SMP30
Fig. S6 Scnn1b mRNA
20 10
2
0 C57/BL6J βENaC-Tg Prss8+/-
0 Prss8+/-
0.5
WT
%
1
0.5 C57/BL6J βENaC-Tg
C57/BL6J βENaC-Tg Prss8+/-
*
WT
mL
1
WT
0
n.s.
1.5
1.5
mL
0.02
FEV0.1/FVC (FEV0.1%)
C57/BL6J βENaC-Tg Prss8+/-
n.s.
Prss8+/-
**
0.04
FEV0.1
C57/BL6J βENaC-Tg
2
0.06
**
100 95 90 85 80 75 0 WT
FVC
Prss8+/-
WT
C57/BL6J βENaC-Tg Prss8+/-
Prss8+/-
C57/BL6J βENaC-Tg
C57/BL6J βENaC-Tg
0
0
# **
C57/BL6J βENaC-Tg Prss8+/-
0.2
30
n.s.
#
C57/BL6J βENaC-Tg Prss8+/-
0.4
*
Prss8+/-
0.6
40
Compliance
0.08
mL/cmH2O
0.8
n.s.
Elastance
cmH2O/mL
*
WT
cmH2Os/mL
Resistance 1
Prss8+/-
WT
C57/BL6J βENaC-Tg Prss8+/-
C57/BL6J βENaC-Tg
Prss8+/-
0
C57/BL6J βENaC-Tg Prss8+/-
2
C57/BL6J βENaC-Tg
4
n.s.
C57/BL6J βENaC-Tg
6
*
12 10 8 6 4 2 0
Prss8+/-
###
C57/BL6J βENaC-Tg
Rela%ve Quan%ty of mRNA
***
8
WT
Rela%ve Quan%ty of mRNA
Prss8 mRNA
Fig. S6. Effect of heterozygous deletion of Prss8 on genes expression, Pulmonary mechanics, FVC and FEV0.1 in C57/BL6J-βENaC-Tg mice. Gene expression levels of Prss8 and Scnn1b (βENaC) and pulmonary phenotypes (Resistance, Compliance, Elastance, FVC, FEV0.1 and FEV0.1%) were evaluated in WT, Prss8+/-, C57/BL6J-βENaC-Tg and souble mutant Prss8+/C57/BL6J-βENaC-Tg mice. n=3 mice/group. *p < 0.05, **p < 0.01, ***p < 0.001, versus WT mice; #p < 0.05, ###p < 0.001 versus C57/BL6J-βENaC-Tg mice; Student's t test. n.s. not significant.