Aug 18, 1995 - email: derek.dcs.exeter.ac.uk. August 18 ...... Morgan. Kaufmann, 1991. Rumelhart et al. 1986]. D E Rumelhart, G E Hinton, and R J Williams.
Engineering Multiversion Neural-Net Systems D. Partridge and W.B. Yates Department of Computer Science University of Exeter Exeter EX4 4PT, UK email: derek.dcs.exeter.ac.uk August 18, 1995 Abstract
In this paper we address the problem of constructing reliable neural-net implementations, given the assumption that any particular implementation will not be totally correct. The approach taken in this paper is to organize the inevitable errors so as to minimize their impact in the context of a multiversion system. | i.e. the system functionality is reproduced in multiple versions which together will constitute the neural-net system. The unique characteristics of neural computing are exploited in order to engineer reliable systems in the form of diverse, multiversion systems which are used together with a `decision strategy' (such as majority vote). Theoretical notions of \methodological diversity" contributing to the improvement of system performance are implemented and tested. An important aspect of the engineering of an optimal system is to overproduce the components and then choose an optimal subset. Three general techniques for choosing nal system components are implemented and evaluated. Several di�erent approaches to the e�ective engineering of complex multiversion systems designs are realized and evaluated to determine overall reliability as well as reliability of the overall system in comparison to the lesser reliability of component substructures.
1
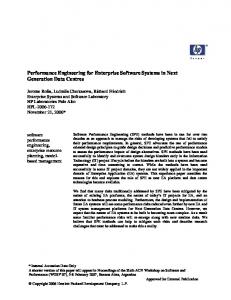
1 Introduction In this paper, we shall examine several novel strategies for constructing a multiversion neural-net system which is more reliable than the individual components from which it is constructed. A multiversion system is one in which the basic functionality of the system is re-implemented in di�erent versions. In order to reap any bene t, the versions must be diverse | i.e., should be di�erent approximations to the desired function. In the context of a voting decision strategy, the necessary diversity is obtained when the versions contain di�erent errors, lack of coincident failure | i.e. when one version fails, others do not exhibit the same fault. A comprehensive theoretical analysis of multiversion system performance, using only conventional programs as the versions, has been provided by Littlewood and Miller [1989]. They prove that diversity will pay o� in terms of improved system reliability, but the question remains of how to best generate diversity. They suggest that diversity of process (i.e. the way the versions are constructed) should lead to diversity of the products. In the neural computing context, the products are trained networks and the process by which they are obtained is an algorithmic one of training. Diversity of process is then determined by the initial conditions for training | e.g., net type chosen, net architecture, training set structure, training algorithm parameter settings. In earlier studies we have have establised an ordering (with respect to subsequent diversity) for a number of the essential determinants of the initial conditions for training. In this study we use this ordering to exploit \methodological diversity" in the way that Littlewood and Miller suggest. The purpose of this study is to explore possibilites for systematically engineering diversity in multiversion systems. There is no doubt of the overall payo� from diversity, but can we reliably generate it? And can we generate enough of it to make the extra e�ort worthwhile? A proper costs-bene ts analysis must be problem speci c as a 1% increase, for example, may be trivial or highly signi cant dependent upon particular problem circumstances. Although we systematically exploit the known diversity-generating potential of some parameters, our method also tacitly acknowledges that precise engineering of maximum diversity is beyond the current state of our knowledge in neural computing. So, instead of attempting to generate only the necessary diverse networks directly, we train a population of networks that is larger than actually required. We then choose from this `space' of trained networks, the version space, a small number of speci c versions as the nal multiversion system. This overproduction and subsequent choice is the overproduce and choose strategy. The chosen versions, together with the appropriate decision strategy (e.g. majority-vote) constitutes the nal multiversion system. We explore three alternative strategies for choosing a diverse set of 15 versions from the version space, and we explore two ways to constrain the choices | freely from the complete space, or three sets of ve each from a (methodologically) diverse subspace. We compare two arrangements of each 15 | a simple set of 15 and three sets of ve | which also permits the evaluation of two di�erent voting strategies on each of the two architectural variants as illustrated in gure 1. Each overall system performance is evaluated relative to the performance of the best individual component versions (and groups of versions) in order to determine the relative success of the overall system designs. 2
majority of 3 majorities
majority of 3 randomly selected one from each set
majority of 3 randomly selected
majority
1 random
majority
FLAT 15 SYSTEM
1 random
majority
1 random
majority
TWO-LEVEL 3x5 SYSTEM
ALTERNATIVE MULTIVERSION SYSTEMS
Figure 1: the two system architectures and decision strategies explored
2 Tasks In order to probe the idea that methodological diversity can be exploited to obtain product diversity, we use three di�erent tasks: two well-de ned abstract tasks (LIC1 and LIC4) and one real-world, data-de ned task, a character recognition problem (OCR). LIC1 and LIC4 are two (of 15) Launch Interceptor Conditions that together are a major component of the Launch Interceptor Problem (speci ed in Knight and Leveson [1986]) a problem that we are investigating as a whole in other research. In this study we shall provide full details with respect to LIC1 only, but present the overall results from the other two tasks as an indication that our general conclusions are not artefacts of LIC1. LIC1 is speci ed as a predicate that evaluates to true if: \There exists at least one set of two consecutive data points that are a distance greater than the length LENGTH1 apart. (0 � LENGTH1) " where LENGTH1 is a parameter of the condition. We shall abstract a functional representation of this precise, though informal description. The intention here is to make explicit the exact structure and semantics of the network task. Let S = [0; 1] � [0; 1] represent the set of all data points, let a = (x1; y1) and bq= (x2; y2) represent two consecutive data points and note that the function d(a; b) = (x1 ? x2)2 + (y1 ? y2)2: is the Euclidean distance on S . Formally, we require a neural network implementation of the bounded function f : S � S � [0; 1] ! B de ned by ( (a; b) > LENGTH1; f (a; b; LENGTH1) = 10 ifd otherwise; In fact, as our task will ultimately be executed on some digital computer, we shall restrict our attention to the nite subset of rationals, with 6 decimal places, in S � S � [0; 1]. In this special case we note that f is also continuous. 3
LIC4 is a similar, but more complex boolean function: three data points demarcate a triangle, and the task is to decide whether the area of this triangle is greater than the value of a seventh parameter. The OCR task was taken from the Machine Learning database at UC Irvine. The problem is to classify 16 parameter values as one of the 26 characters A-Z. The database totals 20,000 examples. Full details are provided by Frey and Slate [1991] who explored a variety of rule-induction approaches and demonstrated 60-80% correct recognition (when trained on 16,000 and tested on 4,000) with two particular versions above this level giving 81:6% and 82:7% performances.
3 Measures of Performance Two rather di�erent types of performance measure need to be de ned: the decision strategies to be used, and the diversity generated both within and between version sets. Both measures are based on pn , the probability that exactly n versions fail on a random test, where N is the total number of versions and 0 � n � N . This probability can be computed from the results of the version set on a large and representative test set of data, in that fail on n versions . which case pn = no: of tests total number of tests
3.1 Decision Strategies
The statistic for overall or simple majority1, p(maj ), is simply the summation of the probabilities that exactly 0; 1 : : : k versions fail, where k = N ? majority number.
p(maj ) =
k X i=0
pi
The following statistic, p(maj 3), de nes the probability that a majority of three versions selected at random are correct.
p(maj 3)
N (N ? n) (N ? n ? 1) (N ? n ? 2) X = � � � pn
N (N ? 1) (N ? 2) ? n) � (N ? n ? 1) � 3 � p + Nn � ((N n N ? 1) (N ? 2) n=1
n=0 N X
In order to compare the reliability of a single-set system with that of a multi-set system, we require a statistic to give the probability that a majority out of three versions is correct, p(maj 3)ABC , when the three versions are selected one at random from each of the sets, A, B and C which contain NA , NB and NC versions, respectively. 1
when N is odd as in all examples in this study
4
p(maj 3)ABC =
(NA ? nA) � (NB ? nB ) � (NC ? nC ) � p nA nB nC NA NB NC nA ;nB ;nC =0 NA ;N XB ;NC nA (NB ? nB ) (NC ? nC ) � N � N � pnA nB nC + B C nA =1;nB ;nC =0 NA NA ;N XB ;NC (NA ? nA ) nB (NC ? nC ) + NA � NB � NC � pnA nB nC nB =1;nA ;nC =0 NA ;N XB ;NC (NA ? nA ) (NB ? nB ) nC + NA � NB � NC � pnA nB nC nA ;nB =0;nC =1 NA ;N XB ;NC
The rst term in the nal formulation2 is the probability that all three versions will be correct, and the second, third and fourth terms are the probabilities that exactly one of the 3 versions will fail | one term each for the probability of failure of one chosen version and the non-failure of the other two, when the failing version is from set A, from set B and from set C , respectively. The majority decision strategy for multi-set systems is to take the majority of each component set and then take the majority of the component-set majorities. This statistic is p(majmaj ). If p(maj )nX is the probability that a majority of versions are correct when exactly n versions fail in set X , then (
n < majority number p(maj )nX = 10 ifotherwise Given this statistic the majority of majorities statistic for a system composed of three sets of versions, A, B and C , can be formulated.
p(majmaj ) =
NA ;N XB ;NC
+
+ + 2
p(maj )nA p(maj )nB p(maj )nC � pnA nB nC
nA ;nB ;nC =0 NA ;N XB ;NC
nA =1;nB ;nC =0 NA ;N XB ;NC
(1 ? p(maj )nA )p(maj )nB p(maj )nC � pnA nB nC
nB =1;nA ;nC =0 NA ;N XB ;NC nA ;nB =0;nC =1
p(maj )nA (1 ? p(maj )nB )p(maj )nC � pnA nB nC p(maj )nA p(maj )nB (1 ? p(maj )nC ) � pnA nB nC
note: for brevity we write a triple summation, such as
5
P
A PNB PNC A=0 nB =0 nC =1
N n
as
P
A ;NB ;NC A;nB =0;nC =1
N n
3.2 Diversity Measures
The diversity measures have been de ned, justi ed and fully explained elsewhere (e.g. Partridge [1994], and Yates and Partridge [1995]). Here we shall simply provide the de nitions with a minimum of explanation. 1. Within-set diversity, GDX , the diversity within set X , or simply GD when there is only one set under consideration. fail) GD = 1 ? p(2p(1both fails) where p(2 both fail), the probability that two randomly selected versions from the set will both fail on a randomly selected input, is PNn=2 Nn Nn??11 pn , and p(1 fails), the probability that one randomly selected version will fail on a randomly selected P N n input, is n=1 N pn . GD has a minimum value of 0 and a maximum value of 1. 2. Between-set diversity, GDBXY , the diversity between version sets X and Y , or simply GDB when there are only two sets under consideration. p(1 fails in A and 1 fails in B ) GDBAB = 1 ? max (p(1 fail in A); p(1 fails in B )) where the single failure probabilites are as above P and maxPselects the greater of the two, and p(1 fails in A and 1 fails in B ) = NnAA NnAA NnBB NnBB pnA nB when set A contains NA versions, set B contains NB versions, and pnA nB is the probability that exactly nA versions in set A and exactly nB versions in set B fail. GDB has a minimum value of 0 and a maximum value of 1. 3. A combination within-set and between-set diversity, GDBWAB , or simply GDBW when only two sets are under consideration. GDBWAB = GDBAB ? 21 (GDA + GDB ) GDBW has a minimum value of ?1 and a maximum of 1.
4 Generating Version Space Earlier studies (Partridge [1994]; Yates and Partridge [1995]) indicate that some important parameters of neural net training have the following ordering with respect to decreasing diversity-generating potential: net type > training set structure > training set elements > number of hidden units � weight seed. This ordering suggests the following division of version space will yield maximum diversity between subspaces.
4.1 Neural Net Types
As a prime methodological variation we use two types of neural net | multilayer perceptrons (MLP) and radial basis function (RBF) nets | as the primary source of useful diversity. 6
4.1.1
MLP's
For the MLP versions we use 2-layer nets, trained using the backpropagation algorithm with momentum. These are `standard' MLPs (see Rumelhart et al. [1986]) for which the initial weights are randomly initialized (in the interval [?0:5; 0:5]) and trained to completion (i.e. every pattern learnt to a tolerance of 0:5) or 20000 epochs, whichever is rst. A full speci cation of these networks and the training regime can be found in Partridge and Yates [1994]. 4.1.2
RBF's
The second type of neural net used is the RBF nets of Moody and Darken [1988]. A full speci cation of our implementation can be found in Yates and Partridge [1995]. An RBF net consists of a set � of m radial basis functions (or RBFs) � = f�i : Rn ! R j i = 1; : : : ; mg where typically m > n. Each RBFs each receives n input signals from the external environment and is connected to a single output unit which computes a function f of the form f : Rm ! R de ned by Pm � (x)w f (x) = Pi=1m �i (x) i
Rn
i=1 i 2 Rm are
where x 2 is an input pattern and w the weights from the RBFs to the output unit. The computational properties of the network are determined by the choice of radial basis functions. In this paper we shall employ the constant function 1 and a number of Gaussian response functions. The functions are radially-symmetric, that is, the function attains a single maximum value at its center, which drops o� rapidly to zero at large radii. By varying the center ci and radius ri we may vary the position and shape of the functions receptive eld.
4.2 Training sets
According to our ordering we have training set structure followed by training set content to exploit. 4.2.1
structure variation
Two training set structures were used: random (T) and rational (R). The random pattern generator produced input patterns entirely at random | these are the T training sets. The `rational' pattern generator produced input patterns that are close to (within 10% of) the true/false decision boundary in LIC1, but randomly within this constraint | these are the R training sets. 7
4.2.2
content variation
By using ve di�erent seeds in conjunction with the two generators we obtained ten training sets (of 1000 patterns each) | T1, T2, T3, T4 and T5, and by R1, R2, R3, R4 and R5, respectively for the random and rational training sets
4.3 Hidden units
We used ve di�erent numbers of hidden units, the H parameter H for MLP nets : the hidden unit numbers used are 8, 9, 10, 11 and 12 H for RBF nets : the hidden unit numbers used are 50, 60, 70, 80 and 90
4.4 Weight initialization
The random initialisation of weights is varied by using 5 di�erent weight seeds with the random number generator, the W parameter W for both types of net : the di�erent seeds will be denoted by W1, W2, W3, W4 and W5 These parameter labels, together with speci c values, provide a succinct and unambiguous naming scheme for each point in net space. Thus T3-H9-W2 is the point in net space occupied by an MLP with 9 hidden units, initialized with weight seed 2 and trained on random training set 3. Given a choice of net type (MLP or RBF) and training set structure (T or R) together with 5 values on each of three dimensions (training set seed for a given generator, number of hidden units, and weight seed), a population of 500 versions in all were trained | the complete version space. As we will be using a three-subset architecture, it is convenient to divide this space into three methodologically diverse subspaces: � RMLP versions | rationally trained MLPs � TRBF versions | randomly trained RBF nets � TMLP&RRBF versions | randomly trained MLPs and rationally trained RBF nets The complete space and the three subspaces from which the system versions will be chosen are illustrated in gure 2.
5 Choosing from Version Space Once we have a population of candidate versions, the problem is how to pick out a subset such that they constitute an optimal multiversion system. We explored three techniques for choosing an optimal subset.
8
10
versions
5 versions
R5
T5 RMLP
TMLP
R4
T4
W5 W4
R3
W5
T3 W4
W3 W2 R1 W1 H8
10
W3
T2
R2
v e r
W2 T1 H9
H10
H11
H12
W1 H8
H9
H10
H11
H12
s i
R5
T5 TRBF
R4
T4
W5 W4
T3
W4
R3 W3
W3 R2
T2
W2
W2 T1 W1
o n s
RRBF W5
H50
H60 H70
H80
H90
R1 W1
H50
H60 H70
H80
H90
Figure 2: the 500-net version space
5.1 Picking the Best
An obvious strategy, given that overall system performance is the ultimate goal, is to pick the `best' individual versions in conjunction with the basic idea of exploiting methodological diversity. The `best' individual versions are assessed by subjecting the trained versions to a large and representative set of previously unseen patterns, then the generalization performance of each version will give us an ordering from best to worst. A basic system may then be constructed from the 15 best nets out of the complete 500. This is the best15 system. For comparison purposes we can then divide the 15 best versions into three separate sets by using the choice-order strategy to spread the best performances evenly: put the three best versions in separate sets, and the next three best each in di�erent sets (in reverse order), and the next three best in separate sets (reversing the order once more), ... until all 15 have been assigned to one of the 3 sets | this is the best.order system. In order to examine whether process diversity does lead to product diversity, we can then choose the best ve versions from each subspace to provide the three version sets in the system | this is the best.struc system. And for comparison purposes these 15 nets can be used as a single set, the best.struc15 system.
5.2 Picking According to a Heuristic
In order to further raise the importance of minimum coincident failure (i.e., emphasize diversity) rather than the best individual performance, a heuristic that picks a minimum failure subset (on the basis of test results) was used. Many heuristics are reasonable as 9
processes to minimize coincident failures with an acceptable e�ciency. The particular heuristic used was: create a group containing the best network while this group is not big enough do for each network remaining in the space
score
n
0
p
each pattern in the test set if more than half the networks in the group fail on pattern network n is correct on pattern then if more than half the networks in the group fail on pattern network fails on pattern then
for
p
n
p
score
score
score ? 1
score + 1
p
and
p
and
end for end for
remove network with lowest score from the space and add it to the group end while
As a single set the chosen 15 is the pick15 system. Division of this 15 into three sets of ve each can use the choice-order strategy to give the pick.order system. Finally, still following the pattern of the previous technique, the heuristic can be applied separately to each of the three subspaces to give the three separate sets (of ve each) required. This is the pick.struc system, and for comparison purposes these 15 versions can be treated as a single-set system, the pick.struc15 system.
5.3 Genetic Algorithms
A nal approach to choosing an optimal subset is to use a genetic algorithm to search for high performance multiversion systems. A genetic algorithm consists of a nite pool of chromosomes (representing multiversion systems), a tness function (one of the measures of performance described in section 3), a number of stylised genetic operators, and a birth and death strategy. The chromosomes used in this paper were represented by xed length binary strings. Each string encodes the components of the multiversion sysytem i.e. T3-H8-W1, R5-H70W4, etc The chromosome structure is shown in gure below: random or rational T
H
RBF or MLP
W
1 2 3 4 5 6 7 8 9 10 11 12 13 14 15 16 17 .
0
1 NETWORK
R
2 - H50 - W2
.
.
1 NETWORK
key: 0 to 4 bits ‘ON’ in first 3 fields codes for one of the five values for each parameter; last two bits code for binary choices as shown
The encoding of a chromosome.
Initially, a pool of potential multiversion systems are randomly created and their tnesses calculated. These tness values are used to calculate the probability of choosing 10
a particular chromosome in the pool. The tter the chromosome the more chance it has of being chosen. Chromosomes that are chosen are used as arguments to a randomly selected genetic operator. The genetic operators manipulate existing chromosomes at bit level in order to produce new chromosomes. In this paper we shall employ homologous crossover and mutate, and inversion (together with an order free representation). The arguments of a genetic operator are called parents while the resulting chromosomes are called children. The birth and death strategy dictates how chromosomes in the pool are replaced by child chromosomes. In this paper the birth and death strategy employed was (the ttest) one child per generation, and replace the weakest chromosome.
6 Related Research There appears to be very little neural net research directly related to our approach. What we call the diversity of trained neural nets has featured in a number of previous studies. What we have done is provided a formal de nition of this characteristic and systematically evaluated the e�ects of the major training `parameters' (e.g. net type, training set structure) on the diversity of the trained nets obtained. Earlier papers report these results and survey the relevant related work (see Partridge [1994], and Yates and Partridge [1995]). The multiversion idea has been primarily studied by software engineers and in the context of only conventionally programmed versions. The application to neural computing is somewhat of a new departure, although not entirely new. Drucker et al. [1994], explore and present the results of \boosting and other ensemble techniques" in which they show the bene ts of a speci c three-version strategy when the training set size is su�ciently large. The basic \boosting" approach uses three networks that are trained sequentially using the rst-trained network to ` lter' a training set for the second, and then the second and third similarly ` lter' a training set for the third net. This approach is clearly rather di�erent from ours and we propose to evaluate it, and eventually perhaps to apply it by having, say, one component version set (in a two-level system) organised as such a \boosted" ensemble. Pearlmutter and Rosenfeld [1991], survey the sparse literature on \replicated networks" in which the network's outputs are averaged (as they are also in the \boosting" approach) to get the overall result. They cite such work on a speech task in which \the generalization performance of the composite network was signi cantly higher than that of any of its component networks." And they note that \replicated implementations programmed from identical speci cations is a common technique in software engineering of highly reliable systems." They analyse replicated networks, in which a number of identical networks are independently trained on the same data and their results averaged. They conclude \that replication almost always results in a decrease in the expected complexity of the network, and that replication therefore increases expected generalisation." They produced empirical results to support this conclusion. In our terminology they exploited the diversity generated by weight-seed variation. Lincoln and Skrzypek [1990], also perform some experiments to investigate the increase in fault tolerance that a set of versions produces compared with any one network. They write of the \ `synergy' of clustering multiple back-prop nets". And again they 11
best15 best.order majority 98.48 majmaj 98.46 maj3 98.27 maj3ABC 98.28 average 97.97 av.GDBW 0.014 GD 0.530 av.GDB 0.540 Table 1: using the best 15 versions use an `average' output of their clusters rather than a majority-vote strategy. Their network \clusters" again are based on weight seed variation only. They show an increase of performance and fault tolerance exhibited by clusters in comparison to single networks.
7 Results Having lled the version space with 500 networks, each trained to convergence as speci ed earlier on 1000 training patterns either randomly or rationally constructed, each of the three techniques for choosing component versions was examined. Given that the system con gurations to be used were based on 15 versions, either as a single version set, a ` at' 15 system, or as three separate sets each containing ve versions, a two-level 3 � 5 system, the rst task was to choose 15 versions from the space of 500. As a basis for choosing the system versions from version space, a `structured' set of 161,051 patterns was used: all combinations of the ve input variables with values from 0.0 to 1.0 in steps of 0.1, i.e., 11 values per input variable, and thus 115 = 161051 in the structured set. System versions were picked out from the version space on the basis of their performances recorded on this structured set. Each system con guration was evaluated on a further 10,000 random patterns, the `test' set. All subsequent data is based on test-set performances. Generalisation and decision strategy performances are given as percent correct, GD and GDB values range from 0 to 1, and GDBW ranges from -1 to +1. The best individual net exhibited a 98:40% generalisation on the test set.
7.1 Picking the Best
The results are summarized in table 1. The three pairwise GDBW and GDB values are averaged to provide the entries \av.GDBW" and \av.GDB", respectively. The GD within the 15 best versions is not high because they were chosen on the basis of individual generalisation performance, not diversity. Consequently the average generalisation is high at 97:97%, but neither of the decision strategies can provide much improvement | biggest improvement, approximately 0:5%, is achieved by taking the majority vote from all 15 versions. In addition, the two-level system o�ers no further improvement. This is to be expected because the more complex, two-level system was not constructed on the basis of any diversity judgement | merely highest performance individual versions dispersed evenly over three separate sets. The low average GDBW value, 0:014, indicates that the between-set GD was much the same as within each individual 12
best.struc15 best.struc majority 98.85 majmaj 98.82 maj3 98.43 maj3ABC 98.52 average 97.83 av.GDBW 0.192 GD 0.653 av.GDB 0.727 Table 2: using the best 15 from 3 diverse processes pick15 pick.order majority 99.31 majmaj 99.21 maj3 97.60 maj3ABC 97.41 average 95.44 av.GDBW -0.0622 GD 0.783 av.GDB 0.837 Table 3: picking maximum diversity set. This situation suggests that there is no gain to be made by selecting versions from separate sets rather than from within one composite set as the results demonstrate. By picking the best from within subsets of the version space, which are demarcated by maximal diversity-generating processes (as described earlier), we expect to be able to exploit diversity between the separate version sets of a two-level system. The results are given in table 2. All `majority' performances have been improved. This is because there is greater diversity in these systems even though average performance of the individual versions has decreased, from 97:97% down to 97:83%. As the selection process has not changed, only the (sub)spaces from which the best individual versions have been picked, it must be these divisions of version space that account for the higher diversity values obtained. As these divisions were determined by process di�erences, we can conclude that diverse processes do lead to diverse products which in turn leads to better system performance. Notice that if the chosen decision strategy is to evaluate only three versions (rather than all 15) and take the majority outcome, then the two-level system used with betweenset selection is superior, a 98:52% performance compared with 98:43% for the at 15 system composed of exactly the same individual versions. This is because there is substantially more diversity between sets (0.787, 0.687 and 0.708 between each pair of version sets) than within each set (0.507, 0.572 and 0.526). This disparity, which favours a twolevel system when evaluating only three versions, is captured in the average GDBW value of 0.192, an order of magnitude larger than for the best.order system. However, picking `best' individual versions is expected to be too simplistic, it does not fully exploit the important characteristic of diversity. The other two strategies for selecting version sets from the version space were designed to do just this.
7.2 The `pick' Heuristic
We observe (in table 3) a high GD value for the at 15, as expected. The overall majority is yet a futher improvement over the earlier results. But this is not the case for 13
pick.struc15 pick.struc majority 99.25 majmaj 99.10 maj3 98.41 maj3ABC 98.43 average 97.42 av.GDBW 0.0478 GD 0.729 av.GDB 0.713 Table 4: picking maximum diversity within three diverse processes the majority of three random versions, either within the at 15 system or between the three separate sets of the two-level system, in both cases the performance of the `picked' systems is the worst so far observed. This divergence of performance characteristics can be explained as an outcome of high GD values coupled with low average individual performances (almost 2:5% worse than for the `best' systems). When all 15 versions contribute to the system performance (i.e., majority and majmaj results) the high GD value more than compensates for the low individual performers (the lowest is only 84:79% correct). But when system performance is based on only three versions, selected at random, the chances of selecting a low performance version outweighs the diversity boost to be obtained from only three versions. Notice also that the two-level system is clearly inferior, especially with respect to `three-version majority' decision strategy. This is because within-set diversity is greater than between-set diversity, as the negative GDBW value clearly indicates. In fact, the individual within-set diversities in the two-level system, 0:844, 0:839 and 0:829, were the largest that were generated in this rst set of experiments. And these are subsets that together as pick15 exhibit considerably less diversity (GD = 0:783). We shall return to this point subsequently. The performances of pick.struc and pick.struc15 are summarized in table 4. With these systems we observe overall majorities have decreased but both `majority of three random' strategies show a substantial increase (approaching 1% better than for freely-picked systems). This general trend is accounted for by the increase in average performance (up nearly 2% from pick15 to pick.struc15) coupled with the decrease in overall diversity. The overall majority performance is lower because the improvement in average performance does not quite compensate for the decrease in diversity. While the `majority of three random' strategies gain disproportionately from the increase in average performance. When only three versions are used (rather than 15) the decision strategy is naturally more sensitive to the existence of low performance individual versions. Notice also that the within-set and between-set diversities have reversed their relative positions, and average GDBW is once again a positive value. The e�ect of this change is to make the `majority of three random' strategy superior in the two-level system, in the pick15 and pick.order case the at 15 system is superior.
7.3 Using a Genetic Algorithm
The nal technique used for choosing component versions from within the version space is a genetic algorithm (GA). For comparison purposes the rst experiment allowed the GA to choose 15 versions from anywhere within version space. As the ultimate goal is to produce 14
ga.maj ga.gd majority 99.30 99.08 maj3 98.37 97.63 average 87.52 84.79 GD 0.767 0.793 Table 5: using a genetic algorithm ga.struc15 ga.struc majority 99.14 majmaj 99.09 maj3 98.44 maj3ABC 98.47 average 97.62 av.GDBW 0.0652 GD 0.709 av.GDB 0.746 Table 6: using a genetic algorithm within three diverse subspaces high-performance systems and we have elected to use majority-vote decision strategies, it makes sense to have the GA optimize the majority-vote statistic. But as a potentially useful direct comparison, the GA was also used to maximize GD. The relevant results are summarized in table 5. Broadly the results are as expected: the GA when optimizing majority-vote returns 15 versions with a high majority-vote performance, comparable with the highest value we have yet seen; and when optimizing GD we get 15 versions with a high GD | the highest we have seen so far in a 15-version set | but a disappointingly low majority vote, seemingly pulled down by the low average performance of the individual versions chosen. In order to attempt to exploit the diversity that is to be found between certain subsets of the version space, the GA was used (optimizing majority vote) to choose ve versions from the same three subspaces as used in the earlier experiments; this gave the ga.struc system and, when collapsed into a at 15, we have the ga.struc15 system. The results of these two systems are summarized in table 6. Overall, the result of using the GA restricted to diverse subspaces does not appear to be advantageous, although the bene t of forcing between-set diversity at the cost of loss of overall diversity can be seen, as usual, in the superior performance of the `majority of three random' decision strategy when the three versions are each chosen from a di�erent set. A perceived weakness in the GA experiments that attempted to exploit the known diverse subspaces of the version space, is that each application of the GA to a subspace takes no account of its choices within the other two subspaces. A last experiment with the GA attempted to remedy this de ciency. The GA was again set up to select ve versions from each subspace, but to do so by optimizing the `majority of majorities' decision strategy. The results are given in table 7. The results are not particularly promising. The `majority of majorities' performance is good, but not clearly better than obtained with the GA operating in each subspace independently (i.e. the ga.struc system). And substantially better performances are exhibited by systems constructed using the pick heuristic. 15
ga.majmaj majmaj 99.10 majABC 98.19 av.GDBW 0.0912 av.GDB 0.818 Table 7: using a genetic algorithm between diverse subspaces set A system aver maj3 maj5 GD pick.order 95.50 98.27 98.71 0.844
set B aver maj3 maj5 GD 95.81 98.40 98.82 0.839
set C aver maj3 maj5 GD 95.01 97.97 98.77 0.829
Table 8: the component version sets for the pick.order system
7.4 Majority Performance and Diversity
The basic idea underlying the attempts to engineer optimal multiversion systems is that some majority decision strategy will produce optimal performance provided that the component versions exhibit diversity. However, the results provided above indicate in several places that the relationship between majority performance and diversity is non-simple. Choosing component versions for maximumdiversity favours individually low performance networks which can work against majority decision strategies, particularly decision strategies that use only a subset of the system versions such as the majority of three random versions. But choosing component versions to maximize a majority decision strategy tends to produce a suboptimal result because the bene ts of diversity become neglected. The choice of basic system architecture, i.e. at 15, or two-level 3 � 5, was arbitrary. The results therefore suggest further questions of whether we can do better using more, or using less, resources, or can we do as well using signi cantly less resources? A full exploration of these issues of performance versus number (and organization) of versions must be analytically driven: the possible alternatives are too many, and too varied to be satisfactorily explored by random probing. A crucial element of the analytical insight required is the relationship between majority performance and diversity. So some nal experiments, triggered by `oddities' in the studies described above, were performed in order to shed some light on this key relationship. First, there is a question of resources (in the form of version-set size) and performance that becomes apparent when we analysed the single example of a negative GDBW value found in the pick.order system. One of the three component sets had the highest GD value yet observed, 0.844, and the other two intra-set GDs were similarly high. The performance details of these three component sets is given in table 8, where \maj5" is the overall majority for each set as they contain only ve versions. These results provide further support for the notion that a two-level system architecture is counterproductive when GDBW values are negative. Notice that a superior performance is obtained from the `majority of 3 random' decision strategy in each of the component sets separately than across these sets within the two-level system: majority of three randomly selected within sets A, B and C is 98:27%, 98:40% and 97:97%, repectively, as against 97:41% for system 16
version set size 2 3 4 5 6 7 8 9 10 GD .785 .904 .884 .870 .851 .798 .808 .803 .804 maj. 98.41 99.02 98.95 99.09 maj3 98.41 98.47 98.49 98.48 97.10 97.52 97.67 97.84 maj9 99.09 99.09 av 97.99 93.59 94.75 95.34 95.75 94.46 94.95 95.25 95.52
11 12 13 14 .780 .785 .788 .786 99.12 99.30 97.16 97.35 97.50 97.59 98.98 99.01 99.05 98.99 94.80 95.03 95.21 95.37
15 .783 99.31 97.60 98.99 95.44
Table 9: a study of set size impact , or 97:60% in system pick15, both in table 3. So, for this particular decision strategy, we can get almost a 1% better performance from a third of the resources, because the system is badly organized, and the negative value of GDBW signals that this is the case. And now to the issue of GD and majority variation with respect to version set size. The experiment involved using the pick heuristic to choose, from the complete version space, sets of versions from size two to 15 in steps of one. Summary performance data for the sets in this sequence are given in table 9 where `maj9' is the majority of nine versions selected at random. From this sequence of results it can be seen that GD is indeed highest for the smallest sets and then seems to generally decrease as set size increases, although levelling out at about 0:785 after set size 10. The average generalisation performance of individual networks shows less of a marked trend: from a peak at set size two it becomes a minimum at set size three (because a low performance RBF network happened to be the third one chosen), and from then on it exhibits a 1% variation between 94:75% and 95:75%. The trends in the decision strategies are even harder to assess. Note the overall majority result for the even numbered sets has not been tabulated because it is not directly comparable with a majority outcome from odd numbered sets. These latter sets will always give a majority outcome whereas the former will not. However, there is a clear early maximum at set size ve for both `majority of three random' and overall majority (even when the adjacent majorites are considered | majority for set size 4 is 97:40%, and for set size 6 is 98:27%). But then as set size increases so does overall majority performance, then optimum system con guration would seem to be a compromise between the number of versions to be evaluated and the performance required. This crude analysis suggests that set size ve may be a good compromise between resources used and performance obtained. This is the pick5 system, and its performance is given, in detail, in tables 10 and 11. With the pick5 system we have done very well with few resources | only ve versions. Notice that although the `picking' was performed freely throughout the complete version space, within these ve versions there is at least one version from three of the four subcubes (there no representative from TRBF subcube). And notice that one of these, the RBF network R1-H50-W3, generalises to only 84:79%. So the majority performance in table 11 is a majority of only ve networks, not 15 as with all previous systems. The GD value of 0:870 is the largest so far in a tested system, and supports the view that larger GD values are easier to obtain in small version sets. Yet higher majority performances seem to be obtained from large version sets | there have been a number of majorities of 15 versions
pick.order
17
version test failures test successes prob(fail) generalisation R3-H9-W4 200 9800 0.0200 98.00% R1-H11-W5 201 9799 0.0201 97.99% R1-H50-W3 1521 8479 0.1521 84.79% R5-H10-W3 176 9824 0.0176 98.24% T3-H9-W3 234 9766 0.0234 97.66% number of versions, n coincident test failures prob. exactly n versions fail 0 8140 0.8140 1 1503 0.1503 2 259 0.0259 3 84 0.0084 4 11 0.0011 5 3 0.0003 Table 10: performance details of the pick5 system
majority 99.02 maj3 98.49 average 95.34 GD 0.870 Table 11: performance of the pick5 system
18
greater than that for pick5, but they were all from 15-version systems. If these two key characteristics of multiversion systems do indeed vary in opposite directions, the optimal system may lie at the `crossover' point. >From the second tabulation in table 10 | tabulation of the coincident failures observed, i.e. how many test patterns failed on precisely n version nets | the performance of further decision strategies can be extracted. The last line states that all ve versions in pick5 failed on just three of the test patterns, and the line above it states that precisely four versions failed on 11 test patterns. By summing the entries in the third column for these two lines, 0:0003 + 0:0011 = 0:0014, we determine that the probability that exactly 5 or exactly 4 versions will fail on a random test pattern is 0:14%. Put the other way around: the probability that four or ve versions in agreement is the correct answer is 99:86%. Set against this encouraging gure, however, is the fact that for any particular test the outcome may not give as many as four versions in agreement | there may be a 2:3 split, and this can occur in two ways: two are wrong and three are correct, or vice versa. But the tabulation also gives the probability of this 2:3 split occurring. It is the probability that exactly two versions fail (0:0259) together with the probability that exactly three versions fail (0:0084). This split will occur then on 3:43% of occasions. Hence, the four-or- ve-in-agreement strategy will yield an answer on 96:57% of occasions, and when it does the answer it provides should be at least 99:86% reliable. In sum, using pick5 together with a four-or- ve-in-agreement decision strategy, we have an approximately 99:9% system 97% of the time. And on the few occasions where four versions are not in agreement, there is a choice of accepting the lack of an answer or using the majority-vote strategy which always delivers a result and averages out at 99:02% reliability. On most tests all ve versions will agree (over 80% of occasions), in which case the answer will have 99:97% reliability. If the heuristic is allowed to choose one more version, a sixth network, it chooses a rationally trained MLP, R5-H9-W4, a version which generalises to 97:83%. The six-version set has a lower GD of 0:851, but most signi cantly none of the 10,000 tests fail on all six versions. This means that within the accuracy of the testing regime (i.e. approximately 0:01%) whenever all six versions agree on an answer, which is 80% of occasions, the result is 100% correct. For direct comparison purposes the GA technique was used to choose just ve versions freely from the complete version space. A summary of its choices is given in table 12. As can be seen the majority performance is not as good, despite this being the measure that guided the GA algorithm. The ve nets chosen were all MLPs (four rationally trained and one randomly trained). The details of coincident failure are, however, quite similar to those of the pick5 system with respect to reliability when either four or ve nets are in agreement. It is 99:81% for the ve chosen by the GA, as against 98:86% for the pick5 system.
7.5 Generalization of results
The comparable results for LIC4 mirror those for LIC1 at a lower level of generalization (90% - 93%). A similar space of 500 trained networks was generated and the same choice techniques were employed. Heuristic picking and the GA techniques produced 15-version systems with high diversity levels and majority-vote performances up to 4% better than the best single version. However, similarly good 5- and 6-version systems proved harder to 19
majority 98.85 maj3 98.57 average 97.81 GD 0.723 Table 12: performance of the ve nets chosen by the GA technique nd. The scarcity of small highly-diverse sets may be a result of the increased complexity of the function. In order to make the OCR problem results comparable with the earlier work of Frey and Slate, we used 10000 patterns for version-space generation, 6000 for choosing optimal subsets, and 4000 for nal system test. By using both RBF networks and MLPs, and varying training set contents, weight initialization and hidden unit numbers we generated a 90-net version space for the problem. Whilst we have not explored the possibilities in this space exhaustively, the initial results are promising. A large number of individual nets generalize at the 80% level. When our majority-vote decision strategy is applied to sets of 15 nets we obtain only a fraction of 1% improvement over the best network (typically 0:1%) and 1% improvement on the average. But this is a worst case result, because our decision strategy and diversity measures distinguish only success and failure (which is all that there is with boolean functions, for all failures on a given input must be identical). In the OCR problem there are 25 distinct failures, this provides much more scope for diversity and consequent performance enhancement | e.g. if two versions of 15 get the correct answer and the other 13 generate di�erent wrong answers, then a majority in agreement is correct. To fully exploit this new increased opportunity for error distribution we need the basic statistics to distinguish between identical and di�erent failures and to use a `majority in agreement' decision strategy rather than simple `majority of 15'. First results with such a strategy improves an 81:0% majority-vote system (15 versions) to give a 84:8% results, and improves a 3-version system from 81:3% to 83:8%. These results are several percent higher than any reported in the earlier studies.
8 Conclusions Multiversion systems constructed from neural nets trained from varied initial conditions, can yield substantially better performance than any individual network. So there is basis for multiversion system construction when highly reliable neural-net implementations are required. And dependent upon the constraints of particular applications (e.g. every use must yield a result, or a proportion of inconclusive outcomes is acceptable), it is possible to provide any desired level of reliability | even e�ectively 100% to the extent that any testing regime can provide assurances of this limiting case. Notice that the empirical evaluation, while never being able to deliver an absolute 100% guarantee, does provide well-founded statistical estimates of reliability which is the best that can be expected of any real system (as opposed to an abstraction that may be proved correct). Given that construction of multiversion systems is desirable, the question arises of how best to construct them, and in particular how do we engineer optimal systems? In 20
order to begin to answer these questions we examined a variety of ways to construct two types of system: a single level system, using 15 versions in a single set, and a two-level system using three separate sets each containing ve versions. A space of versions was de ned in a way that capitalised on the known diversity generating abilities of a number of training `parameters'. The version space (of 500 individual versions) was then expected to exhibit maximally diverse subspaces. Three techniques for choosing 15 system versions were empirically examined, allowing both free choice throughout the whole space and choice restricted to each of the diverse subspaces. Of the three choice techniques | `choose the best', pick with a maximum diversity heuristic, and use a genetic algorithm | the latter two techniques were superior to the rst, with the `heuristic picking' as preferable. It was as good or better than the genetic algorithm and it is simpler and quicker. However, there are many di�erent ways in which the details of both of these latter techniques can be speci ed, and so our results should be taken as no more than a rough guide to the possibilities. One important consideration is that the `heuristic picking' was a speci c customized algorithm for maximizing GD value. The GA technique is a much more general framework which can be used for a variety of choice techniques. In addition, it was not optimised for this particular application, and will `scale' better than the `pick heuristic for larger version spaces. Two decision strategies were used | overall majority and majority of three randomly selected (with `equivalent' versions de ned for the two-level systems). With only one type of diversity to exploit (i.e. minimum coincident failure diversity) whatever its source, e.g. di�erent net type or weight seed, the overall majority strategy of a single-set system was always superior to use of the `equivalent' majority of majorities with a two-level system composed of precisely the same versions. This is to be expected because the two-level organisation means that at most only three networks from each set of ve can contribute to the nal outcome. Whereas in the single-set system, any subset of ve can contribute whatever is most advantageous (i.e. from zero to all ve) to the nal system outcome. However, when we consider selecting only three versions to determine the system outcome, the story is not so straightforward. In particular, if a two-level system is composed of maximally diverse subsystems (e.g. each subsystem is chosen from a di�erent diverse subspace) then the two-level system architecture is superior to the single-set equivalent. Finally, a study across a sequence of set sizes were performed in order to relax the 15-version system size, and to explore several system features that were suggested by the basic experiments. Using majority-vote decision strategies, system performance appears to be based on a non-simple interaction of version-set diversity (GD), inter-set diversity (GDB), and average performance of the individual versions. In addition, very high GD values appear to be more readily obtainable in sets with few versions, yet majorityvote performance tends to improve as more versions are included in the majority | i.e. improves with larger version sets. The study indicated that when a resource constraint is used (i.e. best performance with least versions) a set size of ve was optimum. However, in the absence of this constraint, GD appears to level o� and overall majority appears to keep edging up as set size increases. This suggests the, not too surprising, optimum strategy is to use as many versions as possible while maintaining the GD level of the set. But because resources are always limited a maximally diverse heuristically picked set of about ve versions appears to be the optimum way to obtain a highly reliable system (always better than 99%, and better than 99:9% on 80% of occasions). However, if 100% 21
to better than a 0:01% is required then a properly constructed six-version set will supply this result on 80% of occasions. And the use of larger test sets (again subject to available resources) can be used to increase the certainty of a 100% result to any desired level. With respect to the choice techniques, several of the experiments seem to suggest that both heuristic picking and the genetic algorithm ought to be modi ed to stop choosing further versions when con icting constraints are optimised rather just choosing a predetermined number of versions. Finally, the application to other problems not only supports the generality of the techniques we propose but reveals further signi cant scope for improvement when we distinguish between identical and di�erent failures. In general, the more we can disperse errors di�erently the less adverse impact they will have on the system performance.
22
References Drucker et al. [1994] H Drucker, C Cortes, L D Jackel, Y LeCun, and V Vapnik. Boosting and other ensemble methods. Neural Computation, 6:1289{1301, 1994. Frey and Slate [1991] P W Frey and D J Slate. Letter recognition using Holland-style adaptive classi ers. Machine Learning, 6:161{182, 1991. Knight and Leveson [1986] J C Knight and N G Leveson. An experimental evaluation of the assumption of independence in multiversion programming. IEEE Transactions on Software Engineering, 12(1):96{109, 1986. Lincoln and Skrzypek [1990] W P Lincoln and J Skrzypek. Synergy of clustering multiple back propagation networks. In D S Touretzky, editor, Advances in Neural Information Processing Systems 2, pages 650{657. Morgan Kaufmann, 1990. Littlewood and Miller [1989] B Littlewood and D R Miller. Conceptual modeling of coincident failures in multiversion software. IEEE Transactions on Software Engineering, 15(12):1596{1614, 1989. Moody and Darken [1988] J Moody and C Darken. Learning with localized receptive elds. In D Touretzky, G E Hinton, and T J Sejnowski, editors, Proceedings of the 1988 Connectionist Models Summer School, pages 133{143. Morgan Kaufman, 1988. Partridge and Yates [1994] D Partridge and W B Yates. Replicability of neural computing experiments. IEEE Transactions on Neural Networks, (submitted), 1994. Partridge [1994] D Partridge. Network generalization di�erences quanti ed. Research Report 291, University of Exeter, 1994. Pearlmutter and Rosenfeld [1991] B A Pearlmutter and R Rosenfeld. Chaitin-Kolmogorov complexity and generalization in neural networks. In R P Lippmann, J E Moody, S J Hanson, and D S Touretzky, editors, Advances in Neural Information Processing Systems 3, pages 925{931. Morgan Kaufmann, 1991. Rumelhart et al. [1986] D E Rumelhart, G E Hinton, and R J Williams. Learning internal representation by error propagation. In D E Rumelhart and J L McClelland, editors, Parallel Distributed Processing. Explorations in the Microstructure of Cognition. Volume 1: Foundations, pages 318{362. MIT Press, 1986. 23
Yates and Partridge [1995] W B Yates and D Partridge. Use of methodological diversity to improve neural network generalisation. Neural Computing and Applications, (accepted), 1995.
24