which is built on top of the Moose reengineering environ- ment [5], and we applied ..... 12. window, docking, dockable, factory, panel â 13 classes. 13. BSH, VOID ...
Enriching Reverse Engineering with Semantic Clustering In proceedings of Working Conference On Reverse Engineering (WCRE 2005)
Adrian Kuhn Software Composition Group University of Berne, Switzerland
St´ephane Ducasse LISTIC, Universit´e de Savoie, France SCG, University of Berne, Switzerland
Tudor Gˆırba Software Composition Group University of Berne, Switzerland
Abstract
tion between developer and machine, and communication among developers1 . Analyzing semantics relies on the latter, since the communication with the machine is formal and only a matter of correct structure and syntax, e.g. the naming of an identifier is irrelevant to the machine, not to mention that comments get completely ignored. On the other hand communication among developers is informal and uses a rich vocabulary bearing semantic information. Consider, for example, a short testing method telling whether a time value is in the morning:
Understanding a software system by just analyzing the structure of the system reveals only half of the picture, since the structure tells us only how the code is working but not what the code is about. What the code is about can be found in the semantics of the source code: names of identifiers, comments etc. In this paper, we analyze how these terms are spread over the source artifacts using Latent Semantic Indexing, an information retrieval technique. We use the assumption that parts of the system that use similar terms are related. We cluster artifacts that use similar terms, and we reveal the most relevant terms for the computed clusters. Our approach works at the level of the source code which makes it language independent. Nevertheless, we correlated the semantics with structural information and we applied it at different levels of abstraction (e.g. classes, methods). We applied our approach on three large case studies and we report the results we obtained.
/** Return true if the given 24-hour time is in the morning and false otherwise. */ public boolean isMorning(int hours,int minutes,int seconds) if (!isDate(hours, minutes, seconds)) throw Exception(”Invalid input: not a time value.”) return hours < 12 && minutes < 60 && seconds < 60;
Stripping away all identifiers and comments, the functionality remains the same, but the meaning becomes obfuscated and hard to tell. In our example, removing informal information yields:
Keywords: semantic analysis, clustering, concept location, reverse engineering
1
public type 1 method 1(type 2 a, type 2 b, type 2 c) if (!method˙2(a, b ,c)) throw Exception(literal˙1). return (a op 1 A) op 2 (b op 1 B) op 1 (c op 2 C);
Introduction
On the other hand, retaining only the informal information yields:
Many reverse engineering approaches focus on structural information and ignore semantic information like the naming of identifiers or comments. But developers put their domain knowledge into exactly these parts of the source code. Without understanding the semantics of the code, one cannot tell its meaning. For example, the class structures of a text processor, a web server, a physical simulation or a computer game might all look the same. But the identifiers names and the comments will differ, since they use a domain specific vocabulary that contains information about its semantics. Source code is a means of communication: communica-
is int hours minutes int < minutes input hours is seconds && boolean morning false time minutes not 60 invalid && value seconds time < seconds hour given hours 60 12 < morning date int is otherwise
Information retrieval techniques can be applied to software to recover its semantics. Marcus et al. propose Latent 1 Source
code also contains communication between developer and user: e.g. Text snippets in the source code that are displayed to the user. But for the purpose this paper, this can be subsumed under developer communication without loss of generality.
1
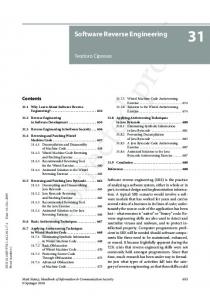
Even though the most common usage of LSI are search engines [2], there is a wide range of possible applications: to grade essays automatically [8], to detect authorship in literature [20], to automate the assignment of reviewers to submitted conference papers [7], to build cross-language search engines [13], to model the human brain and how children acquire language [12], to build thesauri, to spell check etc. Figure 1 schematically represents the LSI process. The document collection is modeled as a vector space. Each document is represented by the vector of its term occurrences. Terms are words appearing in the document. Thus the document vectors are the rows of a sparse matrix, the term-document-matrix. This matrix A is of size n × m, where m is the number of documents and n the total number of terms over all documents. Each entry ai,j is the frequency of term ti in document dj . A geometric interpretation of the term-document-matrix is a set of document vectors occupying a vector space spanned by terms. The similarity between documents is typically defined as the cosine or inner product between the corresponding vectors, thus two documents are considered similar if their corresponding vectors point in the same direction.
Semantic Indexing (LSI), an information retrieval technique that takes as an input an index of documents and terms [19], as a means to locate such concepts [1]. Recently Kawaguchi et al. used LSI to categorize software projects, based on analysis at the file level [22]. In this paper we combine both approaches, and apply them at different levels of abstraction to analyze objectoriented systems. We use LSI as a technique and choose as documents the entities in the software system (e.g. classes, methods) and as terms the identifiers and comments. We use LSI to retrieve the semantic similarity between different entities (e.g. whole systems, classes and methods), and then we cluster these entities according to their similarity. We employ this technique to characterize entities by clustering their sub entities. For example, we characterize a system by clustering its classes, or a class by clustering its methods. We further use LSI to recover the most relevant terms for the obtained clusters, thus providing a documentation to the groups of entities. Furthermore, we visualize the clusters and their relation to each other. We implemented this approach in a tool called Hapax2 , which is built on top of the Moose reengineering environment [5], and we applied it to several case studies. The contributions of the paper are: • combining the structure of software systems with semantical information,
documents terms
• defining a visualization to visualize the clustering result,
LSI
• automatic labeling of the clusters, • interpretation of the clusters at different level of abstraction.
Figure 1. LSI takes as input a set of documents and the terms occurrences, and gives as output one space with all the terms and all the documents are represented. The similarity between two items is given by the angle between their corresponding vectors.
Structure of the paper. We first describe the LSI technique. In Section 3 we show how we use LSI to analyze the semantics of the system and how we can apply the analysis at different levels of abstraction. In Section 4 we present the results on three case studies and in Section 5 we show the implementation. We discuss different variation points in Section 6. Section 7 browses the related work and Section 8 concludes and presents the future work.
2
LSI starts with a raw term-document-matrix, weighted by some weighting function to balance out very rare and very common terms. Then SVD is used to break down the vector-space-model into less dimensions. This algorithm preserves as much information as possible about the relative distances between the document vectors, while collapsing them down into a much smaller set of dimensions. SVD decomposes matrix A into its singular values and its singular vectors, and yields – when truncated at the k largest singular values – an approximation A0 of A with rank k. Furthermore, not only the low-rank term-document matrix A0 can be computed but also a term-term matrix and
Latent Semantic Indexing in a Nutshell
Latent Semantic Indexing (LSI) is a standard technique in information retrieval to index, retrieve and analyze textual information [3]. As input LSI takes a collection of text documents, and yields as output an index with similarities between these documents. Singular Value Decomposition (SVD) is used to reduce the problem size [9]. 2 The name is derived from the term hapax legomenon, that refers to a word occurring only once a given body of text.
2
3.2
a document-document matrix, thus, LSI allows one to compute term-document, term-term and document-document similarities. As the rank is the number of linear-independent rows and columns of a matrix, the vector space spanned by A0 is of dimension k only and much less complex than the initial space. When used for information retrieval, k is typically about 200-500, while n and m may go into millions. And since A0 is the best approximation of A under the leastsquare-error criterion, the similarity between documents is preserved, while – since A0 is of rank k – mapping semantically related terms on the same axis of the vector space and thus taking into account synonymy and polysemy. Intuitively explained, the initial term-document-matrix A is a table with term occurrences and by breaking it down to much less dimension the latent meaning must appear in A0 since there is now much less space to encode the same information. Meaningless occurrence data is transformed into meaningful concept information.
3
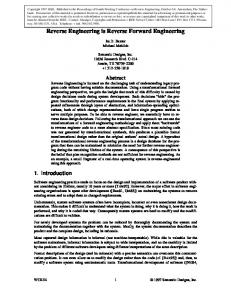
LSI is applied to the term-document matrix to build an index with similarities. Based on it, we can determine the semantic similarity between software artifacts as well as the similarity between terms and software artifacts. The similarity is defined as the cosine, or inner product between the document or term vectors4 . The similarities can be visualized in a correlation matrix, as in Figure 2. As the similarities are cosine values between 1,0 and -1,0, it is easy to map them to gray values: The darker a dot is in the matrix, the more similar are the two entries corresponding to its row and column. The main diagonal of a correlation matrix is black, since each entry is semantically equal to itself, the off-diagonal dots show the correlation between different entries.
3.3
Figure 2 shows the overview of our approach. First, we preprocess the source code to obtain the term-document matrix. We apply the LSI to obtain the similarities between documents. We cluster the similar entities, and in the end we post-process and analyze the clusters. We present each phase in details in the rest of this section.
Preprocessing: Building the Corpus
The input data is the source code, broken into pieces at an arbitrary level of granularity (e.g. modules, classes, methods etc.) to define the documents used by LSI. The terms are the words found in the source, except keywords of the programming language. From content found in comments we exclude a stop-list of common English words. Identifiers written in camel-case are split into their components. For example, FooBar becomes foo and bar. All terms get normalized with the Porter stemming algorithm [21]. For example, entity and entities both become entiti. We build the term-document matrix, with all documents and all terms. Terms appearing only once are discarded as they are useless for finding the similarity between different documents. The initial term-document matrix is weighted with ltf-idf ; meaning log-term-frequency as local weighting, and inverse-document-frequency as global weighting. The weighting’s purpose is to balance out the influence of very rare and very common term3 . 3 For
Clustering: Ordering Correlation Matrix
Without proper ordering the correlation matrix looks like television tuned to a dead channel. By ordering the entries of the correlation matrix according to the result of a clustering algorithm, we get a visualization of the semantic correlations. One can, at a glance, see the number and size of all clusters, their inner structure and the correlation in-between the clusters. Thus, the software reengineer can detect hotspots with either high or low semantic correlation. And, by comparing the correlation matrixes of different artifacts, he can classify them. We use a hierarchical clustering algorithm to cluster the entries of the correlation matrix. This algorithm creates a dendrogram (i.e. a hierarchical tree) with clusters as its nodes and the documents as its leaves [11]. A super node in the tree is a cluster containing its leaves. Traversing this tree and collecting its leaves yields an ordering that sorts the entries by their similarity, putting similar entries and similar clusters near each other, and dissimilar ones far apart of each other. The correlation matrices in this paper are ordered by using average linkage clustering, and by traversing the tree larger-clusters-first. Documents which are not similar enough to any cluster usually end up as single-document clusters in the bottom right of the correlation matrix.
Hapax Semantic Clustering
3.1
LSI: Building the Similarity Index
3.4
Post-processing: Semantic Hot-Spots
The goal of the post-processing step is to highlight interesting patterns on the correlation matrix and to filter out all other noise. Our experiments showed that the most interesting patterns are one-to-many relationships between a single software artifact and a cluster of software artifact. We name a semantic hot-spot a single artifact in one cluster that shares semantics with another cluster.
more details concerning weighting functions please refer to [6,
4 More
15].
3
in-depth information on using LSI is given in [3].
...
preprocess
Source code
terms
documents
LSI
cluster
Term-document matrix
Correlation matrix
Clustered correlation matrix
Figure 2. Semantic clustering of software artifacts (e.g. classes, methods). The source code gets processed into an index table. LSI is used to identify the similarities between entities and the result is displayed in a correlation matrix. Furthermore, the entities get clustered and for each cluster we compute the most relevant terms.
To highlight these semantic hot-spots on the correlation matrix, we first paint both each cluster and each offdiagonal rectangle with its average color given by the average of all similarities inside its box. Afterwards, we compute the average similarity between single entities and whole clusters. If the difference between this one-to-many averages and the above overall averages exceeds a certain threshold, we have found a semantic hot-spot and paint the corresponding line in the color of its average. The correlation matrices in this paper use a hot-spot threshold of 0.2. The result of the post-processing is a checkered board of boxes, and inside these boxes we might obtain horizontal or vertical lines. The rectangles along the main diagonal are the clusters, colored with the density of this cluster i.e. the average similarity between all its entities. The off-diagonal rectangles are the relationship between clusters, colored with the average similarity between each two clusters i.e. between all entities in one cluster and all entities in the other one. The vertical and horizontal lines are the semantic hot-spots, each painted in the color of the average similarity between its single entity and the entities in the corresponding cluster. Cluster A
the post-processing. On the later matrix we see two clusters A and B and in the off-diagonal three semantic hotspots. The two vertical lines are entities in cluster B that are more related to cluster A than all other entities in cluster B, while the horizontal line is an entity in cluster A more related cluster B than all other entities in cluster A. Furthermore there is a light cross in cluster B, which is a single entity in this cluster that is less related to the cluster than all its other entities. The same goes for the entities in the bottom right of cluster A.
3.5
Labeling the Clusters
Any semantic analysis is not complete without interpretation. Just visualizing clusters is not enough, we want to have an interpretation of their of semantic concepts. We need a written description of the concept covered by a cluster, that is we need labels that describe the cluster. Often just enumerating the names of the software artifacts in a cluster (e.g. displaying the class names) gives a sufficient interpretation. But, if the names are badly chosen or in case of analyzing unnamed software artifacts, we use an automatic way to identify labels.
Cluster A hot-spots hot-spot highlighting
Figure 3. The step of highlighting the semantic hot-spots.
The labeling works as follows: As we already have – from the previous steps – an LSI index at hand, we use this index as search engine5 . We reverse the usual search process, where a search query of terms is used to find document. Instead we use the documents in a cluster as search query, to find the most relevant terms. We label the clusters with the top-ten search results.
In Figure 3 we show a correlation matrix before and after
5 For technical details on how to run search queries using LSI please consult [2].
Cluster B
Cluster B
4
4
Hapax Semantic Clustering At Work
are, from top-left to bottom-right: Hapax, Van, Moose, ConAn and CodeCrawler. Moose is the core framework, all other module are plug-ins built on top of Moose [5]; CodeCrawler extends Moose with visualization capabilities [14]. The background color of a cluster shows its density given by the average similarity between all its classes. The background colors of the off-diagonal rectangles show the relationships in-between clusters (i.e. the average similarity between all classes of one cluster to all classes of the other cluster). If the background color is white two clusters are not related, if it is gray they are related – the darker the gray the stronger the relationship. The lines indicate semantic hot-spots which are single classes in one cluster that stand out as its similarity to all classes in another cluster is significantly above or below the average similarity.
To show the generic nature of the approach, we apply it at different levels of abstraction on case-studies written in different languages. 1. In the first case-study we analyze the core and the plugins of a large framework, the Moose reengineering environment [5]. This experiment focuses on the relation between architecture and semantics. It reveals, among other findings, four cases of duplicated code and a core functionality misplaced in one of the plug-ins. 2. The second case-study is the class MSEModel, which is one of the largest classes in Moose. This experiment applies our approach on a different level of abstraction to focus on more in-detail findings. It visualizes the relationship among methods of a large class, and reveals that the class should be split as it servers at least two different purposes.
Hapax
Van
3. The third case-study, the JEdit open-source Java editor, focuses the relationships among classes and proves the strength of our approach in identifying and labeling semantic concepts.
Moose
The following table summarizes the problem size of each case study. It lists the number of documents and terms in the vector-space-model, and the rank to which the vector space has been broken down with LSI, see Section 2. Moose and JEdit use classes as input documents, and MSEModel uses methods. Case-study Moose MSEModel JEdit
4.1
Language Type Documents Smalltalk Classes 726 Smalltalk Methods 4324 Java Classes 806
Terms 11785 2600 2316
Conan CodeCrawler
Figure 4. The correlation matrix of the Moose environment and four plug-ins.
Rank 27 32 28
Hapax. The background color shows that Hapax is slightly related to the core, but not related to the other plugins. A noteworthy hot-spot is the line parallel to the core which indicates a class in Hapax strongly related to the core as a whole. Another hot-spot is shown by the line orthogonal to Van indicates a class in Van strongly related to Hapax. Closer inspection reveals that:
The Moose Environment and its Plug-ins
This case-study shows the application of our approach to analyze how modules are semantically related to each other. The granularity of the correlation matrix are classes, grouped by modules and ordered inside modules by semantic similarity. The goal here is to detect relationships between the plug-ins and the framework. One would expect to find for each plug-in a large part of classes that are not similar to the framework or other plug-ins, since each plug-in extends the framework with new functionality. One would also expect to find some classes that share semantic content with the framework, since each plug-in hooks into the core. Figure 4 shows the correlation matrix. There are five blocks on the main diagonal, one for each module. They
• the first is a generic visitor class missing in the core that got implemented in Hapax, and • the second is an implementation of a matrix data structure in Van duplicating code in Hapax. Although Hapax provides visualizations (e.g. the one in this article) it does not share any semantics with CodeCrawler which is a visualization tool. This is an indicator that its visualizations are not based on that CodeCrawler. 5
This could become a source of potential functional duplication. Van. The broad white margin, at the bottom right inside its box, is an indicator that Van contains many utility classes not related to the main concepts implemented in it. The background colors of the off-diagonal rectangles show that Van is related to both the Moose core and CodeCrawler. Noteworthy hot-spots are – beside the line shared with Hapax mentioned above – the fat group of lines parallel to CodeCrawler; and the lines parallel to ConAn, since Van is otherwise not related to ConAn. Closer inspection reveals that: • the first as subclasses extending the CodeCrawler framework, thus Van makes heavy use of that plug-in, and • the second hot-spot is an implementation of a tree data structure duplicating code in ConAn. Moose. As we discuss the relationship of Moose to its plug-in in the other paragraphs, we examine here its inner structure. The light background color shows that Moose is less semanticaly dense than the plug-ins. While all plug-ins deal with one concept, ConAn being the most dense, Moose contains two broad concepts separated by the white lines in its center. Closer inspection reveals that the first concept is the meta-model, including the FAMIX model [4]; and the second concept are metrics and operators common to these metrics. ConAn. The background colors show that ConAn is, as Van, related to both the core and CodeCrawler. Noteworthy hot-spots are – beside the code duplication mentioned above at Van – the group of lines parallel to CodeCrawler; and the white cross inside the box, standing out from the otherwise very dense content. Closer inspection reveals:
Figure 5. The correlation matrix of the methods inside the MSEModel class.
Our findings in this case study show that the correlation matrix reveals valuable information about the relationship between the different modules: it has revealed about a dozen strong relations by inspecting the semantical hotspots. Among them, we found four cases of potential code duplication [18], and one case of functionality missing in the core.
4.2
Method Correlation in a Class
We also applied our approach to understand the internals of one class. The lines and columns in the correlation matrix are methods, ordered by their semantic similarity. The goal is to detect different concepts in a large class with 164 methods. The class is MSEModel, the core of the Moose model. The purpose of this class is similar to the Document class in the XML DOM model [23]. The most evident patterns are: the large cluster in the top left, and the smaller but dense cluster not related to any other clusters. As the background colors show all other blocks are related to the large cluster, but not to the dense one. A look at the method names reveals the large cluster as the accessing protocol of the class, providing access to the nodes in the model’s graph. The dense cluster is the metainformation protocol, providing access to author, date and creation data, which is a piece of information used only by import-export classes. The method names of the medium-sized cluster in the
• the first, again as in the case of Van, as extensions by subclassing of the CodeCrawler framework, and • the second as user-interface classes. CodeCrawler. The background colors show that CodeCrawler is more related to other plug-ins than to the core, thus revealing it as being more an extension of the core than a real plug-in. Which is the case, since CodeCrawler extends Moose with visualization capabilities. Some noteworthy hot-spot have already been mention above, the two remaining are the long line parallel to the the core stretching over all other plug-ins; and the dark cross inside its box. Closer inspection reveals that: • the first as CCItemPlugin the root class of the hierarchy extended by both Van and ConAn, and • the second as 2D-geometry classes, forming the core of CodeCrawler rendering engine. 6
study on the labeling of semantic concepts, see section Section 3.5 Figure 6 displays the correlation matrix. Fro each of the clusters we identified the top-five most relevant labels. The following list shows the top five labels for each cluster, by traversing the matrix from top-left to bottom-right: 1. cell, renderer, pane, scroller, frame – 175 classes. 2. menu, VFSBROWSER, popup, show, adapter – 100 classes. 3. key, stroke, traversal, bindings, event – 16 classes 4. directory, dir, file, interrupted, install – 86 classes 5. run, request, runnable, later, thread– 73 classes 6. plugin, unload, dependencies, deactivate, jar– 65 classes 7. area, display, manager, range, text – 46 classes 8. dirty, redo, position, undo, bh – 11 classes 9. font, hints, paint, opaque, metrics – 48 classes 10. mymatch, substitute, RE, sub, expr – 39 classes
Figure 6. The correlation matrix of the classes inside the JEdit case study.
11. keyword, standard, terminate, rule, km – 19 classes 12. window, docking, dockable, factory, panel – 13 classes 13. BSH, VOID, callstack, interpreter, defined – 56 classes 14. CLASSSTATIC, CLASSCLASSES, gen, sk, cm – 21 classes 15. tree, mutable, RESULTS, href, toc – 3 classes
middle show that this is the modification protocol, containing methods to manipulate the model (e.g. addEntity and removeEntity). While the third cluster deals with structural relationships, as its top five labels are: inheritance, subclass, superclass, hierarchy, override. Both clusters are related to the accessing protocol but not to each other, as the background colors approve. The fifth cluster is related to the modification protocol and the labels reveal that it is dealing with unique IDs of the model’s node. Its top labels are: uuid, MSEUUID, id. Next are three clusters not related to any other, their top labels are log, stream, cr and import, context, facade and space, term, vocabulary. They are the logging facility, the import facility, and an extension of the Moose model specific to LSI and semantic clustering.
16. advance, exit, xe, NOTICE, server – 5 classes 17. interface, ACC, meth, var, super – 12 classes 18. hit, tar, sz, RCDSIZE, BLKSIZE – 9 classes 19. stream, output, input, pout, urlcon – 5 classes 20. token, sequences, trymatch, newbufcolumn, newbuffer – 1 class
The semantic clustering captured all relevant concepts of the JEdit text editor and even brought them in a meaningful order. The list starts with user interface concepts e.g. menu and key handling. Then IO and plug-in facilities, followed by the rendering engine and the undo facility. The next two clusters are the search functionality, and then dockable windows. And finally, starting with cluster 13, the BSH scripting feature, including a tokenizer and a parser with syntax tree.
In this case study, we looked at the clusters and their labels and got a full overview of the concepts covered by this class. Furthermore we identified four concepts not related to the core functionality of the class, that might be good candidates to factor out into classes of their own.
4.3
5
Implementation: Hapax and Moose
We implemented our approach in Hapax, a tool built on top of the Moose reengineering environment [5]. Figure 7 emphasizes the interactive nature of our tool. On the left we see the main window of Hapax. On left part of the window is the correlation matrix visualization. On the right side of the window, there are three panels that are updated as the mouse moves over the matrix. The top two panels show the entity on the current row and the entity
Class Correlation and Labels
This case-study applies our approach at the level of a module analyzing the semantical clustering of the classes. Our goal is to detect different concepts in a large application, JEdit, composed of 806 classes. JEdit is an opensource text editor written in Java. We focus in this case 7
Slider for setting the clustering threshold
The entities on the row and on the column in the current point Search query
Correlation Matrix
Current point
Labels of the current cluster
Search result
Figure 7. Hapax and Moose. To the left we show the main Hapax window. To the right we show how we can search for the entities relevant to a query string.
on the current column. The bottom panel shows the labels attached to the current cluster. On the right side of the window there is a slider for setting the clustering threshold. When the slider is moved, the picture is redrawn with the new clusters. This feature allows one to explore different clustering configurations. On the right side of the figure we show how we use LSI to also search over the entities in the system. The top window contains the search query and the result is shown in the below window with the group of the entities ordered by their relevancy to the query.
6
ltf-idf [6], and as hot-spot threshold we use 0.2, see Section 3.4. Both values haven been shown to yield good results in our experiments. To choose values for the rank and the clustering threshold is more art than science [10, 3]. We use a rank of r = sqrt(min(m, n)) and clustering threshold of 0.75 as defaults, and provides sliders our tool Hapax to manually adjust them during analysis. On the noise on the correlation matrix. Navok uses correlations matrices in the same way as we do to visualize correlation in german literature to detect authorship [20]. But due to the different nature of source code, our correlation matrices contain much more noise. Our experiments showed that the most interesting patterns are the one-tomany relations ships between classes, thus we decided to highlight them in the way explained in Section 3.4. We call these patterns semantic hot-spots.
Discussion
In this section we discuss different variation points, as well as the benefits and limitations of the approach. On the granularity of software artifacts. As mentioned, the source code can be broken into documents at any level of abstraction. Straightforward approaches are breaking it into classes, methods or functions. But any other slicing one might think of is possible.
On badly named identifiers. Not unlike structural analysis which depends on correct syntax, semantic analysis is sensitive to the quality of identifiers and comments. Software systems with a good naming convention and well chosen identifiers yield best results. Our approach recovers the developer knowledge put into the identifiers and comments, but if the developers did not name the identifiers with care, our approach fails since valuable developer knowledge is missing. For example if all local variables are just named temp, foo or x, y and z. Due to LSIs strength in detecting synonymy and polysemy, our approach can deal with a cer-
On the parameters used. Our approach depends on several parameters, which are hard too choose for someone not familiar with the underlying technologies. First, LSI depends on the weighting functions and the choice of the rank, see Section 2. Furthermore, we use two parameters in the postprocessing step. We used as weighting function we use 8
As opposed to their work, we analyze object-oriented systems at different levels of abstraction and we provide visualization and interpretation of the clusters. LSI was also used in other related areas. Marcus and Maletic used LSI to detect high-level conceptual clones [18], that is they go beyond just string based clone detection using the LSI capability to spot similar terms. The same authors also used LSI to recover links between external documentation and source code [19] by querying the source code with queries from documentation. Marcus et al. employed LSI to detect concepts in the code [1]. They used the LSI as a search engine and searched in the code the concepts formulated as queries. The article also gives a good overview of the related work. Kawaguchi et al. used LSI to categorize software systems in open-source software repositories [22]. They provide a tool that categorizes the projects and labels the categories. Their approach is restricted to one level of abstraction (i.e. applications), and it only uses the files as input documents.
tain amount of such ambiguous or even complectly wrong named identifiers – but if most of the identifiers in system are badly chosen, the approach fails. On the abbreviated identifiers. This is similar to badly named identifiers, but in this case only the labeling fails and not the clustering itself. LSI analyzes the statistical distribution of terms across the documents, thus for the clustering task it does not matter whether identifiers are consistently written out or abbreviated. But if the labeling task comes up with terms like for example pma, tcm, IPFWDIF or sccpsn this does not tell a human reader much about the system 6 . On the dimension of the vocabulary. The vocabulary of source code is very small: in average only about 5-10 distinct terms per method body, and 20-50 distinct terms per class. In a well commented software system, these numbers are much higher since comments are human-readable text, and thus, use a much larger vocabulary than plain source code. In general LSI does not perform as good in software analysis as in textual analysis. Intuitively explained: LSI mimics the way children acquire language [12], and a human with a vocabulary of 2000 terms is less eloquent and knowledgeable than a human with a vocabulary of 20’000 term. The smaller the vocabulary, the stronger the effect of missing or incorrect terms.
8
Source code holds the semantic information in the names of identifiers or in the comments. Many reverse engineering approaches focus only on structural information, yet, the structure of the software cannot answer the question: What is the code about? This paper proposes an approach to analyze the semantic information from the perspective of reverse engineering. We use Latent Semantic Indexing (LSI), a robust information retrieval technique that works with documents and terms. We consider as documents the entities in the software system (e.g. classes, methods), and as terms the identifiers and comments. We use LSI to retrieve the semantic similarity between different entities and we cluster these entities according to their similarity. We employ this technique to characterize entities by clustering their sub entities (e.g. characterize the system by clustering its classes, or a class by clustering its methods). We further use LSI to recover the most similar terms to the obtained clusters, thus providing a documentation to the groups of entities. We implemented our approach in a tool called Hapax. Hapax is built on top of the Moose reengineering environment [5], We used the tool to analyze several case studies written in Java and Smalltalk. We plan to investigate how semantic clustering can be useful for recovering the architecture. For example, in a layered architecture, each layer uses a specific vocabulary. Hence if we cluster classes based on semantic similarities and compare this with the structural packages we can detect classes that are placed in the wrong package. Furthermore,
On the use of ontology. As LSI is not based on an ontological database, its vocabulary is limited to the terms found in source code. In case of missing terms, our approach will not find accurate labels. Take for example a package about linear algebra in which the term linear algebra is never used, just matrix and vector. In this case our approach will label the package with these terms, as the correct term is missing. Thus, using an ontology might improve the results.
7
Conclusions
Related Work
Maletic and Marcus were the first to apply LSI for software reverse engineering [16]. They used LSI to analyze the semantic clusters of the files of Mosaic. Even if they only considered as documents files, they showed the usefulness of information retrieval techniques in reverse engineering. The relation between the structure of the system and the semantical information was explored in a follow up work by the same authors when they analyzed the same case study, only at the level of procedures [17]. 6 These terms are examples taken from a real case study not included in this paper, where about a third of all identifiers where abbreviations. In this case the labeling was completely useless.
9
semantic clustering is able to detect the business domains which are orthogonal to the layers in the same way, as also each domain uses its own vocabulary. On the other hand we would like to integrate an LSI engine in an IDE to support:
[7] S. T. Dumais and J. Nielsen. Automating the assignment of submitted manuscripts to reviewers. In Research and Development in Information Retrieval, pages 233–244, 1992. [8] P. W. Foltz, D. Laham, and T. K. Landauer. Automated essay scoring: Applications to educational technology. In Proceedings of EdMedia ’99, 1999. [9] G. H. Golub and C. F. V. Loan. Matrix computations. Johns Hopkins Studies in the Mathematical Sciences. The Johns Hopkins University Press, Baltimore, MD, USA, third edition, 1996. [10] A. Jain, M. Murty, and P. Flynn. Data clustering: a review. ACM Computing Surveys, 31(3):264–323, 1999. [11] A. K. Jain, M. N. Murty, and P. J. Flynn. Data clustering: A review. ACM Computing Surveys, 31(3):264–323, Sept. 1999. [12] T. Landauer and S. Dumais. The latent semantic analysis theory of acquisition, induction, and representation of knowledge. In Psychological Review, volume 104/2, pages 211–240, 1991. [13] T. Landauer and M. Littmann. Fully automatic crosslanguage document retrieval using latent semantic indexing. In In Proceedings of the 6th Conference of the UW Centre for the New Oxford English Dictionary and Text Research, pages 31–38, 1990. [14] M. Lanza and S. Ducasse. Codecrawler - an extensible and language independent 2d and 3d software visualization tool. In Tools for Software Maintenance and Reengineering, RCOST / Software Technology Series, pages 74 – 94. Franco Angeli, 2005. [15] R. LLoyd and C. Shakiban. Improvements in latent semantic analysis. American Journal of Undergraduate Research, 3:29–34, 2004. [16] J. I. Maletic and A. Marcus. Using latent semantic analysis to identify similarities in source code to support program understanding. In Proceedings of the 12th IEEE International Conference on Tools with Artificial Intelligence (ICTAI’00), page 46. IEEE Computer Society, 2000. [17] J. I. Maletic and A. Marcus. Supporting program comprehension using semantic and structural information. In International Conference on Software Engineering, pages 103– 112, 2001. [18] A. Marcus and J. Maletic. Identification of high-level concept clones in source code. In Proceedings of the 25th International Conference on Software Engineering (ICSE’03), 2001. [19] A. Marcus and J. I. Maletic. Recovering documentation-tosource-code traceability links using latent semantic indexing, 2003. [20] P. Nakov. Latent semantic analysis for german literature investigation. In Proceedings of the International Conference, 7th Fuzzy Days on Computational Intelligence, Theory and Applications, pages 834–841, London, UK, 2001. SpringerVerlag. [21] M. F. Porter. An algorithm for suffix stripping. Program, 14(3):130–137, 1980. [22] M. M. Shinji Kawaguchi, Pankaj K. Garg and K. Inoue. Mudablue: An automatic categorization system for open source repositories. In Proceedings of the 11th Asia-Pacific Software Engineering Conference (APSEC.04), 2004.
• Documentation. The labeling, or more simply just a search with a single software artifact as query, can propose possible keywords to be used in the documentation or comment of a software artifact. Furthermore, when building an index with both the source code and its documentation as a separated document, we can detect bad or out-of-date comments. Hence our approach can be used to grade Javadoc like comments; this is similar to the essay grading [8] mentioned in Section 2. • Search. Since semantic clustering makes use of an index created based on LSI, we can simply use it to provide a search functionality that goes beyond mere keyword matching, because LSI takes synonymy and polysemy into account. This is most useful in large projects where a single developer can not know the whole project and its exact vocabulary. This prevents high-level concept clones before they get written, since a search query finds the desired implementation even if the query terms itself do not match exactly. Acknowledgment. We gratefully acknowledge the financial support of the Swiss National Science Foundation for the project “Recast: Evolution of Object-Oriented Applications” (SNF 2000-061655.00/1).
References [1] V. R. Andrian Marcus1, Andrey Sergeyev1 and J. I. Maletic. An information retrieval approach to concept location in source code. In Proceedings of the 11th Working Conference on Reverse Engineering (WCRE.04), 2004. [2] M. W. Berry, S. T. Dumais, and G. W. O’Brien. Using linear algebra for intelligent information retrieval. Technical Report UT-CS-94-270, 1994. [3] S. C. Deerwester, S. T. Dumais, T. K. Landauer, G. W. Furnas, and R. A. Harshman. Indexing by latent semantic analysis. Journal of the American Society of Information Science, 41(6):391–407, 1990. [4] S. Demeyer, S. Tichelaar, and S. Ducasse. FAMIX 2.1 — The FAMOOS Information Exchange Model. Technical report, University of Bern, 2001. [5] S. Ducasse, T. Gˆırba, M. Lanza, and S. Demeyer. Moose: a Collaborative and Extensible Reengineering Environment. In Tools for Software Maintenance and Reengineering, RCOST / Software Technology Series, pages 55 – 71. Franco Angeli, 2005. [6] S. T. Dumais. Improving the retrieval of information from external sources. Behavior Research Methods, Instruments and Computers, 23:229–236, 1991.
10
[23] L. Wood, J. Sorensen, S. Byrne, R. Sutor, V. Apparao, S. Isaacs, G. Nicol, and M. Champion. Document Object Model Specification DOM 1.0. World Wide Web Consortium, 1998.
11