Mar 21, 2012 - CodeCity of Wettel [43] visualizes software systems using a city metaphor and also provides visualizations of the evolution of the systems.
Evolutionary and Collaborative Software Architecture Recovery with Softwarenaut Mircea Lungu Software Composition Group - University of Bern, Switzerland
Michele Lanza REVEAL @ Faculty of Informatics - University of Lugano, Switzerland
Oscar Nierstrasz Software Composition Group - University of Bern, Switzerland
Abstract Architecture recovery is an activity applied to a system whose initial architecture has eroded. When the system is large, the user must use dedicated tools to support the recovery process. We present Softwarenaut – a tool which supports architecture recovery through interactive exploration and visualization. Classical architecture recovery features, such as filtering and details on demand, are enhanced with evolutionary capabilities when multi-version information about a subject system is available. The tool allows sharing and discovering the results of previous analysis sessions through a global repository of architectural views indexed by systems. We present the features of the tool together with the architecture recovery process that it supports using as a case-study ArgoUML, a well-known open source Java system. Keywords: Architecture Recovery, Visualization, Reverse Engineering, Software Tools 1. Introduction Maintaining a software system implies a continuous effort to keep it up to date with the unanticipated changes in its environment [1]. Having therefore
Preprint submitted to Science of Computer Programming
March 21, 2012
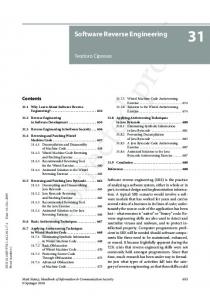
a clear and current understanding of the architecture of a system is critical for its maintenance and evolution [2, 3]. In the case of large software systems the architecture is specified through multiple architectural views that correspond to a set of given architectural viewpoints. An architectural viewpoint is a pattern or template from which to develop individual views by establishing the purposes and audience for a view and the techniques for its creation and analysis. Different authors propose different viewpoints [4, 5, 6] but the consensus is that multiple viewpoints are necessary for capturing all the various facets of a system. As a system evolves, its architecture erodes [7] and an architectural mismatch arises between the as-defined and as-is architecture [8]. One accompanying property of this continuous drift between the actual and the defined architecture of the system is an increasing brittleness of the system [7]. The main reason for architectural erosion and drift is widespread lack of programming language support for expressing the architecture, as well as the lack of tools that associate architectural decisions with the source code. When the drift and erosion have brought the system architecture away from the initial state, the solution is to recover the architecture of the system from the source code. Jazayeri defined architecture recovery as “the techniques and processes used to uncover a system’s architecture from available information” [9]. While some steps of architecture recovery, such as static analysis and fact extraction, can be automated, the process requires human intervention and in this context adequate tool support is crucial. From the multiple existing architectural viewpoints the architecture recovery tools focus on recovering module and connector views through visualization and interaction [10, 11, 12]. Figure 1 presents the general architecture of any architecture recovery tool. Softwarenaut relies on external tools for the first step and provides support for the second and third steps: • Step 2: Information Aggregation. The tool takes into account the hierarchical decomposition of a system as a basis for aggregating artifacts and relationships. In the case of a missing hierarchical decomposition the tool can automatically generate one. When multiple versions of a system are available the tool takes them into account to create a history by fully modeling each individual version.
2
Fact Extraction Extract low-level artifacts and relationships between them.
Information Abstraction
Interactive Exploration
Aggregate low-level artifacts vertically along the containment hierarchy of the system and across versions.
Recover architectural views through exploration. Filter irrelevant information. Save views. Share views.
Softwarenaut
Figure 1: Softwarenaut addresses the last two phases of an extract-abstract-view process
• Step 3: Interactive Visualization and Exploration. The tool allows for interactive exploration built around the “overview, zoom and filter, then details on demand” information visualization mantra [13]. It provides a variated range of filtering mechanisms and allows the recovered architectural views to be shared between users and tools. The following are several of the contributions of the tool to the state of the art in architecture recovery: • Supporting multi-version analysis of software systems and enhancing the exploration, filtering, and details on demand capabilities with evolutionary information. • Providing support for collaboration by allowing users to publish and discover previously published architectural views which are indexed by the analyzed system. • Providing a rich set of interactive navigation and visualization features that are required for architecture recovery [14] in the context of an open and extensible architecture. Structure of the article. We start with describing the particularities of the tool in two of the phases of architecture recovery: information aggregation (Section 2) and interactive exploration (Section 3). In Section 4 we discuss the integration of evolutionary analysis in Softwarenaut. In Section 5 we show how sharing architectural views enables collaboration. In Section 6 3
we discuss architectural considerations and in Section 7 we discuss the toolbuilding experience. In Section 8 we present related work and in Section 9 we conclude and outline future work. 2. Information Abstraction The fundamental technique that enables abstraction in Softwarenaut is aggregating horizontal relationships between software artifacts along the containment relationships. Figure 2 exemplifies the aggregation of low-level relationships between methods and classes along the containment hierarchy of a Java system. The case study is ArgoUML1 and the figure focuses on the relationships between four classes from three different packages: uml, uml.kernel, uml.ui, and persistence. All these packages contain many classes but the visualized entities are sufficient for illustration purposes. uml kernel Project Manager getCurrent Project
persistence ui Action OpenProject actionPerfor med
Persistence Manager getInstance AbstractFile Persister getExtension
Explicit dependency (e.g. Method Call) Implicit Dependency
Figure 2: The aggregation of explicit dependencies into implicit ones along the containment hierarchy of methods, classes, and packages in several classes from the ArgoUML case study.
The figure contains three method calls that can be obtained through static analysis of the system: the method calls between actionPerformed and re1
Throughout this article we will continue using ArgoUML as a case study. When we do not specify otherwise we refer to version 0.24.
4
spectively getCurrentProject, getInstance, and getExtension. These explicit relationships propagate as implicit relationships vertically along the containment relationships that exist between methods, classes and packages. Some of the implicit relationships that can thus be derived are the dependencies between the ui package and the PersistenceManager class as well as the dependency between the uml package and the persistence package. Aggregating explicit relationships across the hierarchy has a worst case order of complexity of O(n2 ) [15]. Even if in real systems there are never relationships between all the leaves of the tree, so the worst case scenario is never encountered, it is common that for non-trivial systems, the on-thefly computation of the dependencies can make interactive analysis sluggish. To enable interactivity on large systems it is efficient to pre-compute the dependencies between the nodes in the hierarchy [15]. ModelRelationship Hierarchical Graph
...
*
*
TreeNode
2
Relationship
entity: ModelEntity
Invocation
Inheritance
Access
*
from, to: TreeNode ModelEntity
*
Composite
Leaf
Explicit Relationship
Implicit Relationship
relationship: ModelRelationship
... * Class
Method
Package
Figure 3: The hierarchical graph model in Softwarenaut.
The data structure that Softwarenaut uses to keep track of the precomputed dependencies in a software system is a hierarchical graph. The data structure is central to the architecture of the system itself. Figure 3 presents a class diagram of the classes that implement the concept. The figure shows that a hierarchical graph contains two types of entities: Tree Nodes. These are the wrappers of ModelEntities — artifacts in a software system that can be organized hierarchically in a containment 5
tree. The diagram shows that the tree is implemented using a Composite design pattern. The objects that the leaves wrap depend on the type of analysis and available data (in some cases they are classes, and in some others they are methods and instance variables). The composite entities are higher-level entities which are either declared in the programming language (such as namespaces and packages) or are obtained as a result of analysis (such as clusters resulting from the hierarchical clustering of the leaves). Relationships. There are two types of relationships: explicit and implicit. Explicit Relationships are extracted using both static and dynamic analysis. They often exist between the leaves of the tree (e.g., invocations between methods) but not necessarily so (e.g., the inheritance relations between classes in a tree which contains both methods and classes). Explicit Relationships wrap actual relationships that are part of the model and which are subclasses of Model Relationship. Implicit Relationships are derived from the explicit relationships by aggregating them along the containment tree. The static analysis of object-oriented system has limitations. One of them is that some dependencies cannot be unequivocally resolved. In the presence of a method that is defined in a base class and overridden in the subclasses it is impossible to know by static analysis to which of the classes a method call will be directed. The decision will be taken by the model extractor. Whatever the decision, the relationships that are extracted by the extractor will be modeled in the hierarchical graph with explicit relationships. 3. Interactive Exploration The UI of Softwarenaut contains three linked complementary visual perspectives that present information about a system during the exploration. The linked perspectives support the “overview first, zoom and filter, and details on demand” architecture for information visualization tools proposed by Shneiderman [13]. Figure 4 presents Softwarenaut during an analysis session on ArgoUML. The three complementary views that the tool provides are highlighted in the figure:
6
The Architectural View
The Inspector Panel
1 2 4 3
The Overview Panel
Figure 4: The three linked views present complementary perspectives on a software system. In this case the analyzed system is ArgoUML
The Architectural View is Softwarenaut’s graph-based representation of modules and their relationships. The nodes in the graph represent modules and the edges represent the relationships between the modules, relationships extracted from the static analysis of the system. Each edge in the graph is an aggregation of low-level relationships between the two associated modules. The tool enables the visualization of a graph with various degrees of visual detail. Figure 5 shows three levels of visual detail2 : (a) the leftmost diagram presents a dependency graph as simple nodes and edges; (b) the middle presents a polymetric view [16] in which the width of a dependency is proportional to the number of abstracted explicit 2
The tool also implements other levels of visual detail. Section 6.3 presents the way one can extend the tool with new representations for modules.
7
relationships, and the size of a module is proportional to its size; (c) the rightmost diagram presents a modified treemap layout which shows all the contained submodules and classes inside a module.
Figure 5: The tool visualizes a graph with different degrees of sophistication. Left: simple nodes and edges; Middle: polymetric view; Right: a modified treemap view
The Inspector panel presents details for an entity selected in the Exploration panel. The goal is to supplement details of the element selected in the exploration panel. The Overview hierarchy presents the entire hierarchy of a system and highlights the modules that are visible in the exploration panel. It presents a vertical slice through a system [17], offering an orientation aid which is critical for successful navigation [18]. In Figure 4 the package tree of ArgoUML is present and on it the packages that are present in the view are highlighted in green. The subtree of the currently selected element (e.g.,uml) is highlighted in gray. In the context of Softwarenaut we consider architecture as “the fundamental organization of a system embodied in its components, their relationships to each other” [19]. The software engineering community agrees that the architecture of a complex system must be expressed through various architectural viewpoints. Softwarenaut can be used for recovering views of the physical architecture of the system. The tool assumes that the hierarchical organization of the system that is provided as input to the tool contains the architectural components of the system or at good approximations of these components. By the interactive 8
exploration of the input hierarchy various perspectives on the architecture can be extracted; we call these perspectives architectural views. This section continues by detailing the interactive techniques that support the exploration process in Softwarenaut: navigation (Section 3.1), rule-based filtering (Section 3.2), highlighting (Section 3.3), and details on demand (Section 3.4), 3.1. Navigation The dominant exploration mechanism of Softwarenaut is navigation along the vertical decomposition of the system. One starts with a very high-level abstracted view of a system and continuously refines it by using exploration operations [20]. At any given moment the set of visible nodes in the exploration view with which the user interacts constitutes the working set (WS). Initially the working set contains very few high-level nodes. As the user explores the system he transforms the working set by performing exploration operations on it and thus changes the contents of the view in the exploration view. expand A
High-level Relationships
Working Set = {A,B}
expand B Working Set = {A1,A2,B}
Working Set = {A1,A2,B1,B2}
A1 A
B
Containment Relationships
B
A
B
A2
B1
B2
A1
A2
B1
B2
CA1
CA2
CB11 CB12
CB2
CA1
CA2
CB11 CB12
CB2
mZ
B2
A
A1
mY
A2
collapse B1 and B2
collapse A1 and A2
mX
B1
B A2
A
A1
mT
mX
mY
mZ
mT
B
A1
A2
B1
B2
CA1
CA2
CB11 CB12
CB2
mX
mY
mZ
mT
Figure 6: The expand and collapse complementary operations that enable vertical navigation in the hierarchical graph
The exploration operations supported by Softwarenaut are:
9
Expand. The expand operation applied to a node of the hierarchical graph in the working set replaces the node in the working set with nodes that represent its children. Collapse. The collapse operation applied to a module in a working set removes the module and all its siblings from the view and replaces them with their parent module. Remove. The remove operation applied to a node removes that node from the working set. Group. The group operation applied to several modules in a working set removes the modules from the set and adds instead a unique new node representing the entire group. Focus On. Applied to a node, this operation removes all the nodes and relationships that are not related to a given node from the view and reorganizes the rest of the elements in the view around the node that is under focus. Zoom In. This operation removes all the other nodes from the view and zooms in into the subject node. It is different than the Expand ans is useful when expanding the node would bring too much detail into the view. It is in fact equivalent with a Filter of all the unrelated nodes and then an Expand. As the user refines the view, and moves down the vertical hierarchy of the system, he brings more and more elements into the view. He can use the Filter and Group operations on explicit sets of nodes to decrease the number of nodes displayed on screen and therefore cope with the complexity of large graphs. One type of module that benefits the user when filtered out is omnipresent modules which contribute little to the understanding of the architecture of the system, and heavily clutter the view [21]. History Operations. An important requirement for information exploration tools is keeping track of the interaction and providing undo/redo operations [13]. Very few architecture recovery tools implement this feature. We have discovered this requirement while testing an earlier version of the tool with users (see Section 7.2 for more). In its latest version Softwarenaut implements undo/redo operations. 10
3.2. Filtering In the previous section we have introduced the Remove operation which works on explicit sets of nodes. Most software architecture recovery tools offer such a filtering operation [22]. Softwarenaut implements two main categories of advanced rule-based filters for nodes and edges. 1. Low-level filters act on the hierarchical graph itself. They remove from the hierarchical graph the elements that match a given condition, e.g., all the invocation relationships that go to polymorphic classes. 2. High-level filters act on the high-level elements and relationships between them in the working set, e.g., hiding all the high-level dependencies that abstract only a few low-level dependencies. During exploration, the user needs mostly the high-level filters. There are three types of filters that apply to both artifacts and relationships: Metric-based filters for entities and relationships are defined with respect to the metrics computed for artifacts. For example filtering out the weak dependencies or the small modules3 in a view. The graph presented in Figure 4 contains only relationships that abstract more than 50 lowlevel dependencies. Type-based filters for entities and relationships are defined with respect to the type of the artifacts. For example showing only inheritance relationships or hiding all the classes from a view. The graph presented in Figure 4 presents only invocation relationships and filters out any other type of relationship. Evolutionary filters are defined based on the historical evolution of a module or an inter-module relationship in the system4 . For example showing only the relationships that existed in all the versions of a system, hiding all the unstable relationships [23], or displaying only the modules that were introduced in the last version of the system.
3
These are threshold-based high-pass filters Evolution-based filters require models of multiple versions of a system loaded. We talk more about them in Section 4 4
11
3
1
2
Figure 7: The UI for applying relationship filters in Softwarenaut
Softwarenaut also implements filters that work only for relationships. One such example is Directional filters which are defined based on the direction of the relationship between two modules. For example, filtering out the unidirectional relationships from a view is useful for highlighting the modules that have mutual dependencies; these might be candidates for refactoring as mutual dependencies prevent an organization of the system based on layers. The border in Figure 7 highlights the relation filtering panel in Softwarenaut in which one can select and combine filters that apply on relationships. The user can also define new filters by writing simple scripts in Smalltalk. Once a new filter is defined, it is immediately available for use. Several filters can be combined to obtain more expressive ones. The elements that match the filter can be either “shown” or “hidden”. 12
In the figure the current active filter is [Strength] Average which displays in the architectural view only the high-level relationships which have a strength greater than a given threshold. This is useful since after expanding the uml module in Figure 4 the number of nodes in the view tripled and the number of relationships grew even more. The filter allows focusing on the important relationships first. 3.3. Highlighting Highlighting is a query, like filtering, which does not remove the elements from the view. One can highlight based on pattern matching in the names of the entities (e.g., all the classes that nave “Test” in their name) or based on structural properties of the code (e.g., all the classes that define the Main method). When the modules are represented with a modified treemap view the user can see all the classes in the system at once and map various metrics on the color of the classes. In Figure 7 the color intensity of a class is proportional to the FANOUT of that class. With such a view one can discover the hot spots of the system. In the ArgoUML case study the figure shows two classes which stand out: the ProjectBrowser (labeled 2) and the UmlDiagramRenderer (labeled 3); the first is the main window of the application and the second is a Factory for figures representing UML elements. 3.4. Details-on-Demand The elements of every architectural view in Softwarenaut are nodes representing modules and edges representing relationships between them. To understand such a view the user needs to understand the role of the nodes and the meaning and reason for the existence of the edges. Metaphorically, if the view was a phrase, the nodes would be the nouns and the edges would be the verbs. One can understand the message only when one has understood all the nouns and the verbs. The Inspector panel enables the analysis of individual elements in an architectural view. When one artifact is selected in the architectural view the available inspectors are loaded as tabs in the Inspector panel. There are different inspectors for modules and relationships. 3.4.1. Inspectors for Modules The modules presented in the architectural view are abstractions of large number of elements. The inspectors for modules have the responsibility of 13
shedding light on the role of a module in a system. There are two types of module inspectors: • Inspectors that detail the internals of a module. They summarize the contents of a module or present them in a more detailed form than is possible in the architectural view. The Class Metrics inspector shows metrics for all the classes contained in a module and its submodules. The left part of Figure 8 presents the Class Metrics inspector for the cognitive module5 . The module abstracts 73 classes and for each the view displays the number of methods (NOM). Some of the largest classes in the module are: ToDoList, Designer, ToDoItem. The names of the classes reveal the functionality of the module: providing cognitive support for task management. • Inspectors that detail the interaction of a module with the rest of the system. Such inspectors summarize the relationships of a module. They are required since the architectural views only present individual relationships between pairs of modules and although these individual relationships can be inspected there is no way of analyzing all of them at once. The Module Interface inspector presents a dependency matrix between the classes from the module (rows in the matrix) and the other modules in the architectural view (columns in the matrix). The cells in the matrix have the color shade proportional to the number of dependencies. The right part of Figure 8 presents the Module Interface for cognitive. The first observation is that some of the classes are widely used by the other modules (e.g., the Designer and ToDoItem) while others are only used by one of the modules (e.g.,Critic). The second is that only 28 of all the 73 classes are used by the other modules in the system; of these 28 about half are used rarely as the white coloring of the matrix cells show. 3.4.2. Inspectors for Relationships The relationships presented in the architectural view represent collections of low-level relationships. The relationship inspectors provide support for understanding them. They are important since understanding the relationships 5
The module is labeled (1) in Figure 4
14
Figure 8: Two Inspectors: The Class Metrics (left) and the Module Interface (right) present two complementary aspects of the cognitive module from ArgoUML
is critical for understanding an architectural view. Softwarenaut provides a broad and extensible set of inspectors for relationships [24, 23] and to our knowledge is the only architecture recovery tool to provide such a feature. The two main roles of relationship inspectors are: Detailing the structure of a given relationship. The architectural relationships hide many low-level relationships between classes in the two involved modules. The user might be interested to start browsing the entities involved in the relationship either from the client module or from the provider module. To support this two complementary views are available: the Invoked Artefacts and the Invoking Artefacts inspectors present the artifacts respectively in the target and source modules. Figure 9 presents the Invoking and Invoked Artefacts inspectors for the 15
dependency between uml to ui (labeled (2) in Figure 4). The left panel contains more than 200 classes that depend on the 37 classes in the right panel. The class that has the largest number of incoming invocations is expanded to show the distribution of these invocations across its methods: the most called method is getInstance. In ArgoUML the TargetManager is a Singleton that represents the element currently selected by the user; therefore a wide range of actions need to act on it.
Figure 9: The Invoking and Invoked Artifacts (left and respectively right) inspectors provide details on the dependency from uml to ui in ArgoUML
Providing information about the evolutionary dynamics of a relationship. The Relationship Evolution Filmstrip inspector presents the evolution 16
of the given relationship in all the versions of the system that are available for analysis. Figure 11 presents such a view: the two modules and the associated relationship are represented in every analyzed version with metrics providing information about the dynamics of the relationship. Section 4 presents more details about the Evolution Filmstrip while discussing evolutionary aspects of the tool. 4. Evolutionary Analysis Softwarenaut can take evolutionary information into account to provide advanced inspectors, history-enabled filters, and highlighters. To support multi-version analysis Softwarenaut requires that models of multiple versions of the system under analysis be available. Figure 10 shows how a system history in Softwarenaut is composed of a list of hierarchical graphs, one for each analyzed version. This approach is conceptually the same as that of Gˆırba [25]. One limitation of such an approach is that the memory requirements are linear to the number of versions and both importing and keeping multiple such models in memory can be inefficient. As a result one needs a strategy for selecting the versions that compose the history.
Name-based Entity Matching
Hierarchical Graph 1
Version 1
Hierarchical Graph 2
Version 2
Hierarchical Graph i
Version i
Hierarchical Graph n
Version n
System History
Figure 10: In multi-version analysis each version considered has a corresponding hierarchical graph
To monitor the evolution of the individual elements through multiple versions one needs to link the corresponding elements in the different versions. In the literature this is known as the problem of entity identity: having two entities at two different moments of time, how do we know whether they 17
are two versions of the same entity. This problem can also be found in the literature under the name of origin analysis [26]. The most common way to recover the identity is by the name of the entity, that is, if we have two entities with the same name and the same type in two versions, then they are considered to be two versions of the same history. One limitation of this approach is that it fails to recognize rename refactorings. In the following section we show examples of inspectors and filters that take advantage of the available multi-version analysis. 4.1. Evolutionary Inspectors for Relationships One of the applications of multi-version analysis is the Relationship Evolution Filmstrip [23]. The Filmstrip is an inspector which presents the evolution of a given relationship between two modules over the time.
Figure 11: The Relationship Evolution Filmstrip presents the evolution of a given relationship through the multiple versions of the system available for analysis.
Figure 11 presents the evolution filmstrip for the relationship between uml and kernel (labeled (3) in Figure 4). In the film strip, the arrows between the modules represent implicit dependencies of different types (the invocation dependencies are represented in black and the inheritance dependencies 18
are represented in red). The width of the dependency arrows is proportional to the number of low-level dependencies abstracted in the corresponding implicit dependency [23]. The representation of the width of the dependencies provides insight into the quantitative dynamics of the inter-module relationship. In Figure 11 we see that in the initial version the dependency was unidirectional from uml to kernel. Later a reverse dependency is introduced from the Project and ProjectManager classes which accesses a few functionalities in the uml package. 4.2. Evolutionary Inspectors for Modules The Module Evolution Filmstrip presents the evolution of a given module when multiple versions of the system are loaded. Figure 12 presents an example. The versions of the module are presented chronologically from top to bottom. Each version is represented with a treemap layout in which the classes are visible inside the module and each class is proportional to its size measured in lines of code. In each version evolutionary deltas related to the previous version are highlighted: the classes that are new in that version of the module with respect to the previous one are highlighted with yellow; the classes that are modified with blue and the intensity of the color is proportional to the amount of changes – the more a class has changed with respect to its previous version, the darker its shade of blue. In Figure 12 one can see that in the version of ArgoUML from 2003 (the top version) there are only two classes that form the persistence module6 and they disappear by the version in 2005 (the second version from the top), as it is implied by the fact that all the classes in the next version are coloured in yellow. By inspecting the names of the classes in the first version (DBReader and DBWriter) we conclude that they are responsible for interfacing with the database. By inspecting the names of the classes that are in the next version (e.g.,XMIParser or XMLInputStream) we conclude that the new classes are responsible for file serialization. 4.3. Evolutionary Filters Filters for relationships and modules are a powerful mechanism for coping with the large graphs that some systems entail. They display only those 6
The persistence module is labeled (4) in Figure 4
19
Figure 12: The evolution of the persistence module in ArgoUML shows that the system migrated from a database serialization policy to a file-based one between 2003 and 2005
elements in an architectural view that are important for a given task and thus focus the analysis. Evolutionary filters for both relationships and entities can be classified in two main categories: Age-based filters take into account the number of versions in which the relationships or modules existed in the system. Lifetime relationships have existed in all the versions of the system, Newborn relationship have appeared only in the last analyzed version [23], Historical modules have existed since the first analyzed versions of the system. Dynamics-based filters take into account the dynamics of the relationships and modules across versions. Stable relationships do not change much during the evolution of the system, Unstable relationships change frequently during the history of the system. 20
Figure 13: The left part of the figure shows all the relationships while the right part presents only the lifetime relationships between the ArgoUML modules from Figure 4
Evolutionary filters assume that not all the entities are equally relevant for the task at hand. Different types of evolutionary filters support different goals of analysis. Two such goals, and their corresponding filters are: 1. Architecture Recovery. When recovering the architecture of a system one needs to discover first the main components of the system. A filter like lifetime relationships is relevant since the relationships that existed in the system since the first versions are more likely to be part of the architectural backbone of the system. 2. Quality Assessment. When assessing the maintainability of an architecture the goal is to find the problems, the irregularities. In this context filters like newborn relationships are of use since they focus on new relationships that were were not validated by time which might be the result of changes performed by new developers who are unaware of the architecture of the system. Figure 13 presents two views on the same modules that are also present in Figure 4 first without any relationship filters and second with age-based filters activated. The left side contains 47 relationships. The right side contains
21
only the lifetime relationships: 22 relationships that existed between the displayed modules in all the versions of the system. The usefulness of the filters is hinted by the fact that in the second view the number of relationships is low compared with the total number of relationships that are present in the last version of the system; thus age-based filters can function as mechanisms for reducing the information overload. A more in-depth study on the power of age-based filters as information reducers is found elsewhere [23]. 5. Collaboration Through First-Class Views Traditionally software analysis tools were designed with a analysis-inone-sitting attitude in mind. One was supposed to start the analysis, arrive at some results, and then discard all the data such that if he had to start again, he would start from scratch. In Softwarenaut we want to enable the interruption and continuation of the analysis, and the reuse of the results of the analysis between sessions. Moreover, traditional software analysis never reuses the information that one user has gained about a certain version of the system when another user analyzes the same system. This is unfortunate since once published a version of a system never changes and therefore the results of one analysis can contribute to further analyses. In Softwarenaut these two problems are addressed with the help of first-class views and the concept of a Global View Repository, a service for sharing recovered architectural views. 5.1. First-Class Views The designers of a system use multiple diagrams for the specification of the architecture of a system. In the same way, during architecture recovery they need to recover multiple views to capture various aspects of the structure of the system. Views are first-class entities in Softwarenaut: one can save and restore any view during the exploration. During an exploration session, each time the analyst encounters a view that presents a relevant perspective on the system he can save it for later reference or for sharing with others. The result of a Softwarenaut analysis session is therefore a set of architectural views. The view persistence mechanism can be used also as a way of conquering the complexity of top-down exploration. When the architectural view under 22
analysis becomes too complex, the user can save it and then explore different sub-parts of it. This is addressed partially in other tools by the use of semantic zooming techniques [12]. In Softwarenaut a view is defined by the following information: • a name and description, • the name and version of the system under analysis • the current working set with the positions of all the nodes in it, • the active artifact and relationship filters (both explicit and rule based), • the name of the creator of the view The model of the system is not saved together with the view. We assume that model construction is deterministic and the name and version of the system will suffice for model reconstruction at a later time 7 . 5.2. Sharing and Discovering Architectural Views Once published, a given version of a system never changes. Therefore all the analysis results regarding that version should be made public so that other users can discover previous results and corroborate their findings. In the context of architectural view recovery this means discovering architectural views that others have previously recovered. To support sharing and discovering architectural views we have created the Global Architectural View Repository (GVR) – a public repository that indexes architectural views. Figure 14 presents the concept behind the GVR through a simplified example. While analyzing system Z, users A and B publish views v1 and v28 . When later user M analyzes the same system, he can already benefit from the previous knowledge by discovering the views that users A and B have published. In the future, the architectural views as saved in the GVR can serve as the basis for monitoring the architectural evolution of the system. After the publication of a new version of the system, Softwarenaut would automatically 7
This requires nevertheless a way of uniquely identifying the entities in the view. In our case, for each of the entities in the working set we save the fully scoped name 8 The publish(v1, Z) notation means publishing to the GVR the view v1 for system Z
23
User A analyzing System Z
publish(v1, Z)
publish(v2, Z)
Global View Repository (GVR)
retrive(Z) v1,v2
User M analyzing System Z
User B analyzing System Z
Figure 14: Architectural Views are stored in the Global View Repository. This enables collaboration through knowledge sharing and discovery
detect the views affected by the new changes, and present a visual diff which would make explicit the differences between the state of the system at the moment when the view was created and the latest system version. Figure 15 presents the UI which is responsible with the interaction with the architectural views in Sofwarenaut: • The top part of the inset presents the locally stored views which the user has in the image. For each of them the user can load it, delete it, or push it to the GVR. The operations are visible in the pop-up menu. • The bottom part presents the views which exist for the given system in the GVR. From the global view repository he can pull views in the local repository, or if he is the creator of such a view he can delete it from the global repository too. 6. The Architecture of Softwarenaut 6.1. Fact Extraction and Modelling At the lowest level, Softwarenaut models a system using the Core of FAMIX, a language independent meta-model for object oriented systems [27].
24
Figure 15: Views are first-class entities in Softwarenaut. They can be saved, deleted locally, but also published and retrieved from the Global Architectural View Repository.
The tool relies on third-party fact extractors (such as McC [28] or inFusion9 ) that analyze the source code and build the intermediary model. FAMIX represents both artifacts and relationships as first-class entities. The main artifacts are namespaces, packages, classes, attributes, methods, fields. The main relationships between these entities are method invocations, variable accesses, class inheritances, and package include relationships [27]. A class of relationships that have a special importance in Softwarenaut are the containment relationships which organize a software system into a vertical hierarchy: classes contain methods, modules contain classes, systems contain modules. This containment mechanism is a conventional way of coping with the complexity of large software systems. At an architectural level, different languages provide different mechanisms for the hierarchical organization of the system. C/C++ developers use the directory structure to organize systems hierarchically; Java developers use the package hierarchy; Smalltalk developers use the bundles hierarchy, etc. When 9
See http://www.intooitus.com/inFusion, verified Jan 25 2011.
25
a hierarchical decomposition is not provided, we can automatically generate one using clustering techniques [29]. We presented elsewhere an experiment in clustering the classes in a system based on language similarity[30]. 6.2. Integration with the Moose Analysis Platform Softwarenaut is integrated in the Moose Analysis Platform [31]. Softwarenaut reuses several of the views defined in Moose for its inspectors (e.g., the inspectors that show entity metrics). Also, since behind any visual element of Softwarenaut lays a TreeNode object which wraps often a FAMIX entity (e.g., FAMIXPackage or FAMIXClass) the user can spawn other Moose analyses by selecting any of the elements of a Softwarenaut architectural view. At the same time, any tool in the Moose platform can spawn a Softwarenaut architectural analysis on any group of entities which have containment relationships and dependencies between themselves. 6.3. Mechanisms for Tool Extension Many of the features of the tool are discovered at run-time through reflection so that that all one needs is to know the extension points. Here we give examples of several of the features that are loaded reflectively together with the rules by which they are discovered. Inspectors for Modules and Dependencies. In order to provide a new inspector for a module or a relationship one needs to implement a subclass of Inspector which implements three messages: canDisplay: anObject, tabName and display: anObject. The first message tests whether the inspector can display a certain object, the second gives the name of the view, and the third actually displays the object. Figure 16 shows the implementation of the first two methods in the Relationship Filmstrip10 . Filters for Modules and Dependencies. In order to provide a new filter one needs to add a new method in the corresponding filter class (NodeFilter or DependencyFilter) and annotate it with the filter annotation. Figure 17 shows the code for the definition of the newborn relationships – these are relationships that have a history of size one (line 5) and their last version is not empty (line 6). Line 1 shows the annotation. 10
The examples are in Smalltalk
26
RelationshipFilmstrip>>canDisplay: anObject 1: ^(anObject isKindOf: SN.DependencyCollection) 2: and: [anObject history notNil] RelationshipFilmstrip>>tabName 3: ^'Relationship Evolution Filmstrip'
Figure 16: Two methods enable the runtime discovery of inspectors
DependencyFilter>>isNewborn 1: 2: ^ShallowDependencyFilter 3: name: 'Newborn' 4: block: [:dep| 5: (dep nonEmptyVersions size = 1) 6: and: [self versions last notEmpty]]
Figure 17: Annotating methods in the Filter classes enables run-time discovery
Module Representations. In order to provide a new method for representing a module one needs to subclass the ModuleFigureBuilder class and implement the moduleFigureFor:withBounds: message in his new class. The method receives the object it is supposed to draw together with the rectangle in which it has to fit the visual representation of the object. 6.4. Softwarenaut Synergies One of the tools that benefits from the Global View Repository is the Small Project Observatory (SPO), an ecosystem analysis tool that we have introduced elsewhere [32]. SPO works at an abstraction level above the architectural level of individual systems: the ecosystem abstraction level [33]. SPO needs to support navigation between the two abstraction levels to support the understanding of the ecosystem abstraction level. When navigating from the ecosystem abstraction level down to the architectural level SPO must present architectural views of the individual systems. When they are available, the architectural views of the individual systems are obtained from the Global View Repository. SPO can therefore reuse architectural information generated with Softwarenaut. In a collaboration with the researchers at UC Irvine we have integrated the tool with the Sourcerer database [34]. Softwarenaut has now a broad 27
Figure 18: SPO imports architectural views saved in Softwarenaut
range of available case-studies while the database can benefit from the analysis services of Softwarenaut. The integration with the SourcererDB was eased by the service based architecture of Sourcerer and intermediated by the FAMIX meta-model. 7. Tool-Building Considerations In this section we discuss several aspects related to tool-building in research. We touch usability, the integration in the broader research ecosystem, and using the tool as a testbed for research. 7.1. The Tool as a Vehicle for Research Softwarenaut served as the prototype for many of the research ideas we had during the PhD of the first author. We have integrated the tool with others [35, 36, 31] and we provided a framework in which master projects can be developed [37]. The tool was the basis for a number of research papers: • Package Patterns for Architecture Recovery [38]: This article provides a classification of software packages based on their interaction with the rest of the system. We used Softwarenaut to explore multiple systems and discover these patterns.
28
• Exploring Inter-Module Relationships in Software Systems [23]: This article presents a taxonomy of inter-module dependencies in software systems based on their evolution patterns. • Interactive Exploration of Semantic Clusters [35]: This article proposes a technique for visualizing dendrograms of software systems using an exploration approach. In order to be able to visualize dendrograms resulting from hierarchical clustering we had to adapt our model. • Cutting Edge Visualization in Software [24]: This short article argues for the importance of providing detail views that enable one to understand dependencies in software. • Automatic remodularization. One of the extensions built on top of Softwarenaut is MARS, an automated architecture refactoring recommender tool [37]. It starts from a given Softwarenaut view and checks whether move operations applied on classes can improve the architecture of the system by increasing coupling and decreasing cohesion. 7.2. Studying the Usability of the Tool We have often used Softwarenaut to analyze Softwarenaut itself, and this has determined several re-architecting sessions as well as UI improvements. We also used the tool in the practical part of the Software Evolution master course at the University of Lugano to test its usability and usefulness. In the second year of using the tool in the Software Evolution course we decided to have an exploratory study to evaluate the usability and usefulness of the tool. We asked the students to analyze a large software system they have never seen before with the help of Softwarenaut and to produce an architectural report. Our main goal in organizing the experiment was to get feedback on the usability of the tool; our secondary goal was to collect anecdotal evidence on its usefulness for architecture recovery. Eight users, one PhD and seven master students participated in the experiment. We presented the tool during one hour. Then the users had two hours to perform the tasks presented in Table 1. The case study was ArgoUML. They worked in teams of two, and provided us with a report of their findings. After finalizing the report, they answered a questionnaire on the usability of the tool. By analyzing their reports we observed several things:
29
• In several of the tasks (1–3) each of the teams provided a slightly different perspective on the system. The differences were in the layouts they used, in the filtering they applied. Each one captured a certain aspect of the system. Unfortunately at the time there was no way for them to share the views with each other and discuss them. • Some of the tasks were not solved by all the teams (4–5,8). One reason was the insufficient training with the tool, another reason were the usability limitations of the tool at the time of the experiment. • For one of the tasks (8) the tool was not sufficient and they had to rely on the online documentation of the analyzed system. • For the questions regarding dependencies (4,8) all the users preferred the tool to reading the code or online documentation. The first part of the usability questionnaire contained several assertions. The users had to mark the strength of their agreement with each assertion on a scale from 1 to 5. Table 2 presents the assertions together with the average agreement level. Although not statistically relevant the results show that the tool was easy to use, the participants felt confident that the results they provided were reliable.There was less agreement on whether the user interface was intuitive and whether ArgoUML was an appropriate case study.
1 2 3 4 5 6 7 8
Task Discover one or more architectural views on the system which present modules and their interactions Is there a subset of the modules that you consider to be at the core of the system? Is there a core module in the system? Why? How does it interact with the others? Choose one inter-module dependency in the system and analyze it. What is the reason for its existence? Choose one other module in the system. Analyze its interface. Are there cases in which two modules depend on one another that you would have not expected from the conceptual architecture? Overall what do you think about the structure of the system? Is it well modularized? You want to add support for generating code in a new language. Which module do you change? Which others are impacted? How much time do you need? Table 1: The eight tasks the participants had to solve in two hours.
30
We believe that these two last answers were due to the limited time they had at disposition. Assertion The tool was simple to use The user interface was intuitive The results generated were reliable Was ArgoUML a good choice for a case study?
Agreement Level (average) 4 3.25 4.5 3
Table 2: Answers to the questions regarding the tool usability
The second part of the usability questionnaire consisted of open questions. We first asked the participants what were the capabilities of the tool that they found the most useful during their analysis. Two of the teams answered with ”all the features we have used” and ”many features, you can do a lot”. Table 3 shows that the others were content with the dependency analysis and the exploration operations. Feature Showing dependencies between modules The exploration operations Filters Inspectors
Supporters (2 teams) (2 teams) (1 team) (1 team)
Table 3: The features that the users considered the most useful
We finally asked what were the features that they thought were missing from the tool. Table 4 shows that the most desired features were smart filters, arbitrary groupings and history operations. We had used these results to inform our work on future versions of the tool. Many of these features are included in the tool and have been presented in this article while some are still on the backburner. 11 11
One usability problem which, although not on the list of our participants, we are aware of is the fact that when too many nodes are expanded the view becomes to busy to be useful. We have observed that effect depends heavily on the structure of the system that is being analyzed.
31
Feature User defined filters (all incoming dependencies, all outgoing dependencies, dependencies weaker than...) Arbitrary grouping of items (selected items, classes whose name matches a certain pattern, orphan classes) Undo and Redo operations Selecting edges (multiple edges, all outgoing edges) View persistence
Requesters (3 teams) (3 teams) (2 teams) (2 teams) (1 teams)
Table 4: The features that the users considered were missing
This has been an early exploratory study with few participants and we cannot claim that the results generalize. In the future we plan to organize a controlled experiment to evaluate both the usefulness of the tool for the purpose of architecture recovery as well as its usability. 7.3. Depending on Other Research Prototypes Depending on other research prototypes and platforms has been a benefit because we had the opportunity of using cutting edge technology and building on the shoulders of giants. In the same time it made our life harder since the tools that we depended on kept moving “under our feet” and at times they were not maintained anymore. For example during the development of the tool the Moose framework was ported from VisualWorks Smalltalk to Pharo Smalltalk for license reasons. Together with this the FAMIX 2.1 meta-model was replaced with the 3.0 version. This introduces a small compatibility issue between the tools that work in Pharo and VisualWorks. Since until now we did not have the engineering effort required to port all our code to Pharo we remained dependent on the VisualWorks Moose version. A totally different problem is when one depends on a web service. There one cannot shield oneself from the changes on the other side. Recently the SourcererDB went through a database upgrade: for some time the Softwarenaut users did not have access to the large pool of case studies. This might not be a unique experience, but it is a reminder that when building research prototypes that relies on other research prototypes one needs either to shield oneself from changes upstream or to be ready to constantly adapt to the changes. We believe that the best strategy is a combi32
nation of both and that the benefits of being part of a research ecosystem outweigh the difficulties. 7.4. Availability and Documentation Softwarenaut is written in Smalltalk and is released under the open source MIT License. The tool runs on Windows, Linux, and OS X and is available online at http://scg.unibe.ch/softwarenaut/. The homepage of the tool provides screencasts, documentation, installation instructions, and directions on how to obtain the source code and to contribute. The Global Architectural View Repository (GVR) is implemented as a PostgreSQL database which can be publicly accessed by instances of Softwarenaut or other tools. The online documentation provides more informations about ways of accessing the GVR. 8. Related Work There is an extended tradition of architecture recovery tools in software engineering research. Pollet et al. have presented a comprehensive overview of the work in architecture recovery in their survey article [3]. In this section we take several of the core aspects of Softwarenaut and we discuss how they are similar and how they differ from other state of the art tools. 8.1. Exploration and Navigation The first architectural visualization tool was Rigi, which emphasizes visualization and interaction [39]. Rigi visualizes the data as hierarchical typed graphs and provides a Tcl interpreter for manipulating the graph data. The reconstruction process is based on a bottom-up process of grouping software elements into clusters by manually selecting the nodes and collapsing them. The approach does not scale well when analyzing very large systems . In Softwarenaut we automatically aggregate low-level relations and let the user navigate down from the highest abstraction level. The SHriMP tool [12] and its Eclipse-based continuation Creole [40] display architectural diagrams using nested graphs. Their user interface embeds source code inside the graph nodes and integrates a hypertext metaphor for following low-level dependencies with animated panning, zooming, and fisheye-view actions for viewing high-level structures. Relo [41] provides an exploration approach in which a users starts with a given artifact and explores further on an as-needed basis. One difference between SHriMP, Creole, Relo and Softwarenaut is that the latter can also perform evolutionary analysis. 33
8.2. Evolutionary Analysis YARN [42] animates the evolution of dependencies between the modules of a system. We represent evolution by building complete models of several system versions (just like CodeCity) while YARN uses an evolutionary model and analyze the information in each commit. The disadvantages of YARN is that watching an animation can be time-consuming and it does not support interactive exploration operations such as filtering. CodeCity of Wettel [43] visualizes software systems using a city metaphor and also provides visualizations of the evolution of the systems. The main advantage of our approach over Wettel’s is the fact that we present relationships while he does not. Pinzger proposed the ArchView approach [44] which provides visualizations that present the evolution of the modules in a system. His evolution analysis takes into account the annotations from the versioning system repository. However, there is no support for first-class views in ArchView and the dependencies between the modules are only based on logical coupling. One of our original contributions is the possibility of filtering information in the view based on its historical properties. One related study is the one of Wierda et al. who recover the architectural decomposition of a system through clustering; they observe that if they use for clustering only those dependencies that were in the system in both the first and the last versions, the decompositions are more precise [45]. This observation supports our idea of considering the lifetime relationships as more relevant for the architecture than the newer relationships. 8.3. Collaboration Shrimp, the tool of Storey et al., also allows for saving and restoring views [46]. The views are saved inside a “Filmstrip” which is persistent. Through the intermediation of the filmstrips the users can restore exploration sessions or even share certain views. This type of information enables people that know about each other to share information by emailing the files. The advantage of the Global View Repository is that it allows information that other users have discovered to be shared. Churrasco [47] supports software visualization and analysis and through a web interface. This allows different users to annotate the diagrams and thus allows a dialogue to be formed around the online visualizations. Churrasco presents high-level visualizations but it does not provide dependency information which we consider critical for architectural understanding. 34
Proposed by Hattori et al., Replay [48] enables the chronological replay of changes inside the Eclipse IDE and supports awareness of team member activity by allowing one to selectively replay the changes of other team members. The information in Replay is more fine-grained than ours and is never aggregated to the abstraction level of the architecture. One project developed with collaboration support as the main goal is the Jazz IDE of IBM [49]. Jazz aims at supporting collaboration and awareness in small informal software development teams during forward engineering. Softwarenaut aims to support collaboration between engineers during program understanding although recovered architectural views can be used to support awareness during forward engineering. 9. Conclusions and Future Work We presented Softwarenaut, our tool for architecture recovery. Softwarenaut enables the recovery of architectural views from a software system through interactive exploration of a hierarchical decomposition of the system. It supports the “overview first, zoom and filter, and details on demand” principle of information visualization and it provides features that are required from architecture recovery tools: rule-based filtering mechanisms, history operations, interactive exploration, and detailed views for modules and relationships. Two of the original features of the tool are the capacity of saving and sharing architectural views in a Global Architectural View Repository and the capacity of analyzing multiple versions of a system in order to provide better filtering and interaction capabilities. We have illustrated the features of the tool and the architecture recovery approach that it supports using as a case-study ArgoUML, a successful open source Java system. The tool, released under an open-source MIT license, was the test-bed for a variety of research projects, and is still serving us in our research and consulting practice. One of our main future research directions is exploring ways in which the recovered views can be integrated in the forward engineering process and function as a live documentation of an evolving system. The Softwarenaut views are not simple pictures but instead they encode relationships between the artifacts in the system. A view recovered for a given version of the system can function as a reference point for presenting the future evolution of the system. Another direction would be overlaying architectural constraints 35
on top of the existing views and then enforcing them during the system’s evolution. Finally we plan to run controlled experiments and user studies to evaluate usefulness and usability. Acknowledgements. We would like to thank Fabrizio Perin for feedback on earlier drafts of this paper. We would like to thank the anonymous reviewers for their qualitative feedback. We would also like to acknowledge Joel Ossher and Crista Lopes from UC Irvine for the collaboration in integrating Softwarenaut with the Sourcerer database. We would also like to thank the anonymous reviewers for their constructive feedback and patience while reading the first version of this article and trying out Softwarenaut. Lanza acknowledges the financial support of the SNF through project SOSYA (SNF Project No. 132175). References [1] M. Lehman, Programs, life cycles, and laws of software evolution, Proceedings of the IEEE 68 (Sept. 1980) 1060–1076. [2] S. Ducasse, D. Pollet, Software architecture reconstruction: A processoriented taxonomy, IEEE Transactions on Software Engineering 35 (2009) 573–591. [3] D. Pollet, S. Ducasse, L. Poyet, I. Alloui, S. Cˆımpan, H. Verjus, Towards a process-oriented software architecture reconstruction taxonomy, in: R. Krikhaar, C. Verhoef, G. Di Lucca (Eds.), Proceedings of 11th European Conference on Software Maintenance and Reengineering (CSMR’07), IEEE Computer Society, 2007, pp. 137–148. Best Paper Award. [4] L. Bass, P. Clements, R. Kazman, Software Architecture in Practice, Addison-Wesley Professional, 1997. [5] P. Kruchten, The 4+1 view model of architecture, IEEE Softw. 12 (1995) 42–50. [6] C. Hofmeister, R. Nord, D. Soni, Applied Software Architecture, Addison-Wesley, 2000. [7] D. E. Perry, A. L. Wolf, Foundations for the study of software architecture, SIGSOFT Softw. Eng. Notes 17 (1992) 40–52. 36
[8] D. Garlan, R. Allen, J. Ockerbloom, Architectural mismatch: Why reuse is still so hard, IEEE Softw. 26 (2009) 66–69. [9] M. Jazayeri, On architectural stability and evolution, in: Reliable Software Technlogies-Ada-Europe 2002., Springer, 2002, pp. 304–315. [10] G. Murphy, D. Notkin, K. Sullivan, Software reflexion models: Bridging the gap between source and high-level models, in: Proceedings of SIGSOFT ’95, Third ACM SIGSOFT Symposium on the Foundations of Software Engineering, ACM Press, 1995, pp. 18–28. [11] H. Muller, K. Klashinsky, Rigi: a system for programming-in-the-large, Software Engineering, 1988., Proceedings of the 10th International Conference on (1988) 80–86. [12] M.-A. D. Storey, H. A. M¨ uller, Manipulating and documenting software structures using SHriMP Views, in: Proceedings of ICSM ’95 (International Conference on Software Maintenance), IEEE Computer Society Press, 1995, pp. 275–284. [13] B. Shneiderman, The eyes have it: A task by data type taxonomy for information visualizations, in: IEEE Visual Languages, College Park, Maryland 20742, U.S.A., pp. 336–343. [14] K. Gallagher, A. Hatch, M. Munro, Software architecture visualization: An evaluation framework and its application, IEEE Transactions on Software Engineering 34 (2008) 260–270. [15] A. L. Buchsbaum, J. R. Westbrook, Maintaining hierarchical graph views, in: Proceedings of the eleventh annual ACM-SIAM symposium on Discrete algorithms, SODA ’00, Society for Industrial and Applied Mathematics, Philadelphia, PA, USA, 2000, pp. 566–575. [16] M. Lanza, S. Ducasse, Polymetric views - a lightweight visual approach to reverse engineering, Software Engineering, IEEE Transactions on 29 (2003) 782–795. [17] K. Wong, The reverse engineering notebook, Ph.D. thesis, University of Victoria, Victoria, B.C., Canada, Canada, 2000.
37
[18] M.-A. D. Storey, D. Cubrani´c, D. M. German, On the use of visualization to support awareness of human activities in software development: a survey and a framework, in: SoftVis ’05: Proceedings of the 2005 ACM symposium on Software visualization, ACM, New York, NY, USA, 2005, pp. 193–202. [19] I. S. 1471-2000, IEEE Std 1471-2000. IEEE recommended practice for architectural description of software-intensive systems., IEEE Architecture Working Group, 2000. [20] G. G. Robertson, J. D. Mackinlay, S. K. Card, Cone trees: animated 3d visualizations of hierarchical information, in: CHI ’91: Proceedings of the SIGCHI conference on Human factors in computing systems, ACM Press, New York, NY, USA, 1991, pp. 189–194. [21] B. S. Mitchell, S. Mancoridis, On the automatic modularization of software systems using the bunch tool, IEEE Trans. Softw. Eng. 32 (2006) 193–208. [22] I. Aracic, T. Schaeffer, M. Mezini, K. Osterman, A Survey on Interactive Grouping and Filtering in Graph-based Software Visualizations, Technical Report, Technische Universit¨at Darmstadt, 2007. [23] M. Lungu, M. Lanza, Exploring inter-module relationships in evolving software systems, in: Proceedings of CSMR 2007 (11th European Conference on Software Maintenance and Reengineering), IEEE Computer Society Press, Los Alamitos CA, 2007, pp. 91–100. [24] M. Lungu, M. Lanza, Softwarenaut: cutting edge visualization, in: SoftVis ’06: Proceedings of the 2006 ACM symposium on Software visualization, ACM, New York, NY, USA, 2006, pp. 179–180. [25] T. Gˆırba, Modeling History to Understand Software Evolution, Ph.D. thesis, University of Berne, Berne, 2005. [26] G. Antoniol, M. Di Penta, E. Merlo, An automatic approach to identify class evolution discontinuities, in: IWPSE ’04: Proceedings of the Principles of Software Evolution, 7th International Workshop, IEEE Computer Society, Washington, DC, USA, 2004, pp. 31–40.
38
[27] S. Tichelaar, Modeling Object-Oriented Software for Reverse Engineering and Refactoring, Ph.D. thesis, University of Bern, 2001. [28] P. F. Mihancea, G. Ganea, I. Verebi, C. Marinescu, R. Marinescu, Mcc and mc#: Unified c++ and c# design facts extractors tools, Symbolic and Numeric Algorithms for Scientific Computing, International Symposium on 0 (2007) 101–104. [29] R. Koschke, Atomic architectural component recovery for program understanding and evolution, Software Maintenance, 2002. Proceedings. International Conference on (2002) 478–481. [30] M. Lungu, A. Kuhn, T. Gˆırba, M. Lanza, Interactive exploration of semantic clusters, in: 3rd International Workshop on Visualizing Software for Understanding and Analysis (VISSOFT 2005), pp. 95–100. [31] O. Nierstrasz, S. Ducasse, T. Girba, The story of moose: an agile reengineering environment, SIGSOFT Soft.Eng. Notes 30 (2005) 1–10. [32] M. Lungu, M. Lanza, T. Gˆırba, R. Robbes, The small project observatory: Visualizing software ecosystems, EST special issue of the Science of Computer Programming (2009). [33] M. Lungu, Reverse Engineering Software Ecosystems, Ph.D. thesis, University of Lugano, 2009. [34] E. Linstead, S. Bajracharya, T. Ngo, P. Rigor, C. Lopes, P. Baldi, Sourcerer: mining and searching internet-scale software repositories, Data Mining and Knowledge Discovery 18 (2009) 300–336. 10.1007/s10618-008-0118-x. [35] M. Lungu, A. Kuhn, T. Gˆırba, M. Lanza, Interactive exploration of semantic clusters, in: 3rd International Workshop on Visualizing Software for Understanding and Analysis (VISSOFT 2005), pp. 95–100. [36] M. Lungu, M. Lanza, T. Girba, R. Robbes, The small project observatory: Visualizing software ecosystems, Science of Computer Programming, Elsevier 75 (2010) 264–275. [37] A. Boeckmann, MARS - Modular Architecture Recommendation System, Bachelor’s thesis, University of Lugano, 2010. 39
[38] M. Lungu, M. Lanza, T. Gˆırba, Package patterns for visual architecture recovery, in: Proceedings of CSMR 2006 (10th European Conference on Software Maintenance and Reengineering), IEEE Computer Society Press, Los Alamitos CA, 2006, pp. 185–196. [39] H. A. M¨ uller, S. R. Tilley, M. A. Orgun, B. D. Corrie, N. H. Madhavji, A reverse engineering environment based on spatial and visual software interconnection models, in: SDE 5: Proceedings of the fifth ACM SIGSOFT symposium on Software development environments, ACM, New York, NY, USA, 1992, pp. 88–98. [40] R. Lintern, J. Michaud, M.-A. Storey, X. Wu, Plugging-in visualization: experiences integrating a visualization tool with eclipse, in: SoftVis ’03: Proceedings of the 2003 ACM symposium on Software visualization, ACM, New York, NY, USA, 2003, pp. 47–ff. [41] V. Sinha, D. Karger, R. Miller, Relo: Helping users manage context during interactive exploratory visualization of large codebases, Visual Languages and Human-Centric Computing, 2006. VL/HCC 2006. IEEE Symposium on (2006) 187–194. [42] A. Hindle, Z. M. Jiang, W. Koleilat, M. W. Godfrey, R. C. Holt, Yarn: Animating software evolution, Visualizing Software for Understanding and Analysis, International Workshop on 0 (2007) 129–136. [43] R. Wettel, M. Lanza, R. Robbes, Software systems as cities: a controlled experiment, in: Proceeding of the 33rd international conference on Software engineering, ICSE ’11, ACM, New York, NY, USA, 2011, pp. 551–560. [44] M. Pinzger, ArchView - Analyzing Evolutionary Aspects of Complex Software Systems, Ph.D. thesis, Vienna University of Technology, 2005. [45] A. Wierda, E. Dortmans, L. Lou Somers, Using version information in architectural clustering - a case study, in: CSMR ’06: Proceedings of the Conference on Software Maintenance and Reengineering, IEEE Computer Society, Washington, DC, USA, 2006, pp. 214–228. [46] D. Rayside, M. Litoiu, M.-A. Storey, C. Best, R. Lintern, Visualizing flow diagrams in websphere studio using shrimp views, Information Systems Frontiers 5 (2003) 161–174. 10.1023/A:1022649506310. 40
[47] M. D’Ambros, M. Lanza, A flexible framework to support collaborative software evolution analysis, in: Proceedings of CSMR 2008 (12th European Conference on Software Maintenance and Reengineering), IEEE Computer Society, 2008, pp. 3–12. [48] L. Hattori, M. D’Ambros, M. Lanza, M. Lungu, Software evolution comprehension: Replay to the rescue, in: Proceedings of The 19th IEEE International Conference on Program Comprehension, pp. 161–170. [49] S. Hupfer, L.-T. Cheng, S. Ross, J. Patterson, Introducing collaboration into an application development environment, in: Proceedings of the 2004 ACM conference on Computer supported cooperative work, CSCW ’04, ACM, New York, NY, USA, 2004, pp. 21–24.
41