ISTET'09
1
1,2
1
Krzysztof Siwek , Stanislaw Osowski , Konrad Garanty , Mieczyslaw Sowinski
3
Warsaw University of Technology (1), Military University of Technology (2), Andrzej Soltan Institute for Nuclear Studies (3)
Ensemble of Predictors for Forecasting the PM10 Pollution Abstract. The paper presents the novel approach to the accurate forecasting of the daily average concentration of PM10. It is based on the application of neural networks and wavelet transformation of the time series representing PM10 pollution. The main novelty of the proposed approach is the application of the ensemble of predictors, integrated using the blind source separation method or neural based integration. The numerical experiments of predicting the daily concentration of the PM10 pollution in Warsaw have shown good overall accuracy of prediction in terms of RMSE, MAE and MAPE errors. Keywords. PM10 pollution, prediction of time series, SVM, MLP, RBF
1. Introduction Air pollution is a major concern for the population in most large cities of the world. The information of the meteorological pollution, such as CO, NO2, SO2 and dust is more and more important due to their harmful effects on human health [6]. It is especially true in the urban environment of every country. One of the most important component of the pollution is the ambient particulate matter (PM) of the diameters of 10µm (PM10) and 2.5µm (PM2.5). The main source of PM is the vehicular traffic and dust of the streets generated by the circulation. These particles not only reduce the visibility but have also direct impact on human health via inhalation [1],[6],[8]. Medical studies have shown a significant correlation between the effects of atmospheric PM and amount of medical consultations by respiratory problems. Actually PM is of importance for an European policy (the EU Council Directive 1999/30/EC, 22 April 1999 defining the restriction for the yearly and 24h averages PM10 concentrations). There is a lot of papers devoted to the analysis and prediction of the concentration of PM for the next day. Many methods of prediction have been already developed [12],[6],[8-10]. Some of them use complex mathematical models relying on dynamics of environmental processes and some use the previous data to build an ad hoc statistical models, such as autoregressive linear models, neural networks or fuzzy systems. This paper will develop the methods of forecasting the daily average values of PM10 applying different forms of solution based on application of neural networks. Most papers reported up to now have developed the particular method of forecasting. We propose different strategy. Our approach is concentrated on the integration of many prediction results using ensemble of predictors. Instead of one predictor we propose to use few and combine them together to get better accuracy of the final forecast. In particular we present the prediction methods based on the direct application of neural networks and decomposition of the prediction process of time series into many simpler tasks by using wavelet transformation. These simpler prediction task are also solved by using neural predictors and combined together into the final time series. The results of these methods are put together into ensemble and integrated by using either blind source separation (BSS) technique or additional neural integration system to define the final forecast. The theoretical considerations have been supported by the numerical experiments made for the data gathered within three years in Warsaw, Poland. The results of experiments have shown that our policy of mixing different methods of predictions leads to an improved accuracy of forecasting.
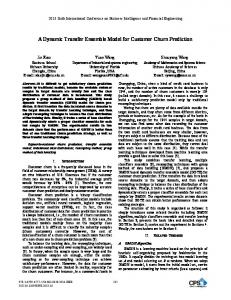
2. The analysis of the pollution dependencies In prediction of the pollution the most important are the day averaged values of PM10. They establish very useful tool for observing the trends of pollution. Their future knowledge enables the authority to warn the local population of alarming values, as well as to undertake some preventive actions [9]. The most important difficulty in prediction of the next day pollution is great change of their values from day to day. On Fig.1 we present the daily averaged time series of PM10 concentration for the considered period of observation (the years from 2005 to 2007) measured by the meteorological station situated in suburb Ursynow of Warsaw. There is a visible, large variety of the concentration of the pollutant from the day to day. The mean value of PM10 concentration 3 over this period was 33.87 µg/m , while the standard devia3 tion equal 21.18 µg/m . The large value of the standard deviation with respect to the mean is the main source of the difficulty in the accurate forecasting of this time series.
Fig. 1. The measured data of the series of PM10 concentration for three years (2005- 2007) averaged a day for one station in Warsaw
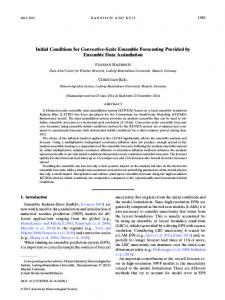
At any approach to prediction the most important are the input diagnostic features, on the basis of which the predictor will generate its forecasted output signals. So it is quite important to discover the relationship between PM10 concentration and the other meteorological parameters influencing the pollution. To the most important recognized parameters having the greatest impact on the mechanism of pollution creation are regarded the temperature, direction and strength of the wind, humidity and the air pressure. To present graphically these relations we have drawn the distribution of the measured points as a function of these parameters. Fig. 2 presents the exemplary relationships between the daily PM10 concentration and the temperature, and between the PM10 daily concentration and the strength of the wind. As it is seen the distribution of the measured points is far from any unique dependence and represents rather
318
complex relation. However we can observe quite evident principle: the higher is the strength of the wind the smaller the averaged values of pollution. Similar plots can be created for the distribution of PM10 concentration versus other parameters, like humidity and pressure. In none of these cases the unique relationship between the pollution and the atmospheric parameters can be observed as well [11].
gression mode. The SVM is a linear machine working in the high dimensional feature space formed by the nonlinear mapping of the n-dimensional input vector x into Ldimensional feature space (L>n) through the use of the kernel function K(x,xi) satisfying the Mercer conditions [12]. The learning task of SVM (so called primary problem) in regression mode can be presented in the form [13] p 1 min φ (w,ξ,ξ' ) = C ∑ (ξi + ξi ' ) + w T w i=1 2
(1)
at the following functional and boundary constraints
d i − w T φ( x i ) ≤ ε + ξ i w T φ( x i ) − d i ≤ ε + ξ i'
(2)
ξ i ≥ 0 ξ i' ≥ 0 Fig. 2. The measured dependence between the daily concentration of PM10 and the strength of the wind (left), and between the concentration of PM10 and the temperature (right) for one chosen meteorological station in Warsaw
The important conclusion from these results is that there must exist complex relationships between the concentration of PM10 and the basic atmospheric parameters forming the mechanisms of spreading pollutants. This is the explanation why we need some advanced tools of prediction, potentially of nonlinear character. In the presented solution we will apply the neural networks of different kinds working in various arrangements. 3 Neural networks for prediction In our solution we will use three different forms of neural networks: multilayer perceptron (MLP), radial basis function networks (RBF) and support vector machine (SVM) working in regression mode. We have chosen these types of networks because of their universal approximation ability. Especially interesting is SVM known from its relative insensitivity of the limited number of learning data and very efficient learning algorithm, thanks to the fact that the formulation of learning problem leads to the quadratic programming with linear constraints. The multilayer perceptron belongs to the most known and widely used neural networks of global approximation ability [7]. It consists of many simple neuron-like processing units of sigmoidal activation function grouped together in layers. The typical network contains one hidden layer followed by the output layer of neurons. Information is processed locally in each unit by computing the dot product between the corresponding input vector and the weight vector of the neuron. Traditionally, training the network to produce a desired output vector di when presented with an input vector xi involves systematically changing the weights of all neurons until the network produces the desired output within a given tolerance (error). The desired output signals represent the known target values (the class to which the input feature vector x belongs). The RBF network applies local activation function, most often of Gaussian type [7]. This is in contrast to the sigmoidal function of global character used in MLP. Thanks to this we can significantly simplify the learning algorithm, splitting it into two phases: separate choice of the center positions of the Gaussian functions using clusterization and then adaptation of the output weights by solving the quadratic programming problem. The next classifier used in the ensemble is the support vector machine of the Gaussian kernel [13] working in re-
In these equations w represents the vector of weights, p is the number of learning data pairs (xi,di), φ(x) – the activation function vector, the minimized variables ξ i and ξ i' are the slack variables and the constant C is a user specified regularization parameter. The variables ε and C are free hyperparameters that control the VC dimension of the approximating function and influence the generalization abilities of SVM. Both must be selected a‘priori by the user. The solution of so defined constrained optimization problem is found by introducing the Lagrangian function and Lagrange multipliers α i , α i ' (i=1, 2, …, p) responsible for the functional constraints. The solution of it (the dual problem) is equivalent to the task [13]
max ∑ d i (α i − α i ' ) − ε ∑ (α i + α i ' ) + (3)
p
p
i =1
i =1
1 p p − ∑∑ (α i − α i ' )(α j − α j ' )K (x i , x j ) 2 i =1 j =1
at the constraints
∑ (α i − α i ') =0, 0 ≤ α i ≤ C , 0 ≤ α i ' ≤ C p
(4)
i =1
where K ( x i , x j ) = ϕ ( x i ) ϕ (x j ) is an inner-product kernel T
function defined in accordance with Mercer’s theorem [13] on the basis of the learning data set x. After solving the dual problem with respect to Lagrange multipliers we can express the network output signal y(x) through their optimum values α oi , α oi ' and the kernel function K(x,xi) as N sv
(5)
y (x ) = ∑ (α io − α ' oi )K (x, x i ) + w0 i =1
where Nsv is the number of so called support vectors equal to the number of nonzero Lagrange multipliers In practical implementation of the SVM algorithm to the most important belongs the choice of the parameters ε and C. Constant ε determines the margin within which the error is neglected. The smaller its value the higher is the accuracy of required matching of the response y(x) of SVM to the target values. However, too accurate matching of the learning data may result in the loss of generalization ability of the network (increase of the testing error on the data not taking part in learning). The constant C is the weight, determining the balance between the complexity of the network, characterized by the weight vector w and the error of approximation, measured by the slack variables ξ i and ξ i' (i=1, 2, …,p). For normalized input signals the value of ε is -3 -2 usually adjusted in the range (10 – 10 ) while C is much bigger than 1.
319
4. Diagnostic features for pollution prediction To make the accurate prediction we have to provide the appropriate set of input variables for the network, which are called the diagnostic features. The set of features should contain the variables which are strictly associated with the predicted value. In the case of meteorological pollution the most important factors that should be taken into account are: the temperature, strength and direction of the wind, humidity, pressure, type of the day (week day or weekend) and the season of the year [9], [2]. The first 4 variables form the meteorological parameters influencing the mechanism of pollution creation. The type of the day is associated with the traffic intensity united with everyday activity of the industry and individual people. It differs for workdays and weekends. The season of the year in Europe is an important factor in pollution prediction, because of heating season, (late autumn and winter), which may produce additional amount of pollutants. Additionally we have observed the important connection of the actual pollution and its past values, corresponding to the same type of the day. One week past history is usually taken into account This observation follows from some repeatable actions taken on the particular days of the week. In this way the dimension of the input vector x is equal 9. 5. The individual predictors 5.1 The direct neural modelling The typical approach to the forecasting problem is the direct application of neural network to the prediction. On the basis of the past history of pollution (one past value of the forecasted quantity corresponding to the same day of the week) and the additional parameters associated with the meteorological variables (temperature, wind, humidity, pressure) we form the prediction. The general form of this solution is presented in Fig. 3.
Fig. 3. The general structure of the neural predictor for the PM10 concentration for (d+1) day
To provide the appropriate representation of the wind, we have applied its strength and direction combined together in the form x and y components (rectangular system) of its speed vector (2 nodes in representation of x). Additionally we take into account the type of the day (binary representation of weekend or work day), season of the year (binary representation of four seasons) as well as the value of pollution of the previous dth day. All these values should be normalized. In this way the dimension of x is equal 9. The important problem is the choice of the predicted variable. The straightforward way is to predict the whole pollution value for the next day. However its variability is very high, hence its accurate prediction is very difficult. One of the other possible solution is to decompose the time series of pollution into terms of lower variability and apply the prediction strategy to each of them. We will use here the wavelet decomposition of the original time series of PM10 concentration.
5.2 The wavelet decomposition approach The goal of discrete wavelet transform is to decompose the time series f(n) into a finite summation of wavelets at different scales (levels) according to the expansion [5] (6)
f ( n ) = ∑∑ c jkψ ( 2 j nT − k ) j
k
where cjk is a new set of coefficients and ψ ( 2 j nT − k ) is the wavelet of jth level (scale) shifted by k samples. The set of wavelets of different scales and shifts can be generated from the single prototype wavelet, called mother wavelet, by dilations and shifts [5],[11]. In practice the wavelet transformation decomposes the original time series into the detailed coefficients Dj at different levels (j=1, 2, ..., J) and the residual approximated signal AJ using the so called Mallat pyramid algorithm through the series of highpass and lowpass filtering processes [11]. If we transform all detailed coefficients and the residual signal into the original resolution we can reconstruct the original signal f(n) in a simple way by summing them up together (7)
f ( n) = D1 (n) + D2 (n) + ... + DJ (n) + AJ (n)
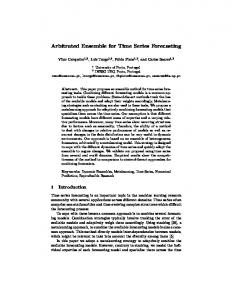
Fig. 4 presents the results of 5-level wavelet decomposition of the real data of PM10 concentrations (see Fig. 1), of the whole year 2007, obtained by using Matlab platform [14].
Fig. 4. The wavelet decomposition of the measured time series corresponding to PM10 concentration of the year 2007; D1 to D5 represent the detailed coefficients and A5 the coarse approximation of the time series on the 5th level
The Daubechies wavelets Db4 have been applied in the decomposition. All signals (the first five levels of wavelet coefficients from D1 to D5 and the coarse approximation A5 on the fifth level) are illustrated in the original resolution. We observe the substantial difference of variability of the signals at different levels. The higher is the wavelet level, the lower is variation of the coefficients and easier prediction of them. Our main idea is to substitute the prediction task of the original time series of high variability by predicting its wavelet coefficients on different levels of lower variability, and then using equation (7) for final forecasting of the pollution at any time point n. Since most of the wavelet coefficients are of lower variability we expect the increase of the total prediction accuracy. The important point in designing the predictive system
320
is decision what the optimal value of J is. At higher J the variability of larger number of predicted signals is lower, so their prediction is easier and hence the expected accuracy higher. However at too high number of levels the total error associated with the increased number of terms under prediction begins to dominate and as a result the total accuracy deteriorates. In our solution we have determined the value of J on the basis of the standard deviation of the approximated signals AJ. We stop the decomposition on the level for which the standard deviation of the approximated signal is substantially smaller than that of the original signal. In practice the stopping condition has been expressed in the empirical form [12] (8)
ˆ - the independent component matrix, formed from and Y the original matrix Y by omitting some rows, representing the noise. Fig. 5 presents the graphical illustration of the proposed method. The switches in the figure represent the possible elimination of the appropriate independent component at the reconstruction stage of the data.
std ( AJ ) < 0.1 std (f )
For the data distribution presented in Fig. 4 the value J=5 was appropriate, since the ratio std ( A5 ) / std (f ) = 0.067 satisfies the relation (8). The prediction of the detailed coefficients Di and the residual signal AJ needs to train as many neural networks as is the number of predicted detailed signals (at 5 level decomposition there is a need to train 6 predictors). The input signal structure for the predictor is identical to that of general scheme of Fig. 3. Of course the past history refers now to the predicted variables and not to the whole signal. 6.
The ensemble of predictors The natural way of improving the final results of prediction is to use the results of the individual methods by integrating them into the final predicting system. We have applied here two approaches to integration. One is based on blind source separation (BSS) principle [3],[4] and the second on application of another neural network structure used as the integrating tool [7]. 6.1 Integration using BSS Let us assume that there are many statistically independent time series of the forecasted variables, generated by using individual predictors. The first step of the procedure is the blind source separation [3] of them into independent components. The number of inputs to BSS is equal to the number N of the applied prognostic networks. The BSS system decomposes the original stream of signals of the same length p, forming the matrix X ⊂ R N × p (p is the number of prognosis days used in learning), into N independent components series by using the separation matrix
W ⊂ R N × N . The independent component signals, generated by BSS, form the matrix Y of N rows and p columns. This transformation is described by the simple linear relation [3] (9)
ˆ denotes the reconstructed time series matrix in which X
Y = WX
in which W means the demixing (separation) matrix, determined after learning process. Each row of the matrix Y represents the independent component series. Some of these series represent the essential information and some represent the noise from the point of view of prognosis. Cutting the insignificant components and reconstructing the original time series back into real prognosis, on the basis of the essential independent components only, will provide the prognosis deprived of the noise. The retrieved time series
ˆ of the should be of better quality. The reconstruction X original data matrix X is done by using inverse operation [3] ˆ = W −1Y ˆ X (10)
Fig. 5. The general scheme of the BSS analysis and reconstruction of the predicted time series
As a result of reconstruction we get N solutions (values of predicted concentrations of PM10), since the number of reconstructed variables is the same as the number of inputs. We accept the channel, which represents the best accuracy on the learning data set. In practical implementation of this approach we have applied 6 neural predictors applying MLP, RBF and SVM using either direct or wavelet decomposition approaches. 6.2 Nonlinear integration using neural network The other method of integration of the ensemble is the nonlinear mixing of the results of individual predictors. As an integrator we have applied the SVM network, the most efficient individual predictor. The input signals to it are the output values of the individual predictors. The applied destination values in the learning stage are the real pollutions corresponding to the days used in learning. After learning the parameters of the SVM integrator are fixed and the system is ready for use in the on-line operation. 7.
The results of numerical experiments The numerical experiments have been performed on the basis of data of the meteorological station situated in the southern part of Warsaw. The data have been collected within 3 years, from 2005 to 2007. They have been preprocessed and normalized according to the presented procedure. Two years have been used for learning and the last one left for testing purposes only. The MLP and RBF networks adjust all their parameters in the learning phase (no user defined parameters). The hyperparameters of SVM networks have been adjusted using some validation data extracted from the learning set. In the case of direct approach only one neural network of each type is needed. In the of case mixed approach (neural network + wavelet) we have applied the Daubechies wavelets Db4. This type of wavelet was selected after some introductory experiments. The wavelet decomposition has been carried out up to the fifth level. It means that 6 neural predictors should be trained: five for detailed coefficients Di(n) (i=1, 2, ..., 5) and one for the residual signal. Their results have been combined together into one final forecast of the pollution for the next day using eq. (7). The integration of the results of application of many predictors have been done using either BSS system learned by applying the JADE algorithm [4] or by applying the SVM fulfilling the role of integrator.
321
Direct SVM Direct RBF Direct MLP Wavelet+SVM Wavelet+RBF Wavelet+MLP BSS integrator SVM integrator
MAE [µg/m3] 6.47 6.99 7.07 4.37 5.76 4.93 3.89 4.03
RMS [µg/m3] 9.76 10.74 10.17 5.74 8.25 6.59 4.45 4.51
MAPE [%] 26.43 28.49 27.05 18.04 23.43 20.93 15.78 15.96
Table 1. The statistical results of experiments for testing data
Table 1 presents the statistical results in the form of
MAE =
1 p ( ∑ d i − yi ) , p i =1
MAPE =
RMS =
1 p ∑ d i − yi p i =1
2
and
1 p d i − yi (∑ ) ⋅ 100% errors for the testing data p i =1 d i
not taking part in learning at application of different forms of neural predictors and after integrating them by applying the linear BSS and nonlinear SVM integration systems. It is evident that the best individual predictor is SVM cooperating with wavelet decomposition. The other predictors (RBF and MLP) are evidently worse. However including them in the ensemble was profitable. The total errors of predictions have been significantly decreased. The best results correspond to the integration using SVM integrator. The relative improvement of MAPE with respect to the best SVM+wavelet individual predictor was over 12% and with respect to the worst one (direct RBF) over 44%.
Fig. 6. The graphical results of prediction of PM10 concentration at application at the best method of integration (the upper figure) and distribution of errors (lower figure)
Fig. 6 depicts the graphical results of prediction for the whole set of testing data at application of the SVM integrator for the subsequent 50 days. The upper figure shows the real data and their predictions, while the lower one the distribution of prediction errors. The coincidence of the results of prediction with the destination values is well visible. 8. Conclusions The paper has presented the forecasting system of the PM10 concentration in the air. It is based on the application of different kinds of neural networks. We have found that application of many predictors combined together into ensemble leads to the significant improvement of the predic-
tion results. All kinds of errors (MAE, RMS and MAPE) were substantially reduced using the combination of predictors. The important advantage of the proposed neural based approaches is that they do not require very exhaustive information about air pollutant, detailed creation mechanisms, meteorological pollutant sources and that they have the ability of allowing nonlinear relationships between very different predictor variables. These facts and good quality of the results make them very attractive in predictive applications in many places in the world. The proposed method has been tested on the data of the meteorological station situated in Warsaw. The obtained results of prediction are in good agreement with the actual measurements made at the station. The presented approach offers also great potential in other area of modeling of time series. REFERENCES [1] A g i r r e - B a s u r k , E . , I b a r r a - B e r a s t e g i , G . , M a d a r i a g a , I .: Regression and multilayer-based models to forecast hourly O3 and NO2 levels in the Bilbao area. Environmental Modelling and Software, 21 (2006) 430-446 [2] A l - A l a wi , S . , A b d u l - W a h a b , S . , B a k h e i t C .: Combining principal component regression and artificial neural networks for more accurate prediction of ground level ozone. Environmental Modelling and Software, 23 (2008) 396-403 [3] C i c h o c k i , A . , A m a r i S . I . : Adaptive blind signal and image processing. Wiley (2003) [4] C i c h o c k i , A . , A m a r i S . I . , S i we k , K . , T a n a k a , T . et al.: ICALAB. www.bsp.brain.riken.jp/ICALAB [5] D a u b e c h i e s , I . : Ten lectures on wavelets. SIAM Press (1988) [6] G r i v a s , G . , C h a l o u l a k o u , A . : Artificial neural network models for predictions of PM10 hourly concentrations in greater area of Athens. Atmospheric Environment Vol. 40 (2006) 12161229 [7] H a y k i n S ., Neural Networks - A Comprehensive Foundation, Macmillan, New York, 1999 [8] H o o y b e r g h s , J . , M e n s i n k , C . , D u m o n t , G . , F i e r e n s , F . , B r a s s e u r , O . : A neural network forecast for daily average PM10 concentrations in Belgium. Atmospheric Environment 39/18 (2005) 3279-3289 [9] K u k k o n e n , e t a l . Extensive evaluation of neural networks models for the prediction of NO2 and PM10 concentrations, in central Helsinki. Atmospheric Environment Vol. 37 (2003) 4539-4550 [10] N i s k a , H . , H i l t u n e n , T . , K a r p i n e n , A . , R u u s k a n e n , J . , K o l e h m a i n e n , M . : Evolving the neural model for forecasting air pollution time series. Eng. Appl. Artif. Intell., 17 (2004) 159-167 [11] M a l l a t , S . , A theory for multiresolution signal decomposition: the wavelet representation. IEEE Trans. PAMI Vol. 11 (1989) 674 – 693 [12] O s o ws k i , S . , G a r a n t y , K .: Forecasting of the daily meteorological pollution using wavelets and Support Vector Machine. Eng. Appl. Artif. Intell. 20 (2007) 745-755 [13] S c h ö l k o p f , B . , S m o l a , A . : Learning with Kernels. MIT Press, Cambridge MA. (2002) [14] Wavelet toolbox for Matlab, User manual, MathWorks, Natick, USA (1997)
Acknowledgements This research activity was financed from the fund intended for science development in 2004-2009, as the R&D project. Authors: Prof. Stanislaw Osowski, Warsaw University of Technology and Military University of Technology, Warsaw, Poland, email:
[email protected]; dr Krzysztof Siwek and MSc. Konrad Garanty, Warsaw University of Technology Warsaw email:
[email protected]; Mieczyslaw Sowinski, Andrzej Soltan Institute for Nuclear Studies, Otwock, Poland
322