Neural predictor ensemble for accurate forecasting of PM10 pollution K. Siwek, S. Osowski, and M. Sowinski
Abstract—The paper presents the neural network approach to the accurate forecasting of the daily average concentration of PM10. Few neural predictors are applied: the multilayer perceptron, radial basis function, Elman network and support vector machine. They are used for prediction either in direct application or in combination with wavelet decomposition, forming many individual prediction results that will be combined in an ensemble. The important role in presented approach fulfills the integration of this ensemble. We have proposed solution applying the principal component analysis and additional neural network responsible for final forecast. The numerical experiments for prediction of the daily concentration of the PM10 pollution in Warsaw are presented. They have shown good overall accuracy of prediction in terms of all investigated measures of quality: the errors RMSE, MAE MAPE as well as index of agreement and correlation of the prediction and true values.
I. INTRODUCTION Air pollution (e.g. CO2, NOx, PM10, O3) has been a major concern, especially for densely populated metropolitan areas, since the level of pollution is strictly associated with the health of the inhabitants. Especially important is the particulate matter (PM) of the diameters to 10µm (PM10). The main source of PM is the vehicular traffic and dust of the streets generated by the circulation. These particles not only reduce the visibility of the air but have also direct impact on human health via inhalation [1],[2]. Actually PM is of importance for an European policy (the EU Council Directive 1999/30/EC, EC/2000/69 and EC/2002/3) defining the restrictions for the yearly and 24h averages PM10 concentrations. In the last decade several forecasting systems have been designed by applying different mathematical tools and models. Various methods of prediction have been already developed [1],[2],[4],[5],[6],[7]. Some of them use complex mathematical models simulating the dynamics of the environmental processes. Some use the previous (historic) data to build an ad hoc predictive models. The most typical representatives of the latter approach are the autoregressive linear or nonlinear models, neural networks, support vector
Manuscript received April 8, 2010. K. Siwek is with Warsaw University of Technology, Warsaw, Poland (email: ksiwek@ iem.pw.edu.pl). S. Osowski, is with Warsaw University of Technology and Military University of Technology, Warsaw, Poland (tel. +4822-234-7235, e-mail:
[email protected]). M. Sowinski is with Andrzej Soltan Institute for Nuclear Studies, OtwockSwierk, Poland
978-1-4244-8126-2/10/$26.00 ©2010 IEEE
machine or neuro-fuzzy systems. This paper will develop the methods of forecasting the daily average values of PM10 applying different solutions relying on application of the neural networks. Most approaches have developed the particular model of forecasting, neglecting the other, already existing ones. In our paper we present different strategy. We present the prediction methods based on the application of many neural alike networks, including multilayer perceptron (MLP), support vector machine for regression (SVR), Elman network (EN) and radial basis function network (RBF). To get more independent solutions we propose also a decomposition of the prediction process of time series into many simpler tasks by using wavelet transformation [8]. Thanks to this we increase the number of predictors cooperating together in the ensemble and in this way further reducing the final error of prediction. The important point in our approach is the integration of many predicted values into one final forecast. This operation is solved by the additional neural network, for which the input signals are formed by the predicted values generated by the individual neural predictors.
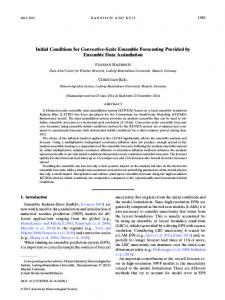
Fig. 1 The daily averaged values of PM10 pollution in three years measured in suburb of Warsaw
The theoretical considerations have been followed by the numerical experiments made for the data gathered within three years in Warsaw, Poland. The results of experiments have shown that our policy of mixing different methods of predictions into one forecasting system leads to an improved accuracy of forecasting. The results of these experiments are given and discussed in the paper.
II. PROBLEM ANALYSIS In the prediction of the next day pollution of PM10 the great impact is paid on its previous days values. The difficulty of the problem is measured by the changes of the concentration from day to day. The higher this variability the more difficult is the prediction problem. Fig. 1 presents the daily averaged values of PM10 pollution measured by the meteorological station situated in suburb Ursynow of Warsaw within three years: 2006, 2007 and 2008. Analyzing the daily distribution of the pollution we can see significant changes of the daily values from year to year. Their dependence on different environmental conditions, changing from year to year in an unknown way is difficult to explain, and seems to be very complex. Quite interesting is also the correlation of the pollution existing among different years. Table I represents the values of the cross correlation coefficients among the years under consideration regarding the PM10 pollution. They stay on reasonably high level, although we can observe some differences among them. TABLE I THE CROSS CORRELATION COEFFICIENTS FOR POLLUTION DISTRIBUTION WITHIN DIFFERENT YEARS
2006 2007 2008
2006 1 0.920 0.878
2007 0.920 1 0.867
2008 0.878 0.867 1
To built the adequate prediction model we have to generate the proper input prognostic features, on the basis of which the predictor will generate its forecast. So it is quite important to discover the relationship between PM10 concentration and the other meteorological parameters influencing the pollution. According to the actual research the most important recognized parameters having the greatest impact on the mechanism of pollution creation are: the temperature, pressure, direction and strength of the wind and humidity. To understand these relations we have investigated the distribution of PM10 concentration as a function of these parameters. The important are the relations between the environmental factors themselves. To get good results of prediction we should avoid features correlated with each other. Table II presents the correlation coefficients between different environmental factors that will be used in prediction. These coefficients have been calculated for a data corresponding to all years under consideration. It is evident that all factors are weakly correlated with each other, hence there is no reason to remove any of them. TABLE II THE CROSS CORRELATION COEFFICIENTS BETWEEN DIFFERENT ENVIRONMENTAL FACTORS
Temperature Wind_x Wind_y Humidity
Temperature 1 0.283 0.045 -0.778
Wind_x 0.283 1 -0.365 -0.089
Wind_y 0.045 -0.365 1 -0.133
Humidity -0.778 -0.089 -0.133 1
Observing the relations between different variables influencing the pollution we have come to the conclusion that there exist complex relationships between the concentration of PM10 and the basic atmospheric parameters influencing the mechanisms of creation and spreading the pollution. This is a justification that we need some advanced tools of prediction, potentially of nonlinear character, that could provide proper results of forecast. In the presented solution we propose the application of many neural networks working in various arrangements, combined together in the ensemble. III. THE NEURAL NETWORKS FOR PREDICTION The key point in our approach to the prediction problem is applying many independent neural predictors combined in the ensemble. The output signals of the predictors, elaborated on the basis of the same input data but of different principles of operation give good hope to generate independent outcomes, which combined together provide the room for further improvement. The independence of the operation of the individual predictors is a key point for getting high quality performance of the ensemble. At independent operation of predictors each of them commit the prediction errors at different points. Taking into account all their results at any particular day we are able to compensate for same errors and in this way to reduce the total error of prognosis. To get the best results we should chose predictors of similar quality, however independent from each other. In our solution we have chosen 4 neural type predictors: the multilayer perceptron (MLP), radial basis function network, Elman recurrent network and support vector machine (SVR). All of them are known from excellent operation in nonlinear signal processing. To represent the generally unknown, next day PM10 pollution level, we map its past values into the present forecasted one. The general supervised model of the pollution forecast for dth day has been assumed in the following mathematical form [7]
Pˆ (d ) = f (w, ws, t, h, r, s, P(d − 1))
(1)
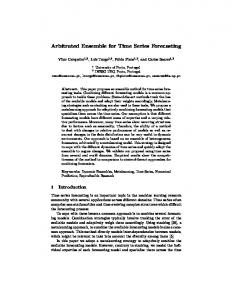
In this expression w represents the vector of adjusted parameters of the network, ws – the wind strength, t – temperature, h – humidity, r –type of the day and s – the season of the year. The symbol Pˆ ( d ) represents the predicted PM10 pollution and the P (d − 1) written without hat – the known values of the pollution of the previous day. We have taken into account only the pollution of one previous day, since there is very little correlation between pollutions of more distant days. To provide the appropriate representation of the wind, we have applied its strength and direction combined together in the form x and y components (rectangular system) of its speed vector (2 nodes in representation). Additionally we take into account the type of the day (binary representation of weekend
or work day) and the season of the year (binary representation of four seasons).
Fig. 2 The general scheme for pollution level forecasting using sinle neural predictor
Fig. 2 presents the general model of forecasting the pollution corresponding to the next dth day. To provide similar impact of all input variables, the data samples should be normalized. The normalization may take different forms, from which the simplest one is to divide the real load by the mean value of the data base corresponding to the years taking part in experiments. The particular forms of the applied predictors depend on their structure and way of learning. The expression (1) may be associated with all types of neural predictors considered in our work: MLP, RBF, SVR and EN. A. MLP predictor MLP is a neural network of the particular layered structure, known from its good approximation ability. The MLP [9] consists of many simple neuron-like processing units of sigmoidal activation function grouped together in layers. The synaptic connections exist only between the neighboring layers. The number of input nodes depends on the number of factors (features) taken into account at the prediction process. The number of hidden layers and neurons of sigmoidal nonlinearity are usually subject to adjustment in an experimental way by training different structures and choosing the smallest one, still satisfying the learning accuracy. The output layer contains only 1 linear neurons responsible for prediction of the pollution level of dth day. The signal of output neurons represents the normalized forecasted pollution value. The learning procedure of MLP is reduced to the minimization of the Euclidean error measure between the actual and desired output signals over the entire learning data set. The most effective learning approach applies the gradient information and uses second order optimization algorithms, like Levenberg-Marquard or BFGS variable metric method [9]. The input layer represents the excitation nodes. One node is used for binary coding of the type of day (working day or nonworking day) and two - the season of the year (winter, spring, summer and autumn). Single inputs are needed for representation of temperature or humidity and two nodes for representation of the wind (the x and y components). The input
set of signals is completed by the past value of pollution, corresponding to the previous day of the same type. The optimal number of hidden layers and neurons in these layers was found by using trial and error approach. It means learning many different structure MLP networks and accepting this one which provides the least value of the error on the validation data extracted from the learning data set (usually 20% of the learning set). On the basis of these experiments we have found the optimal structure consisting of one hidden layers of 8 sigmoidal neurons. In this way the optimal structure of MLP network used in our prediction may be described as 8-8-1. B. Radial basis function predictor Radial basis function network belongs to the important class of systems performing the role of local approximation [9]. Its characteristic point is the application of the activation functions of short duration, for example Gaussian function
{
}
ϕ j ( x ) = exp − (x − c j )T (x − c j )/ σ 2j , with cj – the center vector and σj – the width parameter. Application of Gaussian functions leads to the great simplification of the learning algorithm following from the association of the network parameters with the distribution of the learning data points in the multidimensional space. The learning problem of radial basis function network is defined as the minimization of the cost function determined on the set of learning data points (xi, ti) for i=1, 2, ..., p. All we have to find in the learning process is to determine the number of hidden units, positions of center vectors (cj), the width parameters (σj) and the weights of the output linear neuron. The centers are usually adjusted on the basis of analysis of all learning input vectors xi. The process of RBF network parameter adaptation is usually solved very fast by applying either clusterization of the input vectors or by applying orthogonal least square (OLS) procedure. The input data for RBF network are exactly the same as for MLP predictor. The number of hidden neurons as well as all parameters of the network have been found in our solution by applying the OLS procedure [9]. The best results have been obtained at 40 Gaussian hidden neurons (the network structure 8-40-1) C. Elman network Elman network is a two layer recurrent structure of sigmoidal neurons, implementing the feedback from the hidden layer to the input of the network [9]. This feedback path allows Elman network to learn to recognize and generate temporal patterns, which are of interest in prediction. The external input signals to Elman network are the same as for the MLP network. The most distinct difference of Elman network to the MLP is the feedback. Thanks to its existence we are able to reduce the complexity of the network. In the numerical experiments we have used the structure 8-3-1 applying 8 input external nodes (the same as in MLP), only 3 hidden ne4urons and 1 output neuron, responsible for the predicted value. The significant reduction of the quantity of synaptic weights was possible thanks to the feedback. The learning strategy of
Elman network uses similar principle of minimization of error function defined for the learning data, implemented in the same way as for MLP. In our experiments it was performed using the Levenberg-Marquardt algorithm [9]. D. SVR predictor Support Vector Machine is another powerful neural like structure developed by Vapnik [10]. We have applied it in a regression mode. In training SVR we use the same input data arranged in an 8-element vectors x, identically as for MLP and Elman networks. In distinction to the previous networks SVR does not predefine the number of hidden units (kernel functions). This number is automatically determined in the learning procedure. The learning strategy of SVR network is relied on another philosophy than in the MLP, RBF or Elman networks. Instead of minimizing the error function defined for the learning data it minimizes the weights of the network, while keeping the output signals as close as possible to their destination values [10]. In practice the learning procedure is transformed to the dual maximization problem defined for the set of Lagrange multipliers α i and α i ' (i=1, 2, …, p), where p is the number of learning data (xi, ti). The solution of it with respect to Lagrange multipliers is relatively easy and there are many very efficient algorithms leading to the global minimum [10]. After solving the dual problem we can determine the network output signal y(x) through the optimized Lagrange multipliers α i ,α i ' and the kernel functions K(x,xi) in the following way [10]
y(x) =
N sv
∑ (α i − α ' i )K (x, x i ) + b
(2)
the whole pollution value for the next day. However because of its high variability its accurate prediction is difficult. Another solution is to decompose the predicted time series into terms of lower variability, apply the prediction strategy to each of them and then sum up the individual terms. We will use here the wavelet decomposition of the original time series of PM10 concentration. Let us denote the analyzed time series by x(n). The goal of the discrete wavelet transformation is to decompose this time series into a finite summation of wavelets at different scales (levels) according to the expansion [11],[12]
x (n ) = ∑∑ c jkψ (2 j nT − k )
(3)
j k
where cjk is a new set of coefficients and ψ ( 2 j nT − k ) is the wavelet of jth level (scale) shifted by k samples [4]. In practice the wavelet transformation decomposes the original time series into the detailed coefficients Dj(k) of the proper time shifts k at different levels (j=1, 2, ..., J) and the residual approximated signal AJ(k) using the so called Mallat pyramid algorithm through the series of high pass and low pass filtering processes [12]. If we transform all detailed coefficients and the residual signal into the original resolution we can reconstruct the original time series x(n) in a simple way by summing them up together
x (n ) = D1 (n ) + D2 ( n ) + ... + DJ ( n ) + AJ ( n )
(4)
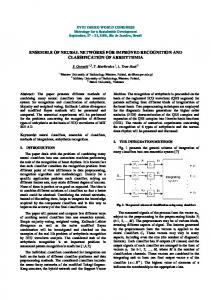
Fig. 3 presents the results of 5-level wavelet decomposition of the real data of PM10 concentrations of one year (the upper curve) obtained by applying Daubechies Db8 wavelets implemented on Matlab platform [11].
i =1
where Nsv is the number of so called support vectors (the number of nonzero Lagrange multipliers) and b is the bias. In practice the most often used kernels are the Gaussian and polynomial functions. To get the reliable results of learning we have to make the proper choice of hyperparameters ε (the assumed tolerance) and C (the user specified regularization parameter). Constant ε determines the margin within which the error is neglected. The smaller its value the higher is the accuracy of the required matching of the response y(xi) of SVR to the proper target values ti in the learning data set. However, too accurate matching of the learning data may result in loss of the generalization ability of network, leading to the increase of the testing error. The constant C is the weight, determining the balance between the complexity of the network characterized by the weight vector w, and the error of approximation. For the normalized input signals the value of ε is usually adjusted in the range (10-3 – 10-2) while C is much bigger than the value of 1 (the typical value 1000). IV. WAVELET REPRESENTATION OF THE TIME SERIES The important problem in defining the prediction task is the choice of the predicted variable. The natural way is to predict
Fig. 3. The wavelet decomposition of the measured time series x(n) of PM10 concentration of one year; D1 to D5 represent the detailed coefficients and A5 the coarse approximation of x(n) on the 5th level
All signals, from the first (D1) to fifth (D5) levels and the coarse approximation A5 on the fifth level are illustrated in the original resolution (the same as signal x(n)). The significant difference of variability of the signals at different levels can be observed. The higher wavelet level, the lower is variation of its coefficients and easier prediction of them.
Our main idea is to substitute the prediction task of the original time series of high variability by predicting its lower variability wavelet coefficients on different levels. The final forecast of the pollution at any time point n is then obtained by applying the equation (4). Since most of the wavelet coefficients are of lower variability we expect the increase of the total prediction accuracy of the time series. The additional problem is to take decision what the optimal value of J is. At higher J the variability of larger number of predicted signals is lower, so their prediction is easier and the expected accuracy higher. However if the number of predicted terms is too large the total error associated with the increased number of terms begins to dominate and as a result the total accuracy of prediction deteriorates. In our solution we have determined the value of J on the basis of standard deviation of the approximated signal AJ. The decomposition is stopped on the level for which the standard deviation of the approximated signal is substantially smaller than that of the original signal. This condition was expressed in the empirical form [7]
std ( AJ ) < 0 .1 std ( x)
percentage of the most important part of the original information The PCA transformed data are used as the input signals to the final integrating unit (MLP or SVM network). Training of the final stage predictor uses real pollutions corresponding to the days used in learning as the destination values.
(5)
For the data distribution presented in Fig. 3 the value J=5 was appropriate, since the ratio std ( A5 ) / std (f ) = 0.054 satisfies the relation (5). The prediction of the detailed coefficients Di and the residual signal AJ needs to train as many neural networks as is the number of predicted detailed signals (at 5 level decomposition there is a need to train 6 predictors). The input signal structure for the predictor is identical to that of general scheme of Fig. 2 with the exception that the past history refers now to the predicted variables and not to the whole signal x(n). V. THE ENSEMBLE OF PREDICTORS Application of many predictors generates many prediction results concerning the pollution level of the next day. Our idea is to combine them together into one final forecasting system by integrating them in an optimal way. Observe that each predictor generates the time series which is independent from each other. All of them are burdened by some errors, which are also independent from each other. Combining all individual results together allows to reduce the average level of prediction errors. The simplest, although not optimal possible solution to the integration is averaging the outcomes of all applied predictors. Good results of integration might be also obtained by applying blind source separation approach [13], In this paper we propose the nonlinear mixing of the results of individual predictions by applying principal component analysis (PCA) and the most effective neural type networks: the SVM and MLP. PCA is used to reduce the size of the data from 8 components (the output signals from 8 predictors) to smaller number (typically 3) while keeping the sufficiently high
Fig. 4. The diagram of the proposed 2-stage forecasting system
Fig. 4 presents the final structure of the forecasting system applied in our solution. It contains 8 individual predictors based on MLP, RBF, SVR and Elman networks in composition with wavelet transformation. The upper four are used for prediction of the whole pollution for the next day and the next four are combined with the wavelet decomposition (the set of neural predictors used for predicting the wavelet coefficients of 5 levels). After PCA reduction the final neural predictor is excited by K (K=3) streams of data representing the most important information extracted by the PCA analysis from the outcome of 8 individual predictors. Observe that all pieces of information used in training the second stage predictor are generated on the basis of the same input source (the same vector x of prognostic variables). The final predictor undergoes the regular learning procedure. After learning, the parameters of it are fixed and the system is ready for use in the on-line operation, when only the input vector x is known. VI. THE RESULTS OF NUMERICAL EXPERIMENTS The numerical experiments have been performed for the meteorological data of the last 3 years, measured in the suburb Ursynow of Warsaw. They have been pre-processed and normalized according to the presented procedure. Two years have been used for learning and one left for testing purposes only. The number of hidden neurons in MLP, RBF and EN networks as well as the hyperparameters of SVR have been adjusted using some validation data extracted from the learning set (20% of learning data). In the case of direct approach only one neural network of each type is needed. In the case of mixed approach (neural network + wavelet) we have applied the Daubechies wavelets
Db8. This type of wavelet was selected after some introductory experiments. The wavelet decomposition has been carried out up to the fifth level. It means that 6 neural predictors should be trained: five for detailed coefficients Di(n) (i=1, 2, ..., 5) and one for the residual signal A5(n). Their results in the form of sum (eq. 4) create the forecast for the whole pollution of the day. In this way 8 different predictors cooperating in the ensemble have been created. Their outcomes have been combined together using PCA and SVR or MLP into one final forecast of the pollution for the next day (see Fig. 4). To assess the results in a most objective way we have applied different measures of quality of prediction. Five measures have been used: • The mean absolute error (MAE)
1 p MAE = ( ∑ ti − yi ) p i =1 •
The mean absolute percentage error (MAPE)
MAPE = •
1 p ti − y i (∑ ) ⋅ 100% p i =1 d i
(7)
The root mean square error (RMSE)
RMSE = •
(6)
1 p 2 ∑ ti − y i p i =1
(8)
The correlation coefficient (R) of the observed and predicted data
R=
R yt
(9)
std ( y ) std (t )
where Ryt is the covariance value between the really observed (t) and predicted (y) data points of PM10 concentration and std denotes standard deviation of the appropriate variables. • The index of agreement (IA) p
2
∑ (ti − yi )
IA = 1 − p i =1 2 ∑ ti − t + y i − t
(
(10)
)
i =1
where p is the number of data points, yi is the predicted value, ti – the really observed value and t the average of really observed data [14]. To get the most objective assessment of the proposed prediction system we have compared the results of prediction only for testing data not taking part in learning process. In all experiments the learning set was composed of data of the first and second year while the testing data covered only the third year. In all experiments the developed neural network structures of the first stage were as follows: 8-8-1 of MLP, 8-40-1 of RBF and 8-3-1 of EN. They have been found after a series of additional introductory trials. The number of Gaussian kernels of SVR network was adjusted by the learning procedures and in each experiments was different, changing from 18 to 47.
Table III presents the prediction results of 8 individual predictors obtained in the experiments. The columns of MLP, RBF, SVR and EN represent the direct approach to prediction. The other 4 columns represent the application of the wavelet transformation (W) in combination with the appropriate type of neural network. TABLE III THE RESULTS OF INDIVIDUAL PREDICTORS IN THE EXPERIMENTS MLP RBF SVR EN MLP RBF SVR EN +W +W +W +W MAE 8.19
9.82
7.45
8.35
4.32
4.22
3.98
4.02
12.26
14.04
10.91
11.58
6.08
5.86
5.55
5.59
30.36
38.25
26.92
31.71
16.44
16.05
14.59
14.80
R
0.658
0.600
0.692
0.677
0.918
0.921
0.923
0.924
IA
0.798
0.762
0.799
0.810
0.951
0.950
0.956
0.954
[µg/m3] RMSE [µg/m3] MAPE [%]
The presented results show that the best results have been obtained at application of SVR and EN predictors in combination with wavelet decomposition (SVR+W and EN+W). The relative differences between different type predictors are quite substantial (up to 50% in relative terms), especially if we compare the direct and wavelet supported approaches. It means that the combination of all individual predictors in the ensemble may be not an optimal solution. Quite interesting from the point of view of integration is the correlation of the individual solutions presented by predictors. We have investigated these dependencies by calculating the correlation coefficients between them. Table IV presents values of the correlation coefficients between different solutions. TABLE IV THE CORRELATION BETWEEN THE RESULTS OF INDIVIDUAL PREDICTORS RBF SVR EN MLP+ RBF SVR EN+ MLP W +W +W W MLP 1 0.53 0.96 0.95 0.64 0.54 0.65 0.62 RBF 0.53 1 0.54 0.54 0.37 0.41 0.37 0.36 SVR 0.96 0.54 1 0.97 0.65 0.55 0.65 0.63 EN 0.95 0.54 0.97 1 0.62 0.54 0.62 0.60 MLP+W 0.64 0.37 0.65 0.62 1 0.85 0.93 0.91 RBF+W 0.54 0.41 0.55 0.54 0.85 1 0.88 0.87 SVR+W 0.65 0.37 0.65 0.62 0.93 0.88 1 0.98 EN+W 0.62 0.36 0.63 0.60 0.91 0.87 0.98 1
The results suggest, that there is rather not significant correlation between individual predictors. Thus we may expect the improvement of the prediction results after their integration into one forecasting system. In further investigations we have performed two forms of integration. In the first one we combined the results of all 8 predictors and in the second only the best 4 predictors that have used wavelet transformation of the data. In the first case (8 signals produced by the individual predictors) we have applied the first three principal components of PCA as the
input signals to the second stage of the predicting system (SVR or MLP). In the second case (at 4 wavelet based predictors only) the number of input signals was small and the application of PCA was not needed. It means that crude signals of all individual predictors were directly input to SVR or MLP. Table V presents the results of neural integration of all 8 predictors combined into the ensemble. The results are depicted at application of SVR and MLP, used as the final integrating unit. The number of inputs for both neural based integrators in all experiments was the same (3 after reduction from 8 by PCA). TABLE V THE COMBINED PREDICTION RESULTS OF ENSEMBLE OF 8 PREDICTORS IN THE EXPERIMENTS
SVR integrator
MLP integrator
MAE [µg/m3]
4.13
4.04
3
RMSE [µg/m ]
5.76
5.79
MAPE [%]
15.62
14.74
R
0.925
0.924
IA
0.960
0.959
It is evident that including many predictors of radically different qualities in the ensemble brings practically no improvement of results with respect to the best individual predictor (SVR+W). Of course we should notice the significant improvement with respect to the worst single predictors (more than 50% of relative improvement). In the next experiment we have excluded all worst quality direct predictors, leaving only solutions applying the wavelet transformation. So the number of integrated predictors was equal 4 and there was no need for PCA reduction of the data. The results of prediction have changed to better now. Table VI presents the results of integration of these 4 predictors into an ensemble by applying both: MLP and SVM integration. It is evident that the MLP approach to the integration produces better results.
VII. CONCLUSION The paper has proposed the novel forecasting system of the PM10 concentration in the air. It is based on the application of many neural type predictors cooperating with wavelet transformation, combined into the ensemble. The important novelty of the proposed approach is the application of the additional neural network for integration of the ensemble. It was found that application of this two stage prediction approach leads to the improvement of the accuracy of pollution forecast. The MAE, RMSE and MAPE errors were reduced. Also the other quality measures in the form of correlation coefficient and index of agreement have been improved. The important advantage of the proposed neural based approaches is that they do not require very exhaustive information about air pollutant, reaction mechanisms, meteorological pollutant sources and that they have the ability of allowing the nonlinear relationships between very different predictor variables. These facts and good quality of the results make them very attractive in predictive application of PM10 concentration. ACKNOWLEDGMENT This research activity was financed by the Polish Ministry of Science and Higher Education. REFERENCES [1]
[2]
[3]
[4]
[5]
TABLE VI THE COMBINED PREDICTION RESULTS OF ENSEMBLE OF 4 BEST INDIVIDUAL PREDICTORS IN THE EXPERIMENTS
SVR integrator
MLP integrator
MAE [µg/m3]
4.02
3.93
3
RMSE [µg/m ]
5.59
5.60
MAPE [%]
15.19
14.01
R
0.929
0.929
IA
0.962
0.963
[6]
[7]
[8] [9] [10]
The agreement of the predicted values of pollution with their destinations, expressed by the quality measures in the form of the coefficients R and IA, as well as the error measures MAE and MAPE, has been increased significantly in the comparison to the best individual predictor.
[11] [12] [13] [14]
G. Grivas and A. Chaloulakou, “Artificial neural network models for predictions of PM10 hourly concentrations in greater area of Athens”, Atmospheric Environment, vol. 40, 2006, pp. 1216-1229 J. Hooyberghs, C. Mensink, G. Dumont, F. Fierens and O. Brasseur, “A neural network forecast for daily average PM10 concentrations in Belgium”, Atmospheric Environ., vol. 39/18, 2005, pp. 3279-3289 E. Agirre-Basurk, G. Ibarra-Berastegi, and I. Madariaga, “Regression and multilayer-based models to forecast hourly O3 and NO2 levels in the Bilbao area”, Environmental Modelling and Software, vol. 21 2006, pp. 430-446 S. Al-Alawi, S. Abdul-Wahab and C. Bakheit, “Combining principal component regression and artificial neural networks for more accurate prediction of ground level ozone”, Environmental Modelling and Software, vol. 23, 2008, pp. 396-403 T. Kukkonen, et al., “Extensive evaluation of neural networks models for the prediction of NO2 and PM10 concentrations, in central Helsinki”, Atmospheric Environment, vol. 37, 2003, pp. 4539-4550 H. Niska, T. Hiltunen, A. Karpinen, J. Ruuskanen, and M. Kolehmainen, “Evolving the neural model for forecasting air pollution time series”, Eng. Appl. Artif. Intell., vol. 17, 2004, pp. 59-167 S. Osowski and K. Garanty, “Forecasting of the daily meteorological pollution using wavelets and Support Vector Machine”, Eng. Appl. Artif. Intell., vol. 20, 2007, pp. 745-755 Wavelet toolbox for Matlab - User manual, MathWorks, Natick, USA, 2008 S. Haykin, Neural networks - a comprehensive foundation, Macmillan, New York, 1999 B. Schölkopf and A Smola, Learning with kernels, MIT Press, Cambridge MA., 2002 I. Daubechies, Ten lectures on wavelets, SIAM Press, 1988 S. Mallat, A wavelet tour of signal processing, Elsevier, San Diego, 1999 A. Cichocki and S. I. Amari, Adaptive blind signal and image processing, Wiley, 2003 S. E. Walker, L H. Slørdal, C. Guerreiro, F. Gram and K. Grønskei, “Air pollution exposure monitoring and estimation, Part II”, J. Environ. Monit., 1999, vol. 1, pp. 321–326