Entity-Based Collaboration Tools for Intelligence Analysis Eric A. Bier, Stuart K. Card Palo Alto Research Center, Inc.*
John W. Bodnar Science Applications International Corporation**
ABSTRACT Software tools that make it easier for analysts to collaborate as a natural part of their work will lead to better analysis that is informed by more perspectives. We are interested to know if software tools can be designed that support collaboration even as they allow analysts to find documents and organize information (including evidence, schemas, and hypotheses). We have modified the Entity Workspace system, described previously, to test such designs. We have evaluated the resulting design in both a laboratory study and a study where it is situated with an analysis team. In both cases, effects on collaboration appear to be positive. Key aspects of the design include an evidence notebook optimized for organizing entities (rather than text characters), information structures that can be collapsed and expanded, visualization of evidence that emphasizes events and documents (rather than emphasizing the entity graph), and a notification system that finds entities of mutual interest to multiple analysts. KEYWORDS: sensemaking, information foraging, collective intelligence, exploratory search, information workspace, entity-based, collaboration, intelligence analysis, visualization, semantic notebook, argumentation marshalling, visual analytics. INDEX TERMS: H.5.2 [User Interfaces]: Graphical user interfaces (GUI); H.3.3 [Information Search and Retrieval]: Information filtering; H.4 [Information Systems Applications]: H.4.m Miscellaneous; H.5.3 [Group and Organization Interfaces]: Collaborative computing, Computer-supported cooperative work, Web-based interaction 1
INTRODUCTION
Collaboration is an essential component of intelligence analysis and other forms of knowledge work. In intelligence analysis in particular, essential knowledge of evidence and where to find it lives in the minds of other analysts and other experts. As a result, as new software tools for analysts are being designed, it is important to consider the extent to which those tools will support collaboration. In addition, while it is possible to support some forms of collaboration with general-purpose collaboration tools, such as e-mail, instant messaging, and video conferencing, it is becoming clear that there is a need for analytical tools that integrate collaboration more directly into the analytical process. In this paper, we describe a collaborative analytical tool based on the idea that collaboration is made easier if it is organized around entities (people, places, things, times, etc) rather than freeform text. There are several reasons that integrated collaboration is needed. In the first place, stand-alone collaboration tools can * 3333 Coyote Hill Road, Palo Alto, California, 94304 {bier, card}@parc.com ** 1710 SAIC Drive, McLean, VA 22102
[email protected]
IEEE Symposium on Visual Analytics Science and Technology October 21 - 23, Columbus, Ohio, USA 978-1-4244-2935-6/08/$25.00 ©2008 IEEE
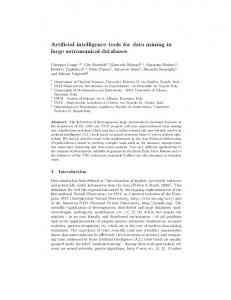
Figure 1. The Think Loop Model of all-source analysis
interrupt the process of analysis by drawing attention away from analytical tools; interruptions from knowledge work can reduce productivity. In the second place, the need for collaboration may become apparent as a direct result of the analytical work; for example, the need for another opinion or additional information may flow directly out of the process of organizing evidence, or evaluating evidence against hypotheses. Finally, the analyst may not know at first which experts are available on a particular topic or which other analysts are working on a similar problem. In this case, the information in the analytic tools themselves may be just the input software tools need to recommend people or information sources to consult next. We are studying software tools that support intelligence analysis and other forms of sensemaking around information. Our approach to analytical processes is based on a model for all-source analysis, which we term the Think Loop Model [7][8][13][16] (Figure 1), that has also proved useful in modeling collaborative analysis. This is a notional model that describes the process often seen in such analysis: External data is filtered and collected into a “shoebox” of saved documents. These are processed to build up nuggets of evidence. Either in the analysts’s head or with some external aid, these nuggets of evidence are organized according to some schematized conceptual structures, such as time-lines, maps, or organization charts. Hypotheses are formed and eventually translated into a report or briefing. Taken as a whole, these processes constitute two larger activities: foraging for information [14] and making sense of it. Our system straddles both of these larger activities. The process is not linear, but can proceed top down or bottom up and with many loops. Our CorpusView document collection visualization [4] is our electronic version of a shoebox and the Entity Workspace evidence notebook [3][5][6] is our aid for the evidence, schema, and hypothesis stage of the process. Our system thus addresses the middle part of Figure 1. Figure 2 provides an overview of both tools. Analysts often work the process in Figure 1 by chaining through entities. A name may lead to an organization, which in turn may lead to a project and another name. Discovering, prioritizing, and keeping track of a growing set of entities is one of the difficulties of analysis. The Entity Workspace helps by allowing the analyst to extract entities from text rapidly and to assemble these together into higher level statements. Entities are a natural level for collaboration, so we have extended and evaluated these tools for collaborative situations.
99
Search tools Evidence notebook Reading area
2.1 Entities in Notebooks Analysts think of people, places, things and their relationships. Our first guideline relates to the granularity at which information is viewed and manipulated. Consider this sentence: Oluf Zabani is the owner of the Persian Design Carpets shop in Meszi, Ugakostan.
Collection View
If analyst A saw this sentence in a textbased notebook created by analyst B, the work of understanding and using the information in the sentence would fall almost exclusively on A. Based on capitalization and other cues, A could guess that Oluf Zabani is the name of a person, that Persian Design Carpets is the name of a shop, and that Meszi is the name of a city or region in Ugakostan (a fictional country). Likewise, if analyst A wanted to make use of the information in this sentence, she wouldn’t get much help. To copy the sentence or one of the entities mentioned, she would have to select the desired sequence of characters and use a copy and paste operation. To learn about any known nick names of Oluf Zabani, she would have to search for them or look them up in a database. To find out what other people are connected with him, she might search for articles that mention him one by one and collect other names that appear in those articles. In short, even though she has access to this notebook from analyst B, making use of its information is manual and timeconsuming. In our view, the problem with the received notebook is that it has no structuring at the entity level. Now consider the alternate view of the same sentence shown in Figure 3. This sentence was constructed in Entity Workspace using our snap-together knowledge technique. An analyst viewing the sentence this way sees the text plus several kinds of additional information. First, entity names are contained in a box, to show clearly where the text of each name begins and ends. Text between entities is also enclosed in a box. Each entity box also contains an icon at the left end that indicates the entity type. In this example, a circle indicates a person and a house shape indicates an organization or place. Color and font weight show how important the author thinks each entity is; bold red entities are highly rated. Background color shows selection; the “Oluf Zabani” entity is selected in this example. To make entities easy to import, the system runs an entity extractor over input documents and highlights entities that are found. Entities can then be imported using the entity quick click technique, described previously [3]. This emphasis on entities in the workspace and their snaptogether composition distinguishes Entity Workspace from other knowledge workspaces. nSpace [11][17] uses entities to organize search results in its TRIST information foraging tool and in its Sandbox workspace, but does not provide a snap-together way to capture entity relationships. Jigsaw [15] focuses on representing connections between pairs of entities through its graph and matrix organizations, whereas the Entity Workspace can represent more complex and loosely specified structures. Analyst Notebook [9] provides multiple ways to manipulate and display links between entities, whereas Entity Workspace can also easily group entities and manipulate relationships among higher-level organizations and entity groups. All these systems attempt in their own ways to reduce the cost of manipulating text into organized insight. In addition to providing an enhanced display of notebook mate-
Figure 2. CorpusView (left) and Entity Workspace (right)
As a result of this work, we have developed a set of design guidelines for collaborative analysis tools: 1. Entities. Analysts think of people, places, things and their relationships. Make it easy to view and manipulate information at the level of entities (people, places, and things) and their relationships rather than just text. Create features that reduce the cost of processing entities both for the writer and for the reader of them. 2.
Collapsing Information. Analysts sometimes study a few broad topics and sometimes a single narrow topic. The space available for manipulating information is extremely limited physically, perceptually, and cognitively. Make it possible to collapse information, so that it is still visible, but takes up less space. Make it easy to find and re-find all mentions of a topic, even in collapsed information.
3.
Organizing by Stories. Analysts ultimately “tell stories” in their presentations. Provide a way to organize evidence by events and by source documents so that the story behind the evidence can be represented.
4.
Quiet Collaborative Entity Recommendations. Too much data on the screen is confusing. “Help” must always be available for the analyst but should only be salient when needed. When notifying analysts of the work of other experts, use subtle visual cues in the analytic tools themselves, so the analysts are not interrupted and see the cues at the time when they are most relevant.
5.
Sharing. Reaching a consensus on an analytical task virtually always requires all the analysts involved to be confident they have read all the supporting reports or documents. Support the sharing of document collections.
Based on these guidelines, we built a set of novel collaboration features into our prototype analytic tools. We tested the first prototype on a group of four intelligence analysts at a 3-day formative evaluation at NIST in March of 2007. The results of that evaluation were very positive, particularly for support of collaboration. Based on suggestions from that evaluation, we extended our collaboration facilities further. The resulting prototype is now being tested in a longer-term trial by a group of analysts at SAIC. Early results from that evaluation are promising. In the remainder of this paper, we describe the features of CorpusView and Entity Workspace that support our design guidelines. Next, we describe what we have learned about collaboration tools for analysis from our two evaluations. Then, we discuss our design principles further and speculate on how they may support other forms of collaboration. 2
COLLABORATION TECHNOLOGIES
In this section, we describe our extended versions of CorpusView and Entity Workspace, focusing on the five design guidelines for collaboration that we described above.
100
Figure 3. Snap-together knowledge belief statement.
(a)
(c) (b) Figure 4. Expansion guided by selection highlighting.
rial, the snap-together knowledge notebook also differs from standard text editing in the kinds of interaction that it affords. In particular, a single click anywhere on an entity selects the entire phrase that represents it (so drag selection is not needed). Selection automatically causes highlighting of all instances of that entity in the notebook (without the need for an explicit search operation) to make it easy to see all of the contexts in which it appears. The analyst can also select two entities in the notebook, in which case special highlighting is used to show paragraphs that mention both entities. In addition, an entity can be copied or moved by clicking and dragging, without the need to select it first. Finally, once an entity is selected, a single button click searches for that entity (including spelling variations) in a document collection. While this style of information presentation was originally developed to help individual analysts review their own notes, we have found that it can also help analysts more quickly understand and reorganize information authored by someone else, because it looks enough like an ordinary sentence to be easy to read but is organized into entities so that it is easy to reorganize and interact with at the entity granularity. 2.2 Collapsing Information Analysts sometimes study a few broad topics and sometimes a single narrow topic. Our second guideline relates to collapsing material, when desired, so that it takes up less screen space. In Entity Workspace, entities and comments can be combined into sentence-like structures called belief statements (recall Figure 3). Belief statements allow analysts to express hypotheses. Belief statements, in turn, can be gathered into paragraph-like structures called evidence groups. Evidence groups, in turn, can be gathered into section-like structures called super-groups. Super-groups can be nested to any level. Any group or super-group in the resulting hierarchical structure can be collapsed to hide all of its nested content, or expanded to reveal it again. The ability to collapse and expand information is important for individual analysts because it helps them manage their screen space and helps them focus attention on those details that are currently of interest while hiding others that would be distracting. We believe that collapsing structures can be important in col-
Figure 5: BBN KineViz™ visualizing the entities in a notebook. (KineViz™ software courtesy of R. Bobrow, BBN Technologies)
laboration as well for similar reasons. In particular, they allow the authoring analyst to focus the attention of others and to organize material better within the confines of screen space. However, collapsing structures do introduce the danger that some important material will be missed by the eventual readers of a notebook, if hidden when the notebook is received. To mitigate this concern, our collapsing structures use several semantic zooming [2] mechanisms to help the reader determine when to expand them again. The first is summarization. As shown in Figure 4(a), the two collapsed groups (short wide rectangles) display a textual summary of everything that they contain. For example, the lower one mentions “Oluf Zabani”, “FBI Report 02” and other information. This gives the reader information scent [12] as to what is inside of them. The second mechanism is highlight-guided drill-down. The idea here is to highlight all groups in a hierarchy that contain a selected entity. For example, in Figure 4(a), the reader has become interested in a person named “Heydar Mosei” and has selected his name. All groups containing this entity (at any level) are displayed with an orange background. If a reader clicks the ‘+’ sign on the orange super-group in Figure 4(a), that super-group expands to reveal four child objects in Figure 4(b). Only one of these child objects is highlighted in orange (itself a collapsed group). The reader expands that group to get Figure 4(c) and then reads the group to learn about the entity of interest. We have also found collapsing to be useful when one analyst is copying material from another analyst’s notebook. If many pieces of evidence are to be copied, they can often be collapsed, copied, and then expanded again once they reach the new notebook. This allows an analyst to copy another analyst’s work either in terms of broad categories (super-groups) or in terms of specific evidence on a single narrow topic (evidence groups or belief statements). 2.3 Organizing by Stories and Documents Analysts ultimately “tell stories” in their presentations. The snap-together structures that an analyst builds in Entity Workspace contain enough information to allow it to construct an entity graph structure “behind the scenes”. In the graph, two entities are connected by an edge if instances of those entities appear together in a belief statement or evidence group in the workspace (or if the analyst has indicated that these two entities are so closely related that they should be considered to be “coupled”). Many authors have already written about on-screen presentation of graphs to support their exploration, such as i2’s Analyst’s Notebook [9]. Indeed, such visualizations can be used side-byside with the snap-together notebook system described here; Figure 5 shows the BBN KineViz™ system visualization for an entity graph from an Entity Workspace notebook. Graph visualizations have a number of advantages: each entity appears only once, and good graph visualizations can make it easy to see all of the members of a group at once. However, we decided not to use such visualizations as the primary presentation of evidence in our system for two reasons. In the first place, once the amount of evidence becomes large, such a graph will have many edges, making it hard to see relationships in a presentation that resembles spaghetti. More important from an analyst perspective, the notebook presentation style allows the analyst to organize evidence into self-contained story pieces. This is possible, in part, because any entity can appear any number of times in the notebook, so that the entity is always seen in the context of a storyline. Each appearance of the entity may relate it to a different set of entities and each instance may be contributed by a different source document. For example, in “Oluf Zabani is the owner of the Persian Design Carpets shop in Meszi, Ugakostan,” sometimes the analyst is interested in the shop because:
101
• it is owned by Oluf Zabani and she wants to follow his contacts in other businesses or organizations, • it is owned by Oluf Zabani and she wants to investigate the other shop employees or shareholders, • it is in Meszi, Ugakostan and she wants to follow its links to Abala, Karjakistan, which is right across the river. The analyst separates all these story-lines in her mind and will be confused if all the links from the “Persian Design Carpets shop” are shown on the same link chart. Being able to organize evidence into a story is important for individual analysts, but even more important for sharing collaborative information. Indeed, we believe that analysts want to share both graph information (“tell me what you know about the social network of this individual”) and story- or source-oriented information (“what events lead you to believe these people know each other”? or “what document makes you believe this person works for this company?”). A notebook style of information makes this second kind of information easy to share. Also, a notebook that allows entity graphs to be included as one kind of “evidence” will allow both kinds of information to be shared in a format that is as close to a “story” as possible. In Entity Workspace, we are working to support both kinds of sharing. 2.4 Quiet Collaborative Entity Recommendations Too much data on the screen is confusing. “Help” must always be available for the analyst but should only be salient when needed. The entity graph computed by Entity Workspace from each notebook can become even more valuable once multiple analysts have produced multiple notebooks. In that case we can compute an entity graph from each notebook. Each of these graphs encapsulates one analyst’s perspective on a set of entities, how important they are, and how they are related to each other. If two analysts are studying related topics, it is likely that entity graphs from those analysts will share common entities. In that case, we can combine information from the two entity graphs to recommend to each analyst which notes from the other analyst are likely to be most valuable. For example, simply finding the common entities between graphs allows Entity Workspace to notify one analyst that another analyst is working on the same entities. In addition, if we compare outgoing links from the common entities, we may discover that a remote notebook mentions relationships not yet contained in our notebook. These relationships may represent new facts of interest. We may wish to particularly highlight entities that participate in new facts. Other results can be achieved by combining two (or more) graphs into one larger graph (Figure 6). This graph represents combined knowledge from multiple notebooks (and multiple analysts if the notebooks do not all have the same author). The degree of interest rating of each entity in the final graph can be computed from the ratings in the initial graphs. The system can be used to flag differences, such as entities that are marked as high interest in notebook A, but have a lower rating in notebook B. Such entities may deserve more attention from the author of B. For example, the analyst who created the graph of Figure 6 may discover the new fact that entity C is related to a (highly rated)
Figure 6: Joining two graphs into one.
102
Figure 7: Flag-shaped icons.
entity D not mentioned in his notebook and may also be interested that entity A is rated more highly in another analyst’s entity graph. Entity Workspace uses a spreading activation technique [1] to compute a degree of interest rating for all entities in an entity graph, including those that have not been manually rated by the analyst. It gives entities points if they are connected in the graph to highly rated entities. The process iterates so that entities may be given a higher rating even if they are several edges away from an entity that was explicitly rated highly. This technique can help an individual analyst decide which entities to focus on next. We anticipate that this technique will be even more effective when used on the composite graph constructed from several notebooks. In designing Entity Workspace, we wanted any notifications about information available in other notebooks to be displayed in a reasonably subtle manner, so that it would be clear but not distracting. We decided to add a flag-shaped icon to the entity representations for each entity for which additional information is available in a remote notebook. Entities highlighted in this way look as is shown in Figure 7. In this example, an orange triangle appears near the left end of three entities. When an analyst is working on this section of the notebook, she is probably interested in the entities mentioned there, so she will learn about the availability of additional information about these entities exactly at the moment when that information is most likely to be of interest. In addition to being notifiers, the orange flags are also buttons. When the analyst clicks on the orange flag displayed next to a particular entity, the system displays a menu describing additional information available about that entity in remote notebooks and ways that the information can be displayed. For example, the analyst may have the option to see the entire remote notebook or to see a filtered version of it showing only the remote notes relevant to the selected entity. After making a selection, the analyst can view the remote notes and import them into the local notebook using drag and drop (Figure 8). As shown in the figure, a window onto the remote notebook appears in the local notebook. Drag-and-drop operations can then be used to copy notes into the local notebook at any desired granularity from copying a single entity to copying an entire supergroup in a single operation. 2.5 Sharing Document Collections Reaching a consensus on an analytical task virtually always requires all the analysts involved to be confident they have read all the supporting reports or documents. While our research has largely focused on the evidence notebook as a vehicle for collaborative analysis, we have also discovered value in allowing one analyst to share his/her private document collection with team members. Indeed, working groups of analysts often stop quibbling over assessments after a meeting in which they all bring their source documents and pass them around the table so that everyone on the team can read all the available data. Many technologies already exist for sharing document collections. However, we noticed that several capabilities of our CorpusView system were particularly valuable in the context of collaborative analysis. First, each document placed in a collection is given a URL on the local network. This doesn’t immediately make the documents
Figure 8. Importing remote notes.
shared, as the collection is password protected, but it makes it possible to name the documents in a persistent way. These URLs are then placed in the Entity Workspace notebooks. As a result, an analyst receiving a notebook (and a collection password) from another analyst will be able to follow links in the notebook to the source documents used to make it. Second, CorpusView allows the analyst to organize documents into categories (Figure 9), where document icons are organized by the source of the information. When the collection is shared, so are the categories, making it possible for the receiving analyst to learn the categorization technique of the sending analyst. Finally, CorpusView produces its own index of the documents in the collection, making it easy for the receiving analyst to learn about the contents of the collection by performing searches. Because an analyst’s document collection is generally carefully selected (and the collection of a collaborating analyst is likely on a relevant topic), searching on it will often produce more relevant results than searching on the Web or on a more generic library of intelligence community information. In some of our studies, we noticed that the category structure of the shared collection gives analysts a cheap way to do Boolean searches without explicitly adding “AND” constructs to the query. For example, if one analyst has organized documents into a category about Country X and a second analyst searches that collection with the query “nuclear”, any documents that match the query and are located in the Country X collection are probably about both “nuclear” and Country X. Another subtle but more powerful use of this approach would be to look for sharing of nuclear data among organizations or nations by looking for instances where a particular Country Y scientist appears in the Country X category of the “Nuclear” library and where a Country X scientist appears in the Country Y category of the same library. Other systems, including TRIST [11], use intersecting categories to get this effect in the context of organizing query results. CorpusView does it in the context of a shared collection organized by people. 3
3.1 Laboratory Study Design In this analyst-centered evaluation, no ground truth was available. Therefore, we relied in part on analysts’ subjective feedback; although we did collect quantitative logging data. Because of the growing presence of novices in the analyst workforce, we wanted to investigate whether the tool accommodates the interaction and analytical behaviors of both senior and novice analysts. Therefore, we report findings in terms of senior and novice analysts. Four intelligence analysts participated in the evaluation. Two (A1 and A2) were novice analysts with less than two years of experience, and two (A3 and A4) were seniors with eight or more years as intelligence analysts. Because of the nature of the tools being studied, the NIST team decided to use innovative analyst-centric metrics developed to measure analysts’ interactions with visualization tools and with each other while using such tools [10]. Using these metrics together with classic usability metrics, we logged analysts’ interactions with the tool. A survey contained Likert scale questions using a one to seven point range where one signified worst and seven best. Open-ended questions gave analysts the opportunity to explain their scalar ratings and to share their thoughts on any aspect of the integrated tool. To learn if analysts could build evidence files, we logged the number of entities and comments created and which method was used to create them. To learn if analysts could create schemas, we logged the number of snap-together knowledge events performed including operations to create belief statements, evidence groups, super-groups, and coupled entities. We also developed metrics to measure collaboration. To study analysts’ ability to continue each other’s work, we logged the number of times analysts added to, deleted from, or modified notebooks created by other analysts. We asked analysts if Entity Workspace helped them collaborate with colleagues. We asked if seeing each others’ notes in a shared notebook helped analysts to perform better analysis. Another senior intelligence analyst (who was not one of the subjects) developed two strategic analysis tasks that mimic the types of problems that intelligence analysts must solve in their workplaces. The selected tasks involved answering questions about the probable military strategy, weapons capability, and economic development of a selected country. Each subject was given a computer workstation with two 20inch displays. Training started with an eight minute video overview of the tool. A self-paced onscreen tutorial explained key concepts and major functionality. A competency test asked analysts to show their ability to perform 23 key functions. Four analysts performed Tasks 1 and 2 the first afternoon and most of the second day. Usability engineers observed analysts as they performed their tasks. The observers took time-stamped notes, with-
A LABORATORY TEST ON ANALYSTS
As part of our participation in a government grant program, we had an opportunity to work with the National Institute of Standards and Technology in March of 2007 to perform a formative evaluation of CorpusView and Entity Workspace using intelligence analysts as experimental subjects. At that time, the orange notification flags and the ability to view and import remote notes had not yet been implemented, but the other capabilities described above were in place. We designed the study to provide information both on the suitability of these tools for individual analysis and for collaborative analysis. Once the results of the evaluation were available, we were surprised to see that collaboration support was among the highest rated features of the system. In this section, we briefly describe the experimental design and those results that appear to be most relevant to support collaborative analysis.
Figure 9. CorpusView with categories and search results.
103
Figure 10. Analysts traded workstations twice.
out interfering with analysts’ workflow. To evaluate the ability of the tools to support collaboration, we asked analysts to trade workstations, notebooks, and tasks twice over the course of the evaluation. This process is illustrated in Figure 10. Analysts worked in pairs over three rotations, R1, R2 and R3. Two senior analysts formed one pair of partners; two novices formed another pair. In R1, analysts started work on either Task 1 or Task 2. Within a pair, each partner was given a different task. On the first day, in R2, after having spent two hours on their R1 tasks, partners swapped work stations, thereby swapping tasks. Analysts then continued work where their partners had left off. At the beginning of the second day, in R3, analysts returned to their original workstations and original tasks. 3.2 Laboratory Study Results Our NIST collaborators produced a hundred page long report of the evaluation, detailing results from surveys, analyst observation, logging, final notebooks, and interviews. Here, we present just results most relevant to the collaborative aspects of the system. Entities. Related to our first design guideline (entities in notebooks), we wanted to understand whether analysts were willing to put in the effort needed to create an entity-based notebook. The four analysts imported a total of 359 entities into their evidence files over the 3 rotations. Four techniques were provided to add entities: hand typing, copy and paste, entity quick click (a novel technique described previously [3]) and drag-and-drop. Drag-and-drop was rarely used. Each of the remaining techniques contributed over 100 entities to the total. Analysts varied greatly as to which technique was preferred. Because this evaluation did not compare performance to other approaches, such as text-based notebooks, we do not know how this entity count compares to traditional approaches. However, we did ask subjects to rate the statement “It is easy to copy and paste items into the Evidence Panel” (score: 5 out of 7), and “It is easy to use quick-click to bring items into the Evidence Panel” (score: 6 out of 7). Likewise, analysts were able to use snap-together knowledge features to relate entities to each other. They created 169 belief statements (entity hypotheses), 108 evidence groups, 31 supergroups, and 30 entity couples during the evaluation. The subjects gave a high score to the statement “Snap together knowledge makes it easier to organize information than other tools or methods I currently use” (score: 6 out of 7). There was also good survey evidence that Entity Workspace helps analysts find notes. The statement “The Evidence Panel helps me find notes (e.g., individual entities, belief statements, groups, lists/super-groups) that another analyst or I had taken in the past” received a score of 6.75 out of 7. Collapsing information. Related to our second design guideline, collapsing information, this experiment produced less support. In
104
the final notebooks, only one group is collapsed. We did not log collapse/expand actions, so we don’t know how much this capability was used in intermediate stages. This feature will also be workstation-specific where an analyst working with multiple large computer monitors will have less need to compress information than the same analysts working on a single laptop screen. Furthermore, given that the evaluation took place over a relatively short period of time and produced a relatively small amount of evidence, there was less need to collapse groups than would be the case for longer notebooks. Organizing by stories. Related to our third design guideline (organizing by stories and documents), several results are relevant. One concern we had was that analysts would be more familiar with entity graph-based systems in which each entity appears only once and wouldn’t see the value in the notebook approach. This does not appear to be a problem. The statement “Having some entity names appear more than once in the Evidence Panel is valuable” scored 6.25 out of 7. Given that it is easy in Entity Workspace to put document links into notes and given the ability to find notes again, we would predict that analysts would be able to find the source documents associated with facts. This is fairly well supported. The statement “Entity Workspace helps me remember which source documents provided evidence of a connection between two entities” received 5.75 out of 7. However, some of our feedback suggests that our software or its documentation may stress organization around documents too much. One analyst commented that she “usually organizes data by topic, not by source. Entity Workspace presents information by source.” We are looking into ways whereby the Entity Workspace will mimic traditional methods of sourcing such as footnotes and endnotes, which are standard in research communities from historians to physicists. One of the analysts in our study defines sensemaking as “Putting pieces of a puzzle together and creating a story out of it.” We asked our subjects whether Entity Workspace helped with sensemaking via a series of questions. The response is well summarized by the response to a survey question “Snap together knowledge facilitates sensemaking” which scored 6 out of 7. However, there were suggestions for improvement, including requests for a timeline capability and the ability to represent organizational structures (e.g., org. charts) directly in the notebook. We didn’t test our fourth design guideline (quiet, collaborative entity recommendations) directly in this study. Sharing. Related to our fifth design guideline (sharing document collections), we did get some relevant information. The analysts in the study were all asked to use a document collection that had been prepared by another analyst (who was not a subject) and not to use any other sources of documents. This condition allowed us to test their ability to use the search tool, reading tools, and entity quick click information copying that are all available from CorpusView and Entity Workspace. It was interesting that the novice analysts in this study performed no explicit Boolean queries at all, while the expert analysts performed 14 each. We are intrigued by the idea that the pseudo-Boolean queries enabled by sharing collections that have been categorized may introduce the power of Boolean queries to some analysts who would otherwise do without. This also suggests the value of a shared document collection in providing a rapid means for analysts new to the project – especially novice analysts – to acquaint themselves with previous analysis. 4
TESTING IN THE FIELD (SAIC EVALUATION)
Our next stage of testing is an operational test at SAIC that is taking place in three trials:
•
By grouping evidence under the belief statement in terms of whether is supports or refutes the belief, an analyst can build alternative hypotheses easily in parallel. Also, when working on the evidence supporting the “true” assertion, he can compress the “false” evidence by collapsing and have it available to consider later. The analyst can also easily rearrange the evidence to put the most convincing on the top of the list and the least convincing on the bottom.
•
Figure 11. Proposed Collaborative Think Loop Model
First, in a follow-up to the NIST tests, we are duplicating the NIST conditions, tasks, and time constraints with additional analysts to collect more data to compare on how workspace operation, analyst experience, and time constraints affect analysis using the Entity Workspace. This test is being performed with Entity Workspace on a laptop (with an attached monitor for additional screen space) instead of a workstation with two large monitors, so we expect screen space management to be an issue earlier on. Indeed, we are already seeing heavier use of information collapsing in this trial. Second, we are extending the NIST tests to look at performance on long term analysis. In this test we are using the same dataset as in the NIST test, but giving the analysts varying time deadlines to perform the task. Early results from this trial have shown additional support for our Sharing design guideline. In particular, the senior SAIC analyst (who built the test dataset on a national WMD program over the course of a year in a previous SAIC/PARC experiment) was able to find virtually all the documents relevant to biological warfare in the target nation and build a “storyboard” assessment in less than two hours using only the single search query “anthrax.” While there is obviously a test artificiality involved (the senior analyst actually was the one to collect the five hundred documents in the target nation WMD library), it does indicate the power of the system to allow an analyst to rapidly retrieve thought trains from hundreds of documents and organize them quickly for a presentation/assessment. It also highlights the use of implicit Boolean searching that is possible against an analyst library/shoebox on a single topic. The third trial is studying how Entity Workspace can be used from scratch to build a topic library and build a long-term understanding on that topic. The senior SAIC analyst has begun this task and has already changed his methodology “on the screen” to correspond better with his methodology “in his brain.” By taking advantage of the supergroups (with belief statements and entity groups) feature of the Entity Workspace, he is using that environment directly as a hypothesis testing tool. The resulting methodology lends support to both our Entities guideline and our Collapsing Information guideline. With this methodology, a hypothesis is a belief statement, stating an assertion without any evidence to support it. As such, one can take a task or question and begin with test hypotheses as true/false assertions (“Target nation A has a WMD Program”) or assertion lists (“Biotech companies in target nation A that could grow anthrax are:”). Each hypothesis is inserted into the Entity Workspace as a belief statement and research is begun to test them. As documents are found containing evidence for or against a hypothesis, the evidence statements (from a single sentence to a paragraph) are dragged under the belief statement and dropped as part of a growing evidence group. Preliminary tests indicate that this method can be extended to support hypothesis testing on very complex issues:
As an evidence group grows to contain more than roughly seven evidence statements from source documents, the analyst can reassess them all, find common threads, rearrange the evidence by the common threads, then add new belief statements to each group that are sub-hypotheses of the overall hypothesis. Both of these methods take advantage of the outline-like hierarchical structures created by our entity-based approach. These methods support both individual analysts and collaboration. 5
DISCUSSION OF THE PRINCIPLES
One model that has guided our work on tools for intelligence analysts is the nominal model of sensemaking for all-sources analysts called the Think Loop Model (Figure 1). According to this model, all-sources analysts (analysts who combine multiple kinds of information to understand a topic or answer a question) make sense of information using a process that loops through multiple steps that produce a set of intermediate products. The intermediate products include a “shoebox” (private collection of documents), an evidence file, schemas of organized evidence, hypotheses, and eventually a report. After studying the kinds of collaboration that are possible with modern software tools, we propose a revised version of this model that takes collaboration into account. While analysts have long collaborated with each other through phone calls, correspondence, and by sharing final reports, it is less common for analysts to share their intermediate products. Given our experience, the sharing of intermediate products can have great value. As a result, our revised model (Figure 11) includes channels for sharing intermediate products as a central feature. In the model, sharing can happen in at least two ways, a bottom-up and top-down mode: • In the top-down mode, analysts working together closely share unpolished and even unfinished shoeboxes, evidence files, schemas, and hypotheses. By having partially completed analysis available the analysts can reach back down to collaborators’: (1) shoeboxes to find new documents relevant to the task; and (2) hypotheses (as belief statements) and supporting evidence groups to check alternative hypotheses considered by their collaborators or new evidence for or against a particular belief/hypotheses. In this mode, they will be able to do so directly with synchronous and asynchronous collaboration tools. •
In the bottom-up mode, analysts working less closely may choose to create polished versions of intermediate products that can be shared in libraries of such products, in analogy to the way that topic information is shared on Wikipedia, for example. This allows novice analysts or analysts new to a task (be they novice or expert) to find previous analyses at the schema (Wikipedia or encyclopedia), or theory (presentations or published analyses) level that can be used directly to begin building evidence groups and super-groups based on previous analysts’ work (even if those analysts were not using an Entity Workpace environment). Entity-based notebooks appear to support sharing of evidence files in several ways. First, they make it easier to pick up entities,
105
particularly highly-rated entities in another analyst’s notebook. Second, by comparing entity lists and entity graphs from two notebooks, we are able to recommend the information in remote notebooks with (relatively high confidence). Finally, by making it easy to reorganize material at the entity level, select entire entities, search for an entity in the notebook and in the document collection, and find connections between several entities, these notebooks make it easier to discover those parts of another analyst’s notebook that are of interest to a first analyst. Based on our experience with the longer term (field) evaluation, the ability to collapse information appears to be valuable. By allowing the system to show that information is available without showing all of the details, collapsed groups and super-groups allow an analyst to get more information into a single notebook while still having enough space to work. Highlighting-aided drill down makes it easy to find hidden information once a user selection indicates that it may be valuable. We are confident that analysts want to see evidence both from a story-telling prose-like perspective and from a social network or entity graph perspective. Furthermore, we believe the most value will come if the two perspectives are tightly integrated. An entitybased approach provides a valuable form of integration in which it will be possible to use insights from one perspective immediately to make inferences in the other. For example, selecting a person entity in either an entity-based notebook or an entity graph visualization can cause the entity to highlight in both views, allowing the analyst to follow paths in both the social network and the notebook narrative to make new inferences. While we have not tested our “non-interrupting” notifications on analysts yet, we are confident that they will be less disruptive than pop-up dialog boxes and other temporal notifications. We are interested to see how much they are used and how they might enable new collaborations. Finally, based on our field evaluation, we have evidence that Web-based shared document collections can be of value to collaborating analysts, both because they allow analysts to take advantage of each others information-finding skills and because the organization of the documents into categories supports a kind of pseudo-Boolean search that makes queries more precise with little extra work on the part of the analyst doing the searching. 6
SUMMARY
In this paper, we presented five design guidelines for collaborative intelligence analysis and other forms of collaborative knowledge work. These five guidelines support information sharing, particularly sharing of the intermediate products of analysis (and sensemaking), including document collections, evidence, schemas, and hypotheses. The first four guidelines describe ways to take advantage of explicit representation of entities in shared notebooks. The last guideline describes the value of shared document collections and of the work that goes into organizing them. We described specific technologies based on these guidelines that were developed as part of the Entity Workspace evidence notebook and CorpusView document collection browser. Next we described some first steps in the process of validating these technologies through user studies. The results of a laboratory evaluation at NIST and a field test at SAIC lend support to our belief that these guidelines will lead to improvements in collaborative intelligence analysis and collaborative knowledge work. We are continuing to build on the work here extending it to web-based collaboration and larger-scale collaboration.
106
7
ACKNOWLEDGMENTS
This research was supported in part by Contract N61339-06-C0144 to Stuart Card and Eric Bier from the Intelligence Advanced Research Projects Activity, A-SpaceX Program. We gratefully acknowledge support from our two organizations, the Palo Alto Research Center (PARC) and the Science Applications International Corporation (SAIC). We thank the usability testing team at NIST for their work on the laboratory evaluations reported here, and especially Theresa O’Connell and Yee-Yin Choong who contributed to early drafts of this paper. We also thank all of the analysts who tested CorpusView and Entity Workspace and gave us early feedback on their usability and utility for analysis. REFERENCES [1]
[2]
[3]
[4] [5]
[6] [7]
[8]
[9] [10]
[11]
[12]
[13]
[14] [15]
[16]
[17]
Anderson, J. R., Pirolli, P. L. (1984) Spread of activation. Journal of Experimental Psychology: Learning, Memory and Cognition, 10, 791-798. Bederson, B. B., Hollan, J. D., Perlin, K., Meyer, J., Bacon, D., and Furnas, G. (1996). Pad++: A zoomable graphical sketchpad for exploring alternate interface physics. Journal of Visual Languages and Computing, 1996, 7:3-31. Bier, E. A., Ishak, E. W., and Chi, E. (2006). Entity quick click: rapid text copying based on automatic entity extraction. In Extended Abstracts of CHI 2006, ACM Press, 562-567. Bier, E., Good, L., Popat, K., and Newberger, A. (2004). A document corpus browser for in-depth reading. In Proc. JCDL, 87-96. Bier, E., Ishak, E., and Chi, E. (2006). Entity Workspace: an evidence file that aids memory, inference, and reading. IEEE International Conference on Intelligence and Security Informatics, 466-472. Billman, D. and Bier, E. A. (2007). Medical sensemaking with Entity workspace. In Proceedings CHI 2007, ACM Press, 229-232. Bodnar, J. W. (2003). Warning Analysis for the Information Age: Rethinking the Intelligence Process, Joint Military Intelligence College (JMIC), 2003. Bodnar, J.W. (2005). Making Sense of Massive Data by Hypothesis Testing. In Proceedings of the 2005 International Conference on Intelligence Analysis. i2 Analyst’s Notebook. (2007). http://www.i2inc.com/ O’Connell, T. and Choong, Y-Y. Metrics for measuring human interaction with interactive visualizations for information analysis. In Proceedings of CHI 2008, ACM Press, 1493-1496. Proulx, P., Tandon, S., Bodnar, A., Schroh, D., Harper, R., and Wright, W. (2006). Avian flu case study with nSpace and GeoTime. Proc. Visual Analytics Science And Technology, 2006 , pages 27-34. Pirolli, P., Card, S. K., and Van Der Wege, M. M. (2001). The effects of information scent on visual search in the Hyperbolic Tree Browser. In Proceedings CHI 2001, ACM Press, 20-53. Pirolli, P. and Card, S. (2005). The sensemaking process and leverage points for analyst technology as identified through cognitive task analysis. In Proceedings of the 2005 International Conference on Intelligence Analysis. Pirolli, P., and Card, S. K. (1999). Information foraging. Psychological Review, 106, 643-675. Stasko, J., Gorg, C., Zhicheng Liu, Singhal, K. (2008). Jigsaw: Supporting investigative analysis through interactive visualization. Information Visualization 7: 118-132. Thomas, J. J. and Cook, K. A. (2005). Illuminating the Path: The Research and Development Agenda for Visual Analytics Los Alamitos, CA: IEEE Computer Society Press. Wright, W., Schroh, D., Proulx, P., Skaburskis, A., and Cort, B. (2006). The sandbox for analysts—Concepts and methods. In Proceedings of CHI 2006, ACM Press, 801-810.