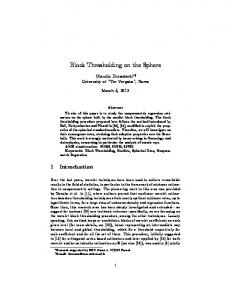
Entropic Thresholding Based on Gray-level Spatial Correlation Histogram Yang Xiao Inst. for Pattern Recognition and Artificial Intelligence, Huazhong Univ. of Sci. and Tech., Wuhan, 430074, P.R.China
[email protected]
Zhiguo Cao* Inst. for Pattern Recognition and Artificial Intelligence, Huazhong Univ. of Sci. and Tech., Wuhan, 430074, P.R.China
[email protected]
Abstract In this paper, an entropic thresholding method based on the gray-level spatial correlation (GLSC) histogram defined by ourselves is presented. Compared with traditional two-dimensional histogram, we take into account the image local property in a different way by GLSC histogram. In experiment, we make comparison of the proposed method with twodimensional entropic thresholding method proposed by Abutaleb and one-dimensional entropic thresholding method proposed by Kapur. The experiment demonstrates that generally our method could yield equivalent or even better result than Abutaleb’s method while saving time remarkably and perform much better than Kapur’s method without too more time consumption.
1. Introduction 1
Image segmentation is an important and fundamental task in image processing. Thresholding is a well-known technique for it. Many thresholding methods have been reported. Of particular interest is an information theoretic approach which is based on the concept of entropy introduced by Shannon in information theory [1]. The first entropic method was proposed by Pun [2]. It was later corrected and improved by Kapur et al.[3]. The concept was further generalized to Renyi’s entropy [4] and Tsallis’s entropy [5]. All the methods mentioned above suffer from one drawback that they do not consider the image spatial 1
This work is supported by the Project of the National Defense Fundamental Research of China under Grant No. A1420061266 and the Project of the National Natural Science Foundation of China under Grant No. 60736010. Zhiguo Cao* is the corresponding author of the paper.
978-1-4244-2175-6/08/$25.00 ©2008 IEEE
Tianxu Zhang Inst. for Pattern Recognition and Artificial Intelligence, Huazhong Univ. of Sci. and Tech., Wuhan, 430074, P.R.China
[email protected]
correlation. Therefore different images with an identical histogram will result in the same threshold value. To mitigate the problem, in Ref. [6], Abutaleb extended Kapur’s method using the two-dimensional entropy. The two-dimensional entropies were calculated from a two-dimensional histogram which was determined by using the gray value of the pixels and the local average gray value of the pixels. Later Sahoo proposed thresholding methods using twodimensional Renyi’s entropy [7] and two-dimensional Tsallis’s entropy [8]. While the extension of onedimensional approaches to two-dimensional histogram results in much better segmentation, it gives rise to the exponential increment of computational time. For comparison, the computational complexity of Abutaleb’s method is O( L4 ) while the computational complexity of Kapur’s method is O ( L3 / 2 ) , where L is the number of gray levels. In order to apply the image local property to thresholding and reduce the time consumption, we propose an entropic thresholding method based on the gray-level spatial correlation (GLSC) histogram defined by ourselves. The GLSC histogram takes into account the image local property by using the gray value of the pixels and their similarity with neighboring pixels in gray value, which is different from two-dimensional histogram in Abutaleb’s method [6]. Our new method is an extension of Kapur’s method [3]. This paper is organized as follows: Section 2 introduces the GLSC histogram. In Section 3, we describe the threshold selection method based on the GLSC histogram. Section 4 presents the experiment on some real-world images and discussion. We draw some conclusions in Section5.
2. Gray-level spatial correlation histogram In this section, we present the gray-level spatial correlation (GLSC) histogram defined by ourselves, which is utilized to describe the image local property. Let f ( x, y ) be the gray value of the pixel located at the point ( x, y ) in a digital image F = { f ( x, y ) | x ∈ {1,2,..., Q}, y ∈ {1,2,..., R}} of size Q × R . For the sake of convenience, we denote the set of all gray levels {0,1,2,..., 255} as G .
Λ
h( k , m ) number of pixels with gray value k and m pixels οf similar gray value in N × N neighborhood = number of pixels in the image
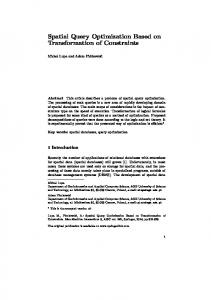
Fig.1 shows the cameraman.bmp image, its original gray-level histogram and GLSC histogram corresponding to N = 3 and ζ = 4 . For object and background are usually the major part in image and their gray value is relatively homogeneous compared with noise and edge, the regions with high m value in GLSC histogram correspond to object or background more probably while the regions with low m value correspond to noise or edge oppositely.
3. Threshold histogram (a) cameraman
(b) gray-level histogram
(4)
selection
using
GLSC
In this paper, our thresholding method is based on Shannon’s entropy and the GLSC histogram. The threshold is computed as follows.
3.1. Computation of background probabilities
the
object
and
The probability function p (k , m) is given by Λ
(c) GLSC histogram Figure 1. Cameraman image, its gray-level histogram and GLSC histogram
The GLSC histogram is computed as follows. For a pixel located at the point ( x, y ) , let g ( x, y ) be the number of the pixels of which the gray value is close to it in the corresponding N × N neighborhood, where N is a positive odd number. The g ( x, y ) is calculated as g ( x, y ) =
N −1 2
N −1 2
∑ ∑ i =−
N −1 N −1 j =− 2 2
?(| f ( x + i, y + j ) − f ( x, y ) | ≤ ζ )
(1)
where
?(| f ( x + i, y + j ) − f ( x, y ) | ≤ ζ ) = ⎧ 1 if | f ( x + i, y + j ) − f ( x, y ) | ≤ ζ ⎨ ⎩0 if | f ( x + i, y + j ) − f ( x, y ) | > ζ
(5)
p ( k , m) = h ( k , m) where k ∈ G and m ∈ {1, 2,..., N × N } .
(2)
While computing the g ( x, y ) , disregarding the N rows from the top and bottom and N columns from the sides. The pixel’s gray value, f ( x, y ) , and g ( x, y ) are used to construct the GLSC histogram using h( k , m) = Prob( f ( x, y ) = k and g ( x, y ) = m) (3) where k ∈ G and m ∈ {1, 2,..., N × N } . The normalized histogram is approximated by using the formula
Thresholding an image at a threshold t is equivalent to partitioning the set G into two disjoint subsets: GA = {0,1, 2,...t} and GB = {t + 1, t + 2,...,255} . Let GA denote object and GB denote background in this
paper. The probability distribution associated with object and background are given by ⎛ p (0,1) p(0, N × N ) p (1,1) p (t , N × N ) ⎞ ,..., , ,... ⎜ ⎟ P ( t ) PA (t ) PA (t ) PA (t ) ⎠ ⎝ A
(6)
and p (t + 1, N × N ) p (t + 2,1) ⎞ ⎛ p (t + 1,1) , ⎜ P (t ) ,..., PB (t ) PB (t ) ⎟⎟ B ⎜ ⎜ ⎟ p (255, N × N ) ,... ⎜ ⎟ ( ) P t ⎝ ⎠ B t
N ×N
where PA (t ) = ∑ ∑ p(k , m) , PB (t ) = k = 0 m =1
255 N × N
∑ ∑ p ( k , m)
(7)
and
k = t +1 m =1
PA (t ) + PB (t ) = 1 .
3.2. Entropic criterion function The principle of entropy is to use uncertainty as a measure of information in a source [1]. We think that noise and edge can yield more information than object
and background in entropic thresholding. So regarding the GLSC histogram as an information source, elements of different m in it should not be treated equally in entropy calculation as in Kapur’s method [3]. In this paper, the entropy calculation of elements in GLSC histogram are weighted by a nonlinear function associated with m and N given by −9 m
Weight ( m, N ) =
1 + e N×N −9 m
(8)
1 − e N×N
where N is a positive odd number and m∈{1,2,...N×N}. Fig. 2 shows Weight ( m, N ) corresponding to N = 3 .
Table.1 lists the optimal threshold values that are founded for the four images for ζ values equal to 0, 1, 2, 3, 4, 5, 6, 7, 8, 9 respectively with neighborhood sizes of 3 × 3 ( N = 3 ). Table.2 lists the time consumption of Kapur’s method, Abutaleb’s method and our method with ζ = 4 and N = 3 . Figs. 3-6 show the original test images and their thresholded results by Kapur’s method, Abutaleb’s method and our method with ζ = 4 and N = 3 . From the above four images and many other images, we conclude that when ζ = 4 , our proposed method produced the best optimal threshold values. For experiment, we ever consider neighborhood sizes of 3 × 3 , 5 × 5 , 7 × 7 , 9 × 9 and 11 × 11 to obtain h(k , m) respectively. Neighborhood sizes of 3 × 3 with ζ = 4 is the best choice. The experiment is executed on the computer of AMD Sempron Processor 3400+ and 1.43GB memory in Matlab R2007a.
5. Conclusions Figure 2. Weight ( m, N ) corresponding to N = 3
Thus the entropies associated with object and background distribution are t
N ×N
H A (t , N ) = −∑ ∑
k = 0 m =1
p ( k , m) p ( k , m) ln( )Weight (m, N ) PA (t ) PA (t )
(9)
p ( k , m) p( k , m) ln( )Weight ( m, N ) PB (t ) PB (t )
(10)
and 255 N × N
H B (t , N ) = − ∑
∑
k = t +1 m =1
Then we use Φ (t , N ) = H A (t , N ) + H B (t , N )
(11) as the criterion function. We obtain our optimal threshold- t ∗ by maximizing Φ (t , N ) . Thus t ∗ = Arg max Φ (t , N ) (12) The computational complexity of our method is O( N 2 × L ) , where L is the number of gray levels.
4. Experiment and discussion In experiment, Kapur’s method and Abutaleb’s method are employed to make comparison with our method. To verify the efficiency of our method, we tested lots of real-world images. For the sake of brevity, we only list four of them. They are bacteria.bmp, brain.bmp, cameraman.bmp and columbia.bmp. Using the original image [ f ( x, y )] , the thresholded image [ ft ( x, y )] is computed using the formula ⎪⎧ 0 if f ( x, y ) < t f t ( x, y ) = ⎨ * ⎪⎩255 if f ( x, y ) ≥ t *
(13)
Based on the gray-level spatial correlation histogram, a new entropic thresholding method is proposed. The experiment demonstrates that our method yielded equivalent or even better results than Abutaleb’s method while saving time remarkably and performed much better than Kapur’s method without too more time consumption generally.
References [1] Cover, T. and Thomas, J. Element of information theory. Jhon Wiley & Sons Inc., 1991. [2] T. Pun., “Entropic thresholding, a new method”, Comput. Graphics Image Process, 1981, pp. 210-239. [3] Kapur, J. N., Sahoo, P. K., and Wong, A. K. C., “A new method for grey-level picture thresholding using the entropy of the histogram”, Comput. Vis. Graph. Image Process.,1985, pp. 273-285. [4] Sahoo, P., Willkins, C., and Yeager, J., “Threshold selection using Renyi’s entropy”, Pattern Recognit., 1997, pp. 71-84. [5] Portes de Albuquerque, M., Esquef, I. A., et al., “Image thresholding using Tsallis entropy”, Pattern Recognit. Lett., 2004 , pp. 1059-1065. [6] A.S. Abutaleb, “Automatic thresholding of gray-level picture using two-dimensional entropies”, Pattern Recognit., 1989, pp. 22-32.
[7] P.K. Sahoo, and G. Arora., “A thresholding method based on two-dimensional Renyi’s entropy”, Pattern Recognit., 2004, pp. 1149-1161. [8] P.K. Sahoo, and G. Arora, “Image thresholding using two-dimensional Tsallis-Havrda-Charvát entropy”, Pattern Recognit. Lett., 2006, pp. 520-528. Table 2. Time consumption of different methods Test Kapur’s Our Abutaleb’s images method method method bacteria 0.0505s 0.4583s 249.0331s brain 0.0534s 0.4313s 245.4439s cameraman 0.0635s 0.3383s 252.9774s columbia 0.0378s 0.3809s 262.4994s
(a) Original image
(b) Kapur’s method, t*=192
(c) Abutaleb’s method, t*=153
(d) Our method, t*=130
Figure 5. Cameraman image and its thresholded image
(a) Original image
(c) Abutaleb’s method, t*=66
(b) Kapur’s method, t*=111
(a) Original image
(b) Kapur’s method, t*=137
(c) Abutaleb’s method, t*=34
(d) Our method, t*=98
(d) Our method, t*=64
Figure 3. Brain image and its thresholded image
Figure 6. Columbia image and its thresholded image Table 1. Threshold values for various values of ζ (a) Original image
(c) Abutaleb’s method, t*=69
(b) Kapur’s method, t*=131
(d) Our method, t*=69
Figure 4. Bacteria image and its thresholded image
Test images bacteria brain cameraman columbia bacteria brain cameraman columbia
t ∗ (0) 70 110 130 135 t ∗ (5) 69 64 130 98
t ∗ (1) 120 64 130 115 t ∗ (6) 69 64 130 98
t ∗ (2) 69 64 130 98 t ∗ (7) 69 64 129 98
t ∗ (3) 69 64 130 98 t ∗ (8) 69 64 126 98
t ∗ (4) 69 64 130 98 t ∗ (9) 69 64 126 98