110
IEEE TRANSACTIONS ON INDUSTRIAL ELECTRONICS, VOL. 54, NO. 1, FEBRUARY 2007
Entropy-Based Choice of a Neural Network Drive Model J. F. Martins, Member, IEEE, P. J. Santos, A. J. Pires, Member, IEEE, Luiz Eduardo Borges da Silva, Member, IEEE, and R. Vilela Mendes Abstract—The design of a neural network requires, among other things, a proper choice of input variables, avoiding over fitting and an unnecessarily complex input vector. This may be achieved by trying to reduce the arbitrariness in the choice of the input layer. This paper discusses the relation between the memory range of a particular controlled dynamical system (induction drive) and the dimension of the neural network input vector. Mathematical techniques of process-reconstruction of the underlying process, using coding and block entropies to characterize the measure and memory range were applied. These modeling techniques provide a precise knowledge of the drive dynamics, a fundamental requirement in modern control approaches. Index Terms—Entropy, induction motor drives, learning systems, modeling, neural networks.
I. INTRODUCTION HE APPLICATION of soft computing techniques to the design of intelligent controllers for electrical drives has revealed promising features. A wide variety of strategies, using artificial neural networks, fuzzy logic, genetic algorithms, and grammatical control, has been reported in the literature [1]–[5]. Variable speed drives, equipped with squirrel-cage induction machines, play a key role in modern industrial applications. The benefits of this type of machine—high reliability and low maintenance—make it widely used in a large number of industrial processes. Typical features of drive systems include a considerable degree of dynamical complexity. They are highly nonlinear coupled systems, with large uncertainties at the structural and parameter levels. They are multidimensional and contain unknown nonlinearities. When fast performance is required for evolving nonlinear systems, classical methods only provide a limited representation of the real system. It becomes necessary to complement, and correct, this classical modeling with other information processing techniques. The behavior of a controlled dynamical system is described by a complex functional relationship (1), where the output variis a function of the inputs and the state variables able . This relationship may also depend on the initial state
T
(1) Manuscript received June 29, 2005; revised April 7, 2006. Abstract published on the Internet November 30, 2006. J. F. Martins, P. J. Santos, and A. J. Pires are with the Laboratório de Sistemas Eléctricos Industriais (LabSEI), Escola Superior Tecnologia de Setúbal, Instituto Politécnico de Setúbal, 2914-508 Setúbal, Portugal (e-mail: jmartins@est. ips.pt;
[email protected];
[email protected]). L. E. B. da Silva is with the Universidade Federal de Itajubá, 37500-903 Itajubá—MG—Brazil (e-mail:
[email protected]). R. V. Mendes is with the Centro de Matemática e Aplicações Fundamentais, 1649-003 Lisboa, Portugal (e-mail:
[email protected]). Digital Object Identifier 10.1109/TIE.2006.888768
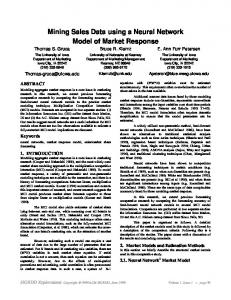
A difficult issue when using neural networks is the selection of the number of nodes in the network. The number of output nodes is determined by the dimension of the model output. However, fixing the number of hidden nodes is a difficult task. The ideal number lies between a lower bound (absence of learning) and a upper bound (memorization of the training data set). One hidden layer is enough to approximate any continuous function [8]. Nevertheless, the number of hidden nodes and layers, required for robust modeling of a complex functional relation, depends on the problem. Two hidden layers are often used, since these networks offer convergence, robustness, and generalization characteristics usually better than one hidden layer network. The number of input nodes depends on the number of arguments of the functional relation (1). For function reproduction, rather than feature extraction, the number of considered hidden nodes is usually higher than the number of input ones, typically one to two times more. So, the higher the dimension of the input layer is, the slowest the network processing becomes. In this way, it is of crucial importance that the input layer should be accurately chosen in order for the neural network to present relatively fast learning without causing any detriment to its learning capabilities. This paper describes an entropy-based methodology to choose an adequate variable argument set for the neural network input layer. II. INDUCTION DRIVE Adjustable-speed induction motor drive systems contribute to worldwide industrial progress by increasing sophistication of factory automation. The electrical drive system, in Fig. 1, consists of a squirrel-cage ac-machine supplied by a current regulated voltage sourced pulsewidth modulated (VS-PWM) power inverter. The power inverter consists of a full bridge diode rectifier (as a DC source), a LC-filter, and the insulated gate bipolar transistor (IGBT) power inverter. This power inverter generates the current that feeds the motor stator coils. Assuming ideal behavior for the three-phase power source and electronic switches and neglecting the magnetic saturation of the induction motor iron, the electrical drive model, obtained from electromechanical power conversion theory, has an argument set of eleven variables (2). denotes the IGBT power inverter commands; the DC voltage; the power rectifier output current; the power inverter input DC current; the induction machine rotor speed; , , , and denote, respectively, the induction machine stator current and rotor fluxes, both in a dq rotating frame with speed and position (2) For operation and security purposes, an internal control loop for the ac-machine stator currents is usually considered. Using
0278-0046/$25.00 © 2007 IEEE
MARTINS et al.: ENTROPY-BASED CHOICE OF A NEURAL NETWORK DRIVE MODEL
111
Fig. 1. Induction motor electrical drive.
online sliding mode current feedback control, which is well adapted to the power inverter structure, and accurately selecting all available voltage vectors in order to minimize the current error [6], [12], it is possible to assume that the stator currents are controlled. Neglecting the power inverter internal dynamics, the behavior of the electrical drive can then be described by (3), where denotes the drive load torque and the speed of the dq frame. The model parameters are the rotor time constant, denoted by ; the mutual inductance, denoted by ; the rotor self-inductance coefficient, denoted by ; the inertia moment, denoted by and the friction coefficient, denoted by . , and denote the stator currents, which are the inputs of the model; and denote the electrical machine rotor fluxes, which are state variables in this model; and denotes the induction machine rotor speed, which is the output of the model
: and , where denotes the number of accessible state variables, the number of nonaccessible state variables, and the number of input variables (5) Assuming that the controlled dynamical system (3) is observ(6) describing the difficult-to-obtain able, there is a function variables in the time sample [7], denoting the present time sample and the number of nonaccessible state variables. This function depends on and , quantities which can easily be obtained. In this way, one obtains the desired functional relation (7), where the output is only a function of accessible variables
(3)
(6)
It is desirable to obtain a functional relation, for the dynamics of the electrical drive system, involving only accessible variables. As accessible variables, one can consider the drive input currents ( and ) and the rotor speed , which can be easily obtained. Other internal variables, such as the machine linking fluxes ( and ) are difficult-to-obtain, being only accessible by observer methods or constructive changes. In this way, these variables are considered nonaccessible. The aim of this paper is to establish the necessary past measurements of the accessible variables, discarding the nonaccessible ones, thus establishing the dimension of the neural network input layer. For this purpose, one needs to consider a set of past measured values of the accessible variables, these past measurements being directly related to the system memory. The drive model (3) can be rewritten in general form (4), where denotes the state variables, the input variables, and the output variable. and are nonlinear functions defined as and , where denotes the number of state variables and the number of input variables
(7)
(4) Using fixed sampling intervals, expression (4) can be rewritten as (5), where denotes the accessible state variables, the nonaccessible ones, the input variables, and the output variable. denotes the present time instant and the posterior time instant. , , and are nonlinear functions defined as ,
This functional relationship is formally the same as (1) considering now fixed sampling intervals and only easy-to-obtain variables. For a dynamical system with , nonaccessible state variables— —one must consider a memory length of the input and accessible state variables as arguments of the desired functional relationship (8) (8) Applying this result to an induction drive model, the problem of measuring nonaccessible variables can be overcomed. This model variable argument set (9) assumes measurements in the previous time samples, considering only accessible variables. However, fundamental problems, such as the large number of variables, good measurement of parameters, and the nonlinearity of the drive system are still present (9) The functional relation (10), representative of the drive model, is only a function of accessible variables with a memory range of , being the number of difficult-to-obtain variables (10) III. ENTROPY CONCEPTS The state of a dynamical system at any given time is partially determined by its history, each new state carrying a certain
112
IEEE TRANSACTIONS ON INDUSTRIAL ELECTRONICS, VOL. 54, NO. 1, FEBRUARY 2007
amount of new information. Any learning-by-examples modeling technique must be able to identify the nonlinear relation (10), whose arguments depend on a number of successive past values. In order to evaluate the influence of the memory range in the input vector, an entropy analysis of the time series may be performed, based on the Kolmogorov–Sinai (KS) entropy. Being this quantity difficult to calculate, from the two-order Renyi Entropy, it is possible to achieve a limit for the KS entropy. For this purpose, a simplified algorithm can be used (SampEn) [10]. For the benefit of the reader, this procedure is detailed described in Appendix I. and The SampEn algorithm is based on (11), where are the probabilities associated to sequences of values of lengths and . If decreases as increases, this denotes signal regularity. It means that to increase the range of past information is redundant and certainly not the best way to explain the signal (11) For the sake of illustration and to control the efficiency of the method, let us consider a simple illustrative example for which the past history is known and easily obtained. For this, take into account the following nonlinear dynamical system (12) with
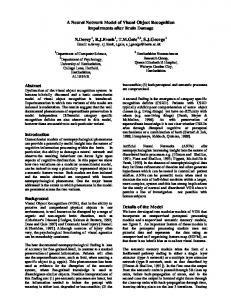
arbitrarily higher because of the statistics [13]. If the SampEn entropy tends to a nonzero value, that means that the system is nonregular [9], and the objective is to look for the falloff of the entropy quantity. Applying the block entropy procedure to system (12), a sufficiently long test was performed, for each number of the hidden variables, randomly changing the input . First, the sequence of system’s output values was coded into a finite grammar. Then, these values are aggregated in blocks of size two, three, four, and so on, etc. For each considered block size, the respective entropy value (11) is computed. Fig. 2 presents this computed entropy values, for the output variable of the dynamical system (12). The entropy tends to a nonzero constant value meaning that the dynamical system is nonregular. There is a falloff which occurs for successively higher values of , as the number of hidden variables itself becomes higher. For each number of hidden variables, denoted by , the falloff occurs at block size . Being the system memory range , one considers the memory range to be , being the block size where the falloff occurs. To model a controlled dynamical system, using only accessible variables, a record of the past evolution should be considered as long as the system memory range. This value is obtained by inspection of the entropy falloff. This simple illustrative example shows the efficiency of the proposed method and gives confidence to the user.
(12) IV. INDUCTION DRIVE NEURAL NETWORK INPUT VECTOR
denotes the state variable vector and is of dimension , being the number of variables difficult-to-obtain. is a , where matrix of dimension , obtained as is a matrix with the first line and the last column equal to zero and the remaining submatrix equal to the identity matrix; is a zero matrix except for the second element of the and . is a zero vector, of dimension first line which is equal to , except for the first element which is equal to 2. denotes the first element of the state vector. Increasing the dimension of the state vector corresponds to include more hidden (difficult-to-obtain) state variables. For example, considering one hidden state variable, the dynamical system becomes (13)
(13) For illustration purposes, one can consider four different behaviors, with potentially distinct memory ranges increasing the number of hidden state variables. The memory range increases, increasing the depth of the measurement needed to accurately model the system evolution. For one hidden variable, one must in order to establish , denoting go back to time sample a memory range of length 2. For four hidden variables, one must in order to establish , denoting go back to time sample a memory range of length 5. In order to apply the block entropy procedure, a grammatical coding of the system’s output variable should be used for blocks of successively higher size. Of course, this size cannot be
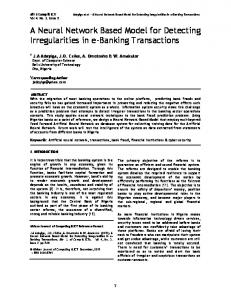
As mentioned before, the electrical drive system consists of an induction motor drive with a variable mechanical load (Fig. 3) and a current controlled VS-PWM power inverter, the rotor speed being the relevant output variable. The induction motor is a 380 V/50 Hz, 2200 W, three-phase squirrel-cage motor, with two pairs of poles, 1410 rpm of nominal speed, . Fig. 3 shows the nominal current of 5.2 A, and several components: 1) DC power supply; 2) electromagnetic brake; 3) induction motor; 4) VS-PWM power inverter; and 5) personal computer for data acquisition. The neural network model of the drive is inferred from the input/output experimental information. Assuming that the input stator currents are controlled, a representative training data set containing a combination of different magnitudes and frequencies, is shown in Fig. 4 (all variables are depicted in pu units). Considering the difficult-to-obtain variables not measured, the functional relation (10) is considered. In this way, the neural network model of the induction drive has the variable argument set (9) as input vector. As there are two difficult-to-obtain vari), one should expect the neural ables (the rotor fluxes network to have an input layer with dimension 9. However, this dimension will be established with the aid of the block entropy analysis. Since the functional relation depends not only on the drive rotor speed but also on the machine stator currents, the entropy analysis should not be done exclusively on the speed signal, but also include the current signals. In order to perform the block entropy analysis, a new signal was created considering the time . evolution of the accessible variables Whenever entropy computation is performed, one must usually
MARTINS et al.: ENTROPY-BASED CHOICE OF A NEURAL NETWORK DRIVE MODEL
113
Fig. 2. Entropy evolution for blocks of size k [dynamical system (12)] for: (a) one, (b) two, (c) three, and (d) four hidden state variables.
Fig. 4. Induction drive working domain coverage of the training data set. Fig. 3. Induction motor electrical drive experimental setup.
consider an alphabet, so that the computing process can be realistically handled. This alphabet must be closely related with the desired description of the signal (qualitative and/or quantitative) and with the desired control requirements of the system signal was discretized according (desired band error). The of 60 symbols. This discretization allows to an alphabet a satisfactory representation of the drive evolution. As found in the past, a smaller number of symbols allows a qualitative representation of the drive evolution but not an accurate one [4]. The whole signal length is, thereby, translated by means of this alphabet and the series described by symbol sequences
, where are the alphabet symbols. To simplify the neural network learning process, the entropy analysis will establish if a smaller dimension input layer can be considered. Considering the training data set presented in Fig. 4, the correspondent entropy analysis is presented in Fig. 5. Coding and computing block entropies, as presented in Fig. 5, allows an estimation of the effective memory range of the process. The graph of Fig. 5 shows the entropy values signal. It clearly shows the short-term computed for the memory of this signal, in the sense that the next value depends essentially on the information related to the previous time sample. Therefore, it may be assumed that the information
114
IEEE TRANSACTIONS ON INDUSTRIAL ELECTRONICS, VOL. 54, NO. 1, FEBRUARY 2007
Fig. 5. Entropy evolution for blocks of size k (electrical drive).
Fig. 6. Run-up type neural network model response.
based on many past values is of little importance and that the main focus should be on incorporating into the neural network the information regarding the previous state. The analysis of block entropies has revealed that the use of long chains of past values does not result in any sort of advantage in the design of the argument set of variables to be fed to the neural network. Moreover, it contributes to an overparam, the eterization of the model. The falloff occurring for system memory range is 2. In this case, the accessible variables, condensed on the signal , should be considered in a memory . The arguments of the functional relation range of time sample and the simpli(10) should also consider the fied argument set of the drive functional relationship (14) is the neural network input layer
In Fig. 8(b), a band error of 2,97% is obtained with a standard deviation of 0,31. This is a particularly important feature, since it allows the simplification of the neural network input vector.
(14) V. NEURAL NETWORK LEARNING To check the dependence on the input layer size, a two-hidden layer network was considered, with sigmoid transfer function for the hidden layers and linear transfer function for the output layer, trained with the learning through examples of the errorbackpropagation algorithm. The simplified argument set in functional relationship (14) was considered as input vector with the training data set in Fig. 4. Fig. 6 shows the neural network model response for a run-up type speed variation, where the motor speed is depicted in gray and the neural network response is depicted in black. The results are quite satisfactory, in the sense that there is no need to take into account the complete argument set in functional re, when learning through examples lationship (10), with algorithms are considered. A different test data set was used to confirm the previous results. Fig. 7 shows the drive rotor speed evolution and the test data (large black line) relative position within the training set (thin gray line). It is seen, from Fig. 8, that the similarity of the results allows us to consider the functional relation with the simplified variable argument set (14) to achieve a good representation of the drive speed dynamics. For example, with the use of the com, the error band is plete variable argument set (10), with only improved by 14%. The results in Fig. 8(a) present a band error of 3,40% with a standard deviation of 0,41.
VI. CONCLUSION AND REMARKS The relation between the memory range of a controlled dynamical system (induction drive) and the dimension of the model neural network input layer was discussed. This paper proposes an entropy-based procedure to determine the dimension of the input layer for neural network drive modeling. To reduce the size of the input layer, the concept of memory range (through block entropies estimation) has been used, the aim being to have input layers of smaller dimension, thus avoiding model overparameterization. The results presented in this paper validate the use of the entropy concept to estimate the dynamical system memory range. This is an important feature when it is difficult-to-obtain all state variables, that being often the case when electrical drives are considered. The use of a simplified argument set that considers only input/output variables was discussed. The experimental results that were obtained show that the dimension of the neural network input layer vector is consistent with the memory range given by the entropy analysis. APPENDIX The mean rate of information creation, also known as the KS entropy, is a useful parameter to characterize the dynamics and is defined by (15)
(15) Consider a discrete dynamical system with a trajectory de, which is sampled with a period . noted by is the joint probability for the trajectory to be in the to be in the “box” at time , “box” at time , to be in the “box” at time [10]. and For a regular dynamical system, the KS entropy is zero. If is a nonzero constant that means that the system has some , the system would be purely chaotic behavior. For random [10]. However, “real-world” time series are of finite length and the KS entropy cannot be estimated with reasonable precision. Grassberger and Procaccia [10] propose the calculus
MARTINS et al.: ENTROPY-BASED CHOICE OF A NEURAL NETWORK DRIVE MODEL
115
Fig. 7. Test data set. (a) Rotor speed time evolution. (b) Relative position to training data set.
Fig. 8. Neural network speed-error evolution with input layer. (a) fi ;i ; ! g. i
of a second-order entropy , which is a lower bound for the entropy . is then a sufficient condition for the system to be nonregular. , the -order Renyi entropy (16) is used [10] To compute
(16) and , the Renyi entropy becomes Setting . Grassthe second-order entropy. Also, berger and Procaccia [10] propose an approach to compute for a dynamical system. For discrete temand several degrees poral series, with several dimensions , Grassof freedom berger and Procaccia [10] establish that is approximately equal to an “experimental” estimator , where is given by (17)
(17)
;i
;! ;i
;i
;!
g. (b) fi
;i
;! ;i
;i
;!
;
For very small , the estimator (11) has order . To predict the variable trajectory, it is not necessary to analyze all degrees of freedom [11]. Using only one degree-of-freedom (17) is replaced by (18)
(18)
Considering and for , (19) and (20) are obtained
,
, (15)
(19) (20)
For a single variable time series, the trajectory can be estimated by (21) and (22), where and are two consecutive estimators. The SampEn approach is a simplification , when applied to finite series, and is reof the KS entropy [10]. lated to the second-order entropy
116
IEEE TRANSACTIONS ON INDUSTRIAL ELECTRONICS, VOL. 54, NO. 1, FEBRUARY 2007
In this way, one can used the SampEn [9] algorithm to analyze a generic dynamical functional relation (1), when the available experimental data is of finite length (21) (22)
REFERENCES [1] P. Vas, Artificial-Intelligence-Based Electrical Machines and Drives. New York: Oxford, 1999. [2] S. Mondal, J. O. P. Pinto, and B. K. Bose, “A neural network based space vector PWM controller for a three-level voltage-fed inverter induction motor drive,” in Proc. IEEE IAS Annu. Meet. Conf. Rec., Chicago, IL, 2001, pp. 1679–1686. [3] K. Itoh, M. Iwasaki, and N. Matsui, “Autonomous motion controller design using genetic algorithms,” in Proc. Proc. IEEE IAS Annu. Meet. Conf. Rec., Chicago, IL, 2001, pp. 915–920. [4] J. F. Martins, J. A. Dente, A. J. Pires, and R. V. Mendes, “Language identification of controlled systems: Modelling, control and anomaly detection,” IEEE Trans. Syst., Man, Cybern. (Part C), vol. 31, no. 2, pp. 234–242, May 2001. [5] B. K. Bose, Modern Power Electronics and AC Drives. Englewood Cliffs, NJ: Prentice-Hall, 2002. [6] J. F. Martins, A. J. Pires, and J. F. Silva, “A novel and simple current controller for three-phase PWM power inverters,” IEEE Trans. Ind. Electron., vol. 45, no. 5, pp. 802–805, Oct. 1998. [7] J. F. Martins, A. J. Pires, and J. A. Dente, “A choice of variables in automatic modelling of AC-drive systems,” in Proc. PEMC, Prague, Checkz Republic, Sep. 1998, pp. 5.7–5.12.. [8] G. Cybenko, “Approximation by superpositions of a sigmiodal function,” Math. Control, Signals, Syst. 2, pp. 303–314, 1989. [9] M. Costa, A. L. Goldberger, and C.-K. Peng, “Multiscale entropy analysis of complex physiologic time series,” Phys. Rev. Lett., vol. 89, no. 6, pp. 068102–068102, Aug. 2002. [10] P. Grassberger and I. Procaccia, “Estimation of the Kolgomorov entropy from a chaotic signal,” Phys. Rev. A28, pp. 2591–2593, 1983. [11] ——, “Characterization of strange attractors,” Phys. Rev. Lett., vol. 50, no. 5, pp. 346–349, 1983. [12] M. C. Kazmierkowski, M. P. Dzieniakowski, and W. Sulkowski, “A novel space vector based current controllers for PWM-inverters,” Trans. Power Electron., vol. 6, no. 1, pp. 158–166, Jan. 1991. [13] R. Mendes, R. Lima, and T. Araújo, “A process-reconstruction analysis of market fluctuations,” Int. J. Theor. Appl. Fin., vol. 5, no. 8, pp. 797–821, 2002.
J. F. Martins (M’96) was born in Lisbon, Portugal, in 1967. He graduated in electrical engineering at the Instituto Superior Ticnico (IST), Technical University of Lisbon, in 1990. He received the M.Sc. and Ph.D. degrees in electrical engineering from the Instituto Superior Ticnico (IST), Technical University of Lisbon, in 1996 and 2003, respectively. Currently, he is a Professor at the Department of Electrical Engineering, Superior Technical School of Setúbal, Polytechnic Institute of Setúbal, Setúbal, Portugal, and is an invited Auxiliary Professor at the Physics Department, University of Évora, Portugal. He has published more than 15 scientific articles in refereed journals and books and more than 20 articles in refereed conference proceedings. His research areas are in control of electrical drives, advanced learning control techniques for electromechanical systems, grammatical inference learning algorithms, and nonlinear systems.
P. J. Santos was born in Lisbon, Portugal, in 1963. He received the B.S. degree in electrical engineering from the Instituto Superior de Engenharia de Lisboa (ISEL), in 1988, and graduated at the Instituto Superior Técnico, Technical University of Lisbon (IST-UTL), Lisbon, Portugal, in 1992. He received the M.Sc. degree in electrical engineering from IST-UTL, and the Ph.D. degree in electrical engineering from the Faculty of Science and Technology, University of Coimbra (FCTUC), in 2005. His employment experience include Portuguese’s CETEC and ENELEC. He is currently an Adjoint Professor in the Department of Electrical Engineering, Superior Technical School of Setúbal, Polytechnic Institute of Setúbal, Portugal. His current research interests are load forecasting, demand-side management, energy planning, electricity market transformation, and deregulation.
A. J. Pires (M’05) graduated in electrical engineering from the Instituto Superior Ticnico (IST), Technical University of Lisbon, Lisbon, Portugal, in 1985. He received the M.Sc. and Ph.D. degrees in electrical engineering from the Instituto Superior Ticnico (IST), Technical University of Lisbon, in 1988 and 1994, respectively. Currently, he is a Coordinator Professor in the area of Electrical Engineering at the Polytechnic Institute of Setúbal, Setúbal, Portugal, and is an invited Associate Professor at the Physics Department, University of Évora, Portugal. His research areas are in electrical machines, power electronics, intelligent control systems for electrical drives, and nonlinear systems.
Luiz Eduardo Borges da Silva (S’84–M’89) was born in Passa Quatro, Minas Gerais Brazil. He received the B.S. and the M.S. degrees in electrical engineering from Escola Federal de Engenharia de Itajubá, Itajubá, MG, Brazil, and the Ph.D. degree from the Ecole Polytechnique de Montreal, Montreal, QC, Canada, in 1977, 1982, and 1988, respectively. From 1988 to 1992, he was Head of the Department of Electronics, Escola Federal de Engenharia de Itajubá. During 1998, he held a Visiting Professor position in the Department of Electrical Engineering, University of Tennessee, Knoxville. He currently teaches power electronics, digital control systems, and digital signal processing at Universidade Federal de Itajubá, UNIFEI, where he is also with the Power Electronics Group. He is the author or coauthor of several congress and journal papers. His main research interests are applications of artificial intelligence in power electronics and signal processing.
R. Vilela Mendes received an Electrical Engineering degree from the Technical University (IST), Lisbon, Portugal, the Ph.D. degree in physics from the University of Texas, Austin, and the Habilitation in Mathematics from the University of Lisbon. He is currently a Senior Researcher at the Technical University of Lisbon and a member of the Center for Mathematics and Applications (CMAF), University of Lisbon. He has been a Visiting Researcher at CERN, CNRS (Marseille), IHES (Bures), and the Univerity of Bielefeld. He was co-organizer and collaborator of several international research projects on Theoretical Physics and the Sciences of Complexity. He is a correspondent member of the Lisbon Academy of Sciences. Over the last few decades, he has worked in the areas of nonlinear dynamics, quantum theory, stochastic processes, and mathematical economics. His current research interests center on quantum control and computing, the physics of complexity, mathematical economics, and nonperturbative methods in field theory.