Hindawi Publishing Corporation Mathematical Problems in Engineering Volume 2013, Article ID 903951, 12 pages http://dx.doi.org/10.1155/2013/903951
Research Article Environmental Perception and Sensor Data Fusion for Unmanned Ground Vehicle Yibing Zhao,1 Jining Li,2 Linhui Li,1 Mingheng Zhang,1 and Lie Guo1 1
State Key Laboratory of Structural Analysis for Industrial Equipment, School of Automotive Engineering, Dalian University of Technology, Liaoning 116024, China 2 Digital Arts Department, Dalian Neusoft Institute of Information, Liaoning 116023, China Correspondence should be addressed to Yibing Zhao;
[email protected] Received 29 March 2013; Revised 30 September 2013; Accepted 1 October 2013 Academic Editor: Valentina E. Balas Copyright © 2013 Yibing Zhao et al. This is an open access article distributed under the Creative Commons Attribution License, which permits unrestricted use, distribution, and reproduction in any medium, provided the original work is properly cited. Unmanned Ground Vehicles (UGVs) that can drive autonomously in cross-country environment have received a good deal of attention in recent years. They must have the ability to determine whether the current terrain is traversable or not by using onboard sensors. This paper explores new methods related to environment perception based on computer image processing, pattern recognition, multisensors data fusion, and multidisciplinary theory. Kalman filter is used for low-level fusion of physical level, thus using the D-S evidence theory for high-level data fusion. Probability Test and Gaussian Mixture Model are proposed to obtain the traversable region in the forward-facing camera view for UGV. One feature set including color and texture information is extracted from areas of interest and combined with a classifier approach to resolve two types of terrain (traversable or not). Also, three-dimension data are employed; the feature set contains components such as distance contrast of three-dimension data, edge chain-code curvature of camera image, and covariance matrix based on the principal component method. This paper puts forward one new method that is suitable for distributing basic probability assignment (BPA), based on which D-S theory of evidence is employed to integrate sensors information and recognize the obstacle. The subordination obtained by using the fuzzy interpolation is applied to calculate the basic probability assignment. It is supposed that the subordination is equal to correlation coefficient in the formula. More accurate results of object identification are achieved by using the D-S theory of evidence. Control on motion behavior or autonomous navigation for UGV is based on the method, which is necessary for UGV high speed driving in crosscountry environment. The experiment results have demonstrated the viability of the new method.
1. Introduction Due to the special value of military, the developed countries have researched autonomous driving car since the 1970s. At present, the United States, Germany, and Italy stand for the forefront of feasibility and practical application aspects. In 2000, the plan named Demo III of USA mainly developed the technology which was based on stereovision environment perception. Thus no matter in the day or night the Unmanned Ground Vehicles can achieve higher speed in the complex cross-country environment [1]. The key technology of this research program focuses on how to improve the ability of obstacle’s classification, for instance, how to classify bushes, rocks, grass, and water region for UGV’s automatic identification, which is playing significantly important role in the development of military utility in the future. As a matter of
fact, the speed of autonomous vehicles is seriously restricted, since three-dimensional point cloud data acquisition and features matching are fairly sluggish based on stereovision. In 2007, the United States DARPA held a named “urban challenge” grand prix in Los Angeles. All autonomous driving vehicles were required to avoid obstacles, obey the traffic signal, and integrate the general traffic in the urban environment. Also, autonomous driving vehicles can automatically avoid other vehicles in this journey of 96 km—long urban model. Finally six vehicles arrived at the end point [2]. In 2009 the United States Jet Propulsion Laboratory announced obstacle detection including trunks, branches, excessive slope, negative obstacle, and water region only based on stereovision. According to each stereovision image it established a simple map, and the tag unit of the map showed the non traversable area where obstacles exist. Also the terrain
2 height, terrain classification, and terrain roughness were showed there. As an additional part, the terrain passing ability and the traversable value of the map were computed [3]. In July 2010, led by Professor Alberto Broggi from the University of Parma, the autonomous driving team started from Italy, lasted for 98 days, and fulfilled the journey of 13000 kilometers. They withstood mountain, desert, blizzard, and other tests, arrived in EU Pavilion at Shanghai World Expo safely. This verified how the humans use their own efforts in innovation to make the ideal named “city better life” into reality step by step. So, the technology of cross-country environment perception has made great progress in foreign developed countries [4]. It is necessary for us to fulfill this research results with independent intellectual property rights in the cross-country environment. The key technology of autonomous navigation contains environmental perception, path planning, and motion control. We should carry out some deep discussion and extensive research immediately. Liu Chunfang, a master of Jilin University, proposed to use texture analysis method for the identification of typically simple slope obstacles in cross-country environment and tell the inclination information about slope in April 2008 [5]. But the types of slope are various in cross-country environment and the texture characteristics are fairly different. Therefore, based on the method, the identification of slope obstacles robustness needs further discussion. Cong et al. extracted the MGD from the V-disparity image based on maximum energy method and then used the coarse-to-fine idea to detect the obstacle and help decide whether the UGV can avoid the obstacle in unstructured environment [6]. In order to make the UGV more suitable for more complex terrains, the obstacle detection algorithm should be improved in the future, as such, the laser sensor data may be integrated with the vision information. Wang et al. put forward one new segmentation method to identify the object based on color and texture features in complex background with green trees. Color images can be expressed in various color spaces. Therefore, segmentation based on color image can overcome some shortcomings of gray-scale image [7]. Hu and Wu suggested to integrate the restrictions of height, continuity and slope information. They used region growing method to detect the obstacles from the disparity image correctly and robustly, which contributed to avoid the interference of the noise [8]. Iyidir et al. raised an adaptive obstacle detection method based on monocular color vision and an ultrasonic distance sensor. This vision-based obstacle detection algorithm comes from a powerful background subtraction algorithm: visual background extractor (ViBe) [9]. Also China held intelligent vehicle competitions in Xian in 2009 and in 2010 separately. Many teams participated including National University of Defense Technology, Tsinghua University, Nanjing University of Science and Technology, Xi’an Jiao Tong University, Shanghai Jiao Tong University, Hunan University, Wuhan University, The Academy of Armored Forces Engineering, Hefei Institute of Physical Science CAS, Institute of Military Traffic, and Institute of Advanced Manufacturing Technology. Each of the participating team suffered from double test named “basic ability test” and “complex” comprehensive environmental test
Mathematical Problems in Engineering in the match which last for three days. The basic abilities included traffic sign recognition, driving around the curve corners, and driving ability of assigned point parking basic autonomous. However, the complex environment comprehensive test mainly represents the ability of autonomous driving vehicle in athletic process, which includes identification of traffic signs, integrating control of motor vehicles, and the ability of using the signal light device correctly, even more, telling road traffic situation comprehensively, and deciding whether to go ahead or not [10]. From 31 October to 1 November, the “Future Challenge 2012” was successfully held in Ongniud Banner, Chifeng City, Inner Mongolia Autonomous Region. The competition brings 14 vehicle fleets together from 12 domestic universities and scientific research institutions, not including another 6 vehicles working as judges and providing technologic support. The competition journey contains 6.9-kilometerlong city road in Ongniud Banner and 16-kilometer-long sections in Yu Long Sha Lake countryside road with two sections, which is mainly used to carry on unmanned vehicles safety maintenance [11]. Actually, most of UGV research still suffers from some difficulties in practical applications, such as complex calculation and object detection. In this paper another approach, D-S evidence theory, is employed to distinguish objects efficiently and reduce the computational complexity. The environment perception system of Unmanned Ground Vehicles (UGVs) can perceive hazardous region and recognize the obstacle. On the whole, Kalman filter is used for lowlevel fusion of physical level, thus using the D-S evidence theory for high-level data fusion. The purpose of the lowlevel information fusion is unifying the characteristics of the sensor data to the framework of information fusion system and integrating these features to generate more precise and detailed information characteristics. The most important bright spots of D-S theory is that the model is designed to cope with varying levels of precision and no further assumptions are needed. It also allows for the direct representation of system uncertainty where an imprecise input can be characterized by a set or an interval and the output result is also a set or an interval [12, 13]. This paper is organized as follows. Section 2 introduces the hardware description. Section 3 shows information related to sensor data procession. Section 4 presents data information of fusion and focuses on the calculation method of BPA mass value including algorithm preparation and correlation coefficient calculation. Sections 5 and 6 have the results and conclusions.
2. Hardware Description Unmanned Ground Vehicle of DLUT is refitted from New Concept Vehicle of Cherry. A platform is provided above the panel roof to mount perception sensors. In order to achieve the autonomous navigation, we add the general electric 24 volt-DC motor for the brake and steering system, respectively, and control accelerator system by using stepping motor. Color and analog FLIR cameras are used for estimating terrain composition. All of those hardware tools utilize
Mathematical Problems in Engineering
3
CCD 3D scanner
The UGV of DLUT
Power control unit and screen
The industrial PC and battery
The steering system and motor
The accelerating system and stepping motor
The brake system and motor
Figure 1: The UGV’s perception system and other refitted systems.
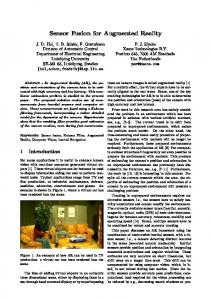
the same autonomous computing unit lying in the UGV. A national inertial navigation system MIN-900-3D and GPS DH2000e receiver provide global position estimation. Data from an inertial measurement unit (IMU) and differential global position system (DGPS) is combined to provide absolute positioning accurate within 1.5% of distance. Power is provided by 12-volt-DC batteries group. The DLUT environment perception system consists of two AVT F-033B/C color cameras mounted to camera brackets, one real-time laser radar (SICK-221), one American UNIQ USS-301 infrared camera, and one ADVANTECH IPC-610H industrial PC. The camera brackets are equipped to the UGV’s top mounting platform with shims that provided a 10∘ down tilt. Laser radar is mounted to the bumper with horizontal forward-looking scanning field of view. Figure 1 shows a picture of the UGV’s perception system and other refitted systems mounted to the New Concept Vehicle of Cherry.
3. Sensor Data Precession Specifically speaking, in order to avoid obstacles safely, UGV must be able to accurately detect the terrain, that is, impenetrable region and autonomous parking within particular safety range, and then take appropriate intervention driving behavior. The UGV’s environment perception system should recognize and classify the possible obstacles in advance since the UGVs are normally faster. Laser sensor is used for obstacle avoidance, when UGV is driving at middle or low speed. The laser sensor is angled downward to scan the terrain in front of the vehicle as it moves. The UGV possesses a 3D point cloud over time acquired by laser sensor, and the point cloud is analyzed for drivable terrain and potential obstacles. By adjusting the initial angle of laser scanning and the resolution of point cloud data that are collected, it can be estimated that the maximum effective range for detecting obstacles in each laser image is about 14 meters, which is sufficient to
real-time obstacle avoidance with the speed of 20 km/h. The collecting speed of laser data with image is fairly slow. To make up the problem, color camera is used for detecting the traversable region within the range of 14 meters, instead of applying the laser range data. Thus, UGV can quickly detect obstacles and probably walk around at the speed of 36 km/h when there are no obstacles. It is different from the general image understanding problem, because the common image processing method does not obtain 3D data set information belonging to the closer travelable region based on laser sensor. The UGV from DLUT employs the Probability Test to analyze the traversable region based on laser data and then detects the corresponding traversable terrain nearby by means of mapping the traversable surface into the camera image. Adaptive visual algorithm is explained by the Gaussian Mixture Model based on the color information of traversable region. All the image pixels within the closer region of traversable surface are used for the training samples. Then, the trained Gaussian Mixture Model is used to analyze the coming camera images. Once the camera image is classified, it will be mapped into the corresponding 2D map from the laser data information. Meanwhile, another benefit is that the scope of the environment perception was extended obviously. Figure 2 illustrates the working procedure of UGV working in the cross-country environment. Obstacle detection based on laser point cloud data can be categorized as classification problems. The Probability Test helps decide whether the current region is traversable or not, by means of searching the target point within adjacent areas in the 2D lattice map. The first-order Markov model is employed to correct the systematic error. The key step of detecting traversable region based on Probability Test is the parameter adjustment, including the barrier height threshold, probability threshold of statistical, and the unknown parameters of Markov model, such as the various error parameters of Markov chain (the covariance and measurement noise). The discriminated type learning algorithm contributes to the local
4
Mathematical Problems in Engineering
Road environment image
Projection mapping
Laser image (2–14 m)
Vision image (2–40 m)
Short distance running surface
First-order Markov Model
Gaussian Mixture Model
Probability Test Separate laser image of running
Separate vision image of running
Register
region and obstacles region
region and obstacles region
Involved in the control of speed
Characteristic evidence extraction
D-S evidence theory Personal identification of
+ GPS, IMU
obstacles
Environment perception map
No Speed < 20 km/h Yes Environment perception map to the path planning module
Figure 2: The workflow of UGV working in cross-country environment perception.
optimization of these parameters. And the learning algorithm is based on theory named by “coordinate ascend method.” The value of each parameter will be changed with a fixed amount after being given the initial assumption, to determine whether the new parameter value is better than the older one. If yes, the next step is to retain the new parameter value. The laser point cloud data is not the only source of obtaining terrain information. UGV can also detect the traversable terrain by mapping 3D laser data into the camera image related to the region. To put it more plainly, we extract traversable region in front of the UGV in the 2D lattice map based on camera image and then decide the corresponding traversable terrain by means of the geometric projection method. Adaptive visual algorithm establishes the Gaussian Mixture Model based on the color information of traversable region, using all image pixels within the range of traversable terrain for training sample. Each mixture model is the Gaussian Model defined by the individual pixel in RGB color space. When new images are detected, the pixels within the range of traversable terrain are mapped into
the K-local Gaussian Model by using the EM method. The K-local Gaussian Model incorporates the learning algorithm, and there are two ways to make the different color image adaptable. One is to adjust the internal Gaussian Model and make it more adaptable for actual image pixels, which can help the UGV gradually adaptable for the change of light. The other one responds to the new Gaussian Model that is different from the elder one, which is based on the color information decided by material of terrain. For instance, if the UGV walks around on asphalt or nonasphalt (off-road) terrain, the color information related to terrain material is obviously different. Based on the information from the single CCD and laser 3D data, feature vectors related to obstacle are extracted, which include the edge chain-code curvature from the color image, the penetrability capability of the laser point cloud, and the main component analysis of covariance matrix. Specifically, it is shown that the edge of shrub or herb image is irregular since its leaves and branches are always protuberant. The edge of shrub or herb in the monochrome
Mathematical Problems in Engineering
5
Value versus saturation in water region
1.0
1.0 0.8
0.6 0.6
Value
Value in water region
0.8
0.4 0.4 0.2 0.2 0.0 0.0
0.0 0.0
0.2
0.4 0.6 Saturation in water region
0.8
0.2
1.0
0.4 0.6 Saturation
0.8
1.0
Land region Water region
(a)
(b)
(c)
(d)
Figure 3: Statistical analysis of saturation, value, and hue of water and terrain region.
images looks like sawtooth shape since its leaves and branches are always protuberant. In this case, chain-code tracing from the thinning image represents the edge feature of shrub or herb, which is described by the variation of the edge’s curvature value. In general, the edges of tree trunk images are almost nearly parallel after image processing. The camera can provide the color image and visible monochrome images according to each color band, depending on the requirement of the application. The texture of water images is not relatively rough and the color of water tends to be generally blue, due to the reflection of the sky. Since there are huge contrasts of texture difference between water and the other ones in this paper, it is meaningful to consider the contrast of texture based on gray scale as one of feature evidence. In addition, HSV model represents color with hue, saturation, and value (also called brightness) in an attempt to be more intuitive and perceptually relevant than the RGB model described by Cartesian (cube) representation. An other characteristic that water hazard presents usually is low saturation, while terrain around is saturated generally. As illustrated in Figure 3(a), hue level of the water region with sky reflection covers full
of hue spectrum, which means that hue is of marginal use for water region detection. According to statistics on saturationvalue levels of water and terrain region, respectively, as shown in Figure 3(b), water region clusters in the high value, low saturation region. Meanwhile, a ray from the origin represents saturation-value ratio and separates the characteristic scatters of water region (orange scatters) and terrain region (purple scatters) practically. Figure 3(d) shows the segmentation using the saturation-value ratio on the image of Figure 3(c). Overall, saturation-value ratio could be chosen as one of feature evidence related to water region. Not surprisingly, shrub, weeds, and bushes seem easier to be to be penetrated, while rocks and tree trunks tend to be hard. The statistical range of each type of obstacles has been covered in the framework. The “invalid data” feature of water images and the “penetration rate” feature of shrub or herb can be extracted based on the 3D data of laser sensor. The three geometrical prototypes of tree trunk (straight line), rocks and waters (plane), and shrub or herb (porous entity) are represented by the eigenvalue, which is included in covariance matrix (cov.) including characteristic distortion
6
Mathematical Problems in Engineering 𝜆0 ≈ 𝜆1 ≫ 𝜆2 𝜆0 ≈ 𝜆1 ≈ 𝜆2
𝜆0 ≫ 𝜆1 ≈ 𝜆2
𝜆1
𝜆1 𝜆0
𝜆0
𝜆2
𝜆2
Figure 4: The graphic distortion features related to shrub or herb, tree trunk, and rocks.
value of the different types of obstacles, as illustrated in Figure 4. 𝜆 0 , 𝜆 1 , and 𝜆 2 represent characteristic distortion value respectively. When the 3D data points are scattered into a sphere, 𝜆 0 , 𝜆 1 , and 𝜆 2 are approximately equal. The 3D data points acquired from shrub or herb show this case. If the 3D data points with a linear distribution, it indicates 𝜆 0 ≥ 𝜆 1 ≈ 𝜆 2 , and the tree trunk best fits the circumstances. The characteristic distortion value of rock has the conclusion of 𝜆 0 ≈ 𝜆 1 ≥ 𝜆 2 . The distortion feature is proposed based on tensor voting method. The method does not assume that 3D points obey the standard normal distribution (SND), so it accords with the real distribution of laser data points in 3D space. Based on the principal component analysis, the covariance matrix calculated by 3D data points will be decomposed, and then the distribution of different obstacles’ data points in the specific area will describe local terrain.
4. Data Fusion 4.1. The Sensors and Organizing Structure of Fusion System. The system can also be able to detect the hazardous slopes. Kalman filter is used for low-level fusion of physical level, thus using the D-S evidence theory for high-level data fusion. The purpose of the low-level information fusion is unifying the characteristics of the sensor data to the framework of information fusion system and integrating these features to generate more precise and detailed information characteristics. D-S evidence theory is used for making decision rules, considering the uncertainty of each sensor. In order to obtain a more reasonable inference, the weight coefficient is combined when the high conflict information exists: here focus on high-level data fusion. For detail, the first step is to establish an identification frame including many kinds of obstacles for recognition in the multifeature information fusion system. Secondly, various types of feature evidence are selected to determine what features of obstacle participate in the multifeature fusion. Based on sensor information, it is necessary to extract the feature which contributes most. Thirdly, the key step is to construct a basic probability assignment function. The paper intends to distribute evidence to “rough” identity report given by each sensor characteristic (or proposition). The membership and correlation coefficient will be determined by the fuzzy interpolation, and the probability assignment function will be determined depending on the target type and weight coefficients. Finally, the total
probability assignment functions of each type of obstacles will be calculated according to the D-S combination rule. The obstacle’s identity will be determined by reasonable identity decision rules (as shown in Figure 5), and the obstacle’s geometric information of 3D data will be obtained according to laser information. 4.2. The Distribution of Basic Probability Assignment Function. The term “Basic Probability Assignment,” represented by mass value, does not refer to probability in the classical sense. It defines a mapping of the power set to the interval between 0 and 1, where the BPA of the null set is 0 and the BPA’s summation of all the subsets of the power set is 1. One of the main difficulties is how to initialize the BPA mass function of evidence as well as possible. There is no general answer to the key problem of mass definition [14]. In many application systems, the most widely used mass functions are derived from the probabilities or from the neighborhood information according to the distance [15]. In addition, some other methods such as those based on the use of neighborhood information have been proposed [16]. In this paper, the mass values are assigned depending on the experimental formula which is definitely closely related to application. The formula can be defined as follows [17]: 𝛼𝑖 = max {𝑃𝑖 (𝑗) | 𝑗 = 1, 2 . . . , 𝑁} , 𝜁𝑖 = 𝛽𝑖 =
𝑁𝜆 𝑖
∑𝑁 𝑗=1
𝑃𝑖 (𝑗)
𝜁𝑖 − 1 , 𝑀−1
𝑅𝑖 =
,
𝑖 = 1, 2, . . . , 𝑀, (1)
𝑀 ≥ 2, 𝑖 = 1, 2, . . . , 𝑀,
𝜆 𝑖 𝛼𝑖 𝛽𝑖 , 𝑀 ∑𝑗=1 𝜆 𝑖 𝛼𝑖 𝛽𝑖
𝑖 = 1, 2, . . . , 𝑀,
where 𝑁 stands for the types of object in off-road environment, 𝑀 corresponds to the total number of sensor sources, 𝑃𝑖 (𝑗) is the correlation coefficient that is evidenced with respect to event in the framework, and 𝜆 𝑖 means weight coefficient; then the mass value will be assigned as follows: 𝑚𝑖 (𝑗) =
∑𝑁 𝑙=1
𝑃𝑖 (𝑗) 𝑃𝑖 (𝑗) + 𝑁 (1 − 𝑅𝑖 ) (1 − 𝜆 𝑖 𝛼𝑖 𝛽𝑖 )
.
(2)
Mathematical Problems in Engineering
7
Identification framework
Basic probability assignment function Features evidence selection Distance contrast f1 Parallelogram feature f2
Gray-level shape feature f3 Gray-level texture feature f4 Color feature f5
Calculate the correlation coefficient between features and objective
Dempster’s rule of combination
Feature evidence
Basic probability assignment function
Compute the membership of features to objective
f1
f2
Step 1
The decision proofed by the most evidence indicates fusion results
f3
f4
f5
Step 2
Step 3
Step 4
Figure 5: The sketch map of data fusion using D-S evidence theory.
The uncertainty value is modified as Θ𝑖 ≜ 𝑚 (Θ) =
∑𝑁 𝑗=1
𝑁 (1 − 𝑅𝑖 ) (1 − 𝜆 𝑖 𝛼𝑖 𝛽𝑖 ) 𝑃𝑖 (𝑗) + 𝑁 (1 − 𝑅𝑖 ) (1 − 𝜆 𝑖 𝛼𝑖 𝛽𝑖 )
.
(3)
The calculation of the correlation coefficient based on the provided information is the key problem in initializing mass value corresponding to evidence. The correlation coefficient between two pieces of evidence needs to be decided by experiment or prediction. The sample in this paper is a demonstration based on the subordinate. The subordinate is represented by 𝑚𝑖𝑗 as measurement of uncertainty. Its lower and upper bounds may be viewed as 0 and 1 but different from the probability. The measurement of the subordinate is described by using the fuzzy interpolation [18]. Then the value of the subordinate 𝑚𝑖𝑗 is converted into correlation coefficient 𝑃𝑖 (𝑗). There exists 𝑚 fuzzy concept FC𝑖 (𝑖 = 1, 2, . . . , 𝑚) within the universe of discourse 𝑈 = {𝑢1 , 𝑢2 , . . . , 𝑢𝑛 }, and each fuzzy concept has its normalized set 𝐸𝑖 which means that element 𝑢𝑗 completely yields to FC𝑖 ; this is denoted by 𝜇FC𝑖 (𝑢𝑗 ) = 1. Also the characteristic function of normalized set 𝐸𝑖 is defined as follows: 𝑋𝐸𝑖 (𝑢𝑗 ) = {
1, 𝜇FC𝑖 (𝑢𝑗 ) = 1, 0, 𝜇FC𝑖 (𝑢𝑗 ) ≠ 1.
(4)
Let 𝑒𝑖 be the vectors of 𝐸𝑖 and suppose that we have 𝑒𝑖 = (𝑒𝑖1,..., 𝑒𝑖𝑗,..., 𝑒𝑖𝑛 ), where 𝑒𝑖𝑗 = 𝑋𝐸𝑖 (𝑢𝑗 ). The normalized matrix 𝐸 is shown as 𝑒1 } { } { { 𝑒 } { 2} 𝐸 = { .. } . } { { } {.} {𝑒𝑚 }
(5)
Let MBS respond to the subordinate matrix of 𝑚 fuzzy concept in the universe of discourse; MBS = (mbs1 , . . . , mbs𝑖 , . . . , mbs𝑚 )𝑇 . Also, suppose that mbs𝑖 denotes subordinate vector of fuzzy concept and is defined in the following manner: 𝑇
mbs𝑖 = (𝑚𝑖1 , . . . , 𝑚𝑖𝑛 ) , 𝑚𝑖𝑗 = 𝜇FC𝑖 (𝑢𝑗 ) ,
(6)
where the value of the subordinate 𝑚𝑖𝑗 is the correlation coefficient 𝑃𝑖 (𝑗). Obviously, 𝑚𝑖𝑗 is the average of subordinate which means how 𝑢𝑗 ∈ 𝑈 resembles any fuzzy concept FC𝑖 . Here is the method of its value solution. (i) If 𝜇FC𝑖 (𝑢𝑗 ) = 1, then 𝑚𝑖𝑗 = 1. Otherwise, according to the fuzzy interpolation algorithm we introduce 𝑚𝑖𝑗 = (1/𝑡) ∑𝑒𝑖𝑘 =1 𝑆(𝑢𝑗 , 𝑢𝑘 ), where 𝑡 = ∑𝑛𝑘=1 𝑒𝑖𝑘 = |𝐸𝑖 | is the number of fuzzy concept FC𝑖 . Both 𝑢𝑗 and 𝑢𝑘 are the elements of normalized set 𝐸𝑖 . 𝑆(𝑢𝑗 , 𝑢𝑘 ) means how much 𝑢𝑗 resembles 𝑢𝑘 ; we employ the equation 𝑆(𝑢𝑗 , 𝑢𝑘 ) = 1 − 𝑑(𝑢𝑗 , 𝑢𝑘 )/𝑑max to calculate the resemblance. 𝑑(𝑢𝑗 , 𝑢𝑘 ) represents the distance between 𝑢𝑗 and 𝑢𝑘 ; likewise, 𝑑max is the distance maximum between any two elements of normalized set 𝐸𝑖 . (ii) Subordinate 𝑚𝑖𝑗 is also equal to the value of element with number 𝑗 of mbs𝑖 in the subordinate matrix MBS. In order to get more reasonable subordinate value we have it filtered by using 𝑚𝑖𝑗 = 𝑚2𝑖𝑗 . Then correlation coefficient 𝑃𝑖 (𝑗) is related to the subordinate value. We assume that the framework includes such obstacles as stone, trunk, shrub, and water in the off-road condition
8
Mathematical Problems in Engineering
Stone image from CCD
Stone 3D data cloud
Stone detection result
Tree trunk image from CCD
Tree trunk 3D data cloud
Tree trunk detection result
Shrub image from CCD
Shrub 3D data cloud
Shrub detection result
Figure 6: The obstacle detection results based on CCD and laser data.
Figure 7: Water body detection results based on CCD.
and then extract their appropriate features as the evidence applied to modify the normalized set 𝐸𝑖 . Based on the knowledge mentioned above, the subordinate vector mbs𝑖 may be calculated. The paper can establish the environment perception topographic maps for UGV and precisely mark the traversable region in front of the UGV, and even report the obstacles’ identity. To realize the function, the registration problem related to laser module and visual module’s redundancy must
be resolved. Namely, how to determine whether the information referenced by the object are the same characteristics, since they come from different sensors. Sensor calibration will be fulfilled by adjusting single CCD and laser sensor to the same field angle and scene, and then the “registered” relationship of pixels between two sensor images will be obtained. Moreover, each pixel of the image has the information of gray, color, and depth; the “visual-depth” 3D image will be established. Based on GPS and Micromechanical Vibration
Mathematical Problems in Engineering
9
CCD shrub image
Laser shrub image
Interface of recognition system
Figure 8: Shrub identification results.
Gyroscope, the self-calibration of UGV position chooses the world coordinate system as the reference coordinate system. By mapping the identity and 3D information of obstacles in each single sensor image into the “vision-depth” 3D image, the environment perception topographic maps, traversable region, and impenetrable region are successfully established. The azimuth and pitching angle of the UGV’s current position are obtained based on GPS and Micromechanical Vibration Gyroscope. The local coordinate system of single sensor is converted into the global coordinate system of the fusion system. The coordinate origin of the two-dimensional global fusion system falls in the center line of the UGV. The horizontal and forward directions of axle Y coincide with the symmetry axis of UGV. Axle X points to the right direction of UGV. As mentioned above, the main purpose of the sensor data fusion is to make real decisions for the small lattice region on the map.
5. Results This paper provides a comprehensive survey of the Unmanned Ground Vehicle of DLUT. The UGV developed by the DLUT in collaboration with its primary supporters relies on a software pipeline for processing sensor data and determining proper steering, throttle, and brake commands. The software related to the common methodology is applied in the UGV autonomous control. However, many of the individual modules relied on state-of-the-art artificial intelligent techniques. The test results show that the pervasive use of machine learning made it robust and precise. Reliable detection of nontraversable hazards is a key requirement and significant challenge for autonomous cross-country navigation. DLUT is developing a daytime obstacle detection capability using UGV mounted sensors and has performed types of obstacle detection algorithms. To perform robust obstacle detection under all conditions,
10
Mathematical Problems in Engineering
CCD shrub image
Laser shrub image
Interface of recognition system
Figure 9: Trunk identification results.
multiple sensors will be necessary. In this paper, we currently focus on the cues for obstacle detection that color camera and laser radar provided. Sensor data are collected from a general dynamics autonomous system and processed off-line with run-time passive perception software that includes rock obstacle detector, nontraversable tree trunk detector, and bush or shrub detector. Figure 6 shows the obstacle detection results including rock, tree trunk, and bush. The left column images come from camera, central column data represent 3D laser data, and the right ones show the detection results in the map. Figure 7 shows water body detection results based on CCD. Since the water 3D data coming from laser are invalid, the value shown is zero. That is the reason why water region detection results are shown based on image in this paper. The cross-country environment is more complicated than the indoors or urban road. The UGV should constantly determine where to go or where not. In order to improve UGV’s ability of environment perception the obstacles need to be recognized. The D-S evidence theory is an effective method for dealing with uncertainty problems in multisensor
data fusion. To assign the mass value of BPA, this paper provides a new approach to handle this problem based on fuzzy subordinate. The experiment results have demonstrated the viability of this new method. The accuracy and robustness of obstacle recognition are both improved. Figures 8, 9, and 10 showed software interface and some of detection results by using D-S evidence theory. Take Figure 8 as an example; the top left images are from CCD, and top right respond to 3D images. The lower image illustrates the software interface of the fusion system. Some information related to obstacles are included here, for instance, the number of obstacles, the three-dimension information, the value related to each feature evidence and BPA mass, and so forth. From Figures 8 to 10, they give the examples that yield Dempster’s combination and decision rules to be accepted in practice. It has revealed that fuzzy subordinate could be a potential method for the mass value; by using this method we obtain more precise identification probability and reduce the uncertainty effectively. Besides, the fusion system can tell 3D information of the detected obstacles which helps make path plan and
Mathematical Problems in Engineering
11
CCD stone image
Laser stone image
Interface of recognition system
Figure 10: Stone identification results.
cruise control decision. Most of obstacles could be recognized accurately based on D-S evidence theory. All in all, these figures show that the recognition results are satisfactory and the robustness is improved by using the proposed methods.
6. Conclusions Cross-country environmental perception for Unmanned Ground Vehicle (UGV) is the key technology of autonomous navigation, and robust obstacle detection is a critical perception requirement for UGV autonomous navigation. Additionally, a UGV that is either broken down due to obstacle damage during an autonomous military mission may require rescue, potentially drawing critical resources away from the primary mission. So environment perception should be strongly supported and rapidly developed. The previous work took multiple algorithm approaches to detect discrete objects with different dominant characteristics.
In this paper, Kalman filter is used for low-level fusion of physical level, thus using the D-S evidence theory for high-level data fusion. Probability Test and Gaussian Mixture Model are applied to obtain the traversable region for UGV. One feature set including color and texture information is extracted from areas of interest in the forward-facing camera view, combined with a classifier approach to resolve two terrain types (traversable or not). The problem of additional obstacle multiclassification (tree trunk, water, shrub, stone, etc.) related to cross-country environment is investigated, and the results are reported over a series of real environment data. The D-S evidence theory is an effective method for dealing with uncertainty problems in multisensor data fusion. To assign the mass value of BPA, this paper provides a new approach to handle this problem based on fuzzy subordinate. In addition, the new evidence is extracted for applying Dempster’s combination rules. The principal components including distance contrast of three-dimension data, image edge chaincode curvature, and covariance matrix are highly focused
12 here. Another breakthrough is to discuss new method that is suitable for distributing basic probability assignment (BPA); then the subordination obtained by using the fuzzy interpolation is applied to calculate the BPA, which is employed to integrate sensors information based on D-S theory of evidence and ultimately to recognize obstacle more precisely. The experiment results have demonstrated the viability of this new method. Our more recent work is looking forward extending the obstacle and terrain perception capabilities of a UGV by using new sensors. For example, more types of obstacle or terrain classification can be taken into account. When the visual sensor cannot be used during night, possible additional sensors including multispectral cameras in the thermal IR could be employed for obstacle recognition or terrain classification. Future work will focus more on the use of temporal analysis over multiple frames and related investigation of varying weather and lighting conditions on performance.
Acknowledgments This work is sponsored by Specialized Research Fund for the Doctoral Program of Higher Education (20110041120024), National Natural Science Foundation Project (51205038), and Fundamental Research Funds for the Central Universities DUT13JS14 and DUT13JS02. Finally, the authors are most grateful for all the friends they made during the research and the events and the many journalists who covered this event.
References [1] O. Grigore-M¨uler, M. Barbelian, J. Arhip, and M. Jurba, “Intelligent image data processing for acquiring target in a multisensor platform,” in Proceedings of the 12th International Conference on Optimization of Electrical and Electronic Equipment (OPTIM ’10), pp. 981–988, Basov, Romania, May 2010. [2] M. Montemerlo, J. Becker, S. Bhat et al., “The stanford entry in the urban challenge,” Springer Tracts in Advanced Robotics, vol. 56, pp. 91–123, 2009. [3] A. L. Rankin, A. Huertas, and L. H. Matthies, “Stereo vision based terrain mapping for off-road autonomous navigation,” in 11th Unmanned Systems Technology, vol. 7332 of Proceedings of SPIE, Orlando, Fla, USA, April 2009. [4] http://www.shanghaiexpo.eu/219-575-1119.aspx. [5] L. Chunfang, Research on the method of obstacle detection of offroad robot running environment [M.S. thesis], Jilin University, 2008. [6] Y. Cong, J. J. Peng, J. Sun, L. Zhu, and Y. Tang, “V-disparity based UGV obstacle detection in rough outdoor terrain,” Acta Automatica Sinica, vol. 36, no. 5, pp. 667–673, 2010. [7] X. Wang, X. Huang, and H. Fu, “A color-texture segmentation method to extract tree image in complex scene,” in Proceedings of the International Conference on Machine Vision and HumanMachine Interface (MVHI ’10), pp. 621–625, Kaifeng, China, April 2010. [8] T. Hu and T. Wu, “A fast and robust obstacle detection algorithm for off-road autonomous mobile robots,” Robot, vol. 33, no. 3, pp. 287–291, 2011.
Mathematical Problems in Engineering [9] I. K. Iyidir, F. B. Tek, and D. Krcal, “Adaptive visual obstacle detection for mobile robots using monocular camera and ultrasonic sensor,” in Computer Vision—ECCV 2012: Workshops and Demonstrations, vol. 7584 of Lecture Notes in Computer Science, pp. 526–535, Springer, New York, NY, USA, 2012. [10] http://www.nsfc.gov.cn/Portal0/InfoModule 375/31040.htm. [11] http://www.at0086.com/BIT/read.aspxnews=7811. [12] K. Sentz, “Combination of evidence in Dempster-Shafer theory,” SAND, 2002-0835 Unlimited Release Printed, 2002. [13] M. Beynon, D. Cosker, and D. Marshall, “An expert system for multi-criteria decision making using Dempster Shafer theory,” Expert Systems with Applications, vol. 20, no. 4, pp. 357–367, 2001. [14] S. Le H´egarat-Mascle and D. Vidal-Madjar, “Application of dempster-shafer evidence theory to unsupervised classification in multisource remote sensing,” IEEE Transactions on Geoscience and Remote Sensing, vol. 35, no. 4, pp. 1018–1031, 1997. [15] P. Walley and S. Moral, “Upper probabilities based only on the likelihood function,” Journal of the Royal Statistical Society B, vol. 61, no. 4, pp. 831–847, 1999. [16] T. Denœux and L. M. Zouhal, “Handling possibilistic labels in pattern classification using evidential reasoning,” Fuzzy Sets and Systems, vol. 122, no. 3, pp. 409–424, 2001. [17] S. Rui, S. Shang-Yuan, and G. Yun-Feng, “The Acquirement of basic probability assessment based on D-S evidence theory,” Modern Mechanics, no. 4, pp. 22–23, 2006. [18] Y. Min, Computer Image Processing, Mechanical Industry Publishing, 1st edition, 2006.
Advances in
Operations Research Hindawi Publishing Corporation http://www.hindawi.com
Volume 2014
Advances in
Decision Sciences Hindawi Publishing Corporation http://www.hindawi.com
Volume 2014
Journal of
Applied Mathematics
Algebra
Hindawi Publishing Corporation http://www.hindawi.com
Hindawi Publishing Corporation http://www.hindawi.com
Volume 2014
Journal of
Probability and Statistics Volume 2014
The Scientific World Journal Hindawi Publishing Corporation http://www.hindawi.com
Hindawi Publishing Corporation http://www.hindawi.com
Volume 2014
International Journal of
Differential Equations Hindawi Publishing Corporation http://www.hindawi.com
Volume 2014
Volume 2014
Submit your manuscripts at http://www.hindawi.com International Journal of
Advances in
Combinatorics Hindawi Publishing Corporation http://www.hindawi.com
Mathematical Physics Hindawi Publishing Corporation http://www.hindawi.com
Volume 2014
Journal of
Complex Analysis Hindawi Publishing Corporation http://www.hindawi.com
Volume 2014
International Journal of Mathematics and Mathematical Sciences
Mathematical Problems in Engineering
Journal of
Mathematics Hindawi Publishing Corporation http://www.hindawi.com
Volume 2014
Hindawi Publishing Corporation http://www.hindawi.com
Volume 2014
Volume 2014
Hindawi Publishing Corporation http://www.hindawi.com
Volume 2014
Discrete Mathematics
Journal of
Volume 2014
Hindawi Publishing Corporation http://www.hindawi.com
Discrete Dynamics in Nature and Society
Journal of
Function Spaces Hindawi Publishing Corporation http://www.hindawi.com
Abstract and Applied Analysis
Volume 2014
Hindawi Publishing Corporation http://www.hindawi.com
Volume 2014
Hindawi Publishing Corporation http://www.hindawi.com
Volume 2014
International Journal of
Journal of
Stochastic Analysis
Optimization
Hindawi Publishing Corporation http://www.hindawi.com
Hindawi Publishing Corporation http://www.hindawi.com
Volume 2014
Volume 2014