978-1-4244-8657-1/11/$26.00 c 2011 IEEE. 21 ..... data fusion contest,â IEEE GRSL, vol. ... the classification of urban remote sensing images,â IEEE TGRS, vol.
In: Stilla U, Gamba P, Juergens C, Maktav D (Eds) JURSE 2011 - Joint Urban Remote Sensing Event --- Munich, Germany, April 11-13, 2011
Multi-sensor data fusion for urban area classification Aliaksei Makarau, Gintautas Palubinskas, and Peter Reinartz Remote Sensing Technology Institute German Aerospace Center (DLR) 82234 Wessling, Germany {aliaksei.makarau, gintautas.palubinskas, peter.reinartz}@dlr.de Abstract— Nowadays many sensors for information acquisition are widely employed in remote sensing and different properties of the objects can be revealed. Unfortunately each imaging sensor has its own limits on scene recognition in the sense of thematic, temporal, and other interpretation. Integration (fusion) of different data types is expected to increase the quality of scene interpretation and decision making. In recent time integration of synthetic aperture radar (SAR), optical, topography or geographic information system data is widely performed for many tasks such as automatic classification, mapping or interpretation. In this paper we present an approach for very high resolution multi-sensor data fusion to solve several tasks such as urban area automatic classification and change detection. Datasets with different nature are integrated using the INFOFUSE framework [1], consisting of feature extraction (information fission), dimensionality reduction, and supervised classification. Fusion of WorldView-2 optical data and laser Digital Surface Model (DSM) data allows for different types of urban objects to be classified into predefined classes of interest with increased accuracy. Numerical evaluation of the method comparing with other established methods illustrates advantage in the accuracy of structure classification into low-, medium-, and high-rise buildings together with other common urban classes.
I. I NTRODUCTION Data or image fusion is a developing area of research especially in remote sensing and geoscience. Different modalities of data can be obtained by different sensors for the same area, and more properties can be revealed on the area structure, contents, properties, etc. Several novel and competitive approaches on urban area and landcover classification using fusion were proposed. Rottensteiner et. al. [2] presented a method for building detection from LIDAR data and multi-spectral images, and have shown its applicability in a test site of heterogeneous building shapes. The method is based on the application of the Dempster-Shafer theory for data fusion. The authors note that the achieved results are satisfactory but in some cases buildings and trees cannot be accurately separated, either because of shadows or because the resolution of the LIDAR data is not sufficient. Pacifici et. al. [3] developed the best fusion algorithm for 2007 GRSS Data Fusion Contest. The algorithm is based on a neural network classification enhanced by preprocessing and postprocessing. Principal component analysis was applied on SAR data. Altogether, 14 inputs to the neural network were given: 2 SAR images, 6 Landsat-5 spectral images, and 6 Landsat-7 spectral images. The classification into 5
classes (City center, Residental area, Sparce buildings, Water, Vegetation) provided Kappa coefficient equal to 0.93. Fauvel et. al. [4] applied decision fusion for the classification of urban area. The fusion approach consists in two steps. In the first step, data are processed by each classifier separately and the algorithms provide for each pixel membership degrees for the considered classes. In the second step, a fuzzy decision rule is used to aggregate the results provided by the algorithms according to the classifiers’ capabilities. The method was tested and validated with two classifiers on IKONOS images from urban areas. The proposed method improves the classification results when compared with the separate use of the different classifiers. The overall accuracy of classification for 6 classes (Large buildings, Houses, Large roads, Streets, Open areas, and Shadows) is 75.7 %. In this paper we present an example of urban area classification using data fusion. Since urban area provides different classes of interest and the objects of the same class can have highly varying properties, the task of urban land cover classification becomes more difficult. For example, the buildings of one class (e.g. medium-rise) may have different spectral properties of the roofs and such buildings may be difficult to classify into one class. Also confusion with other classes is a usual issue (e.g. roads and buildings). To overcome this problem we propose to use the fusion of multispectral image and the DSM. Different sources of information allow to increase the number of classes as well as the accuracy of classification. The use of the DSM data is expected to give a possibility to classify buildings with highly varying spectral properties of the roofs into a class they belong to (low-, medium-, and high- rise buildings) and prevent confusion with other classes (e.g. roads). II. I NPUT DATA In order to investigate and illustrate the effectiveness of the proposed approach we have chosen the area of Munich city as a test scene. Munich contains variety of urban building types and structures, such as old town, residential area, low, medium-, and high-rise buildings, rail road, water regions, bare soil, etc. Two very high resolution datasets were chosen: WorldView-2 multispectral imagery and laser DSM data. WorldView-2 multispectral data was obtained at the 12-th July 2010, 10:30:17 Local time. Multispectral data contains 8 11-bit bands, 2m spatial resoliution, the panchromatic data contain one 11-bit band, 0.5m spatial resolution. The spectral
c 978-1-4244-8657-1/11/$26.00 �2011 IEEE
21
In: Stilla U, Gamba P, Juergens C, Maktav D (Eds) JURSE 2011 - Joint Urban Remote Sensing Event --- Munich, Germany, April 11-13, 2011
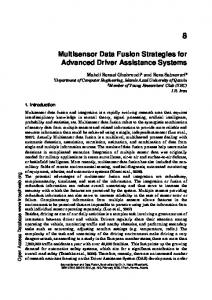
the objects. Since the DSM data provides relief and surface topography of the scene, the DSM allows to separate objects of different nature by their relevant height irrespectively of the same spectral characteristics. Several combinations of the features can be created from the multispectral data, the texture, and the DSM. The combination providing the best quality can be selected for automatic classification. The following combinations can be created: • Optical multispectral data, and the DSM data, • Texture and the DSM, • Optical multispectral data and Texture • Optical multispectral data, Texture, and the DSM B. Unsupervised clustering Fig. 1. Diagram of the INFOFUSE framework for multi-sensor data fusion and classification
bands were pan-sharpened using an image fusion method based on high-frequency image data addition to low-resolution spectral image [5]. This method provides minimal distortion of spectral and spatial characteristics of multispectral imagery [6]. Laser DSM data was generated from the LiDAR data (last return pulses were used). The LiDAR point cloud data was acquired in February 2003. The DSM data was registered to the pansharpened multispectral image. III. DATA FUSION AND CLASSIFICATION Data fusion framework consists of three main stages. • Feature extraction from input datasets. These features are expected to characterize different properties of structures and objects. This step is called information fission. After the feature extraction a large amount of redundant information is obtained. • Dimensionality reduction using unsupervised clustering. This step is performed to acquire the unique description of the data in terms of clusters and to reduce the dimensionality of the extracted features [1]. • Fusion of the clustered features. The fusion is performed using a Bayesian Network [7] or a Neural Network (NN) [8]. The Bayesian or Neural network is trained on the data produced at the previous step (clustered features) according to supervisely selected classes and training areas. After the supervised training the classification (inference) is possible to perform. Further sections contain detailed description of the method. A. Feature extraction Co-Occurence texture features for the pan-sharpened multispectral data were calculated [9]. Among the texture features the Mean, Variance, Homogeneity, Contrast, Dissimilarity, Entropy, Second Moment, and Correlation). Experiments on the processing co-occurrence window size revealed that the window of size 7 × 7 provided more proper description of objects during the unsupervised clustering for the classification. Optical data is used for description of spectral properties of
22
Since the aim of this step is to combine features with similar properties and to reduce the dimensionality of the calculated feature data, any unsupervised clustering method can be employed for this task. K-means clustering based on entropy [10] was applied on each extracted feature separately. The number of clusters for each feature can be different and defined individually according to the type of the feature. C. Information fusion using Bayesian/Neural network A Bayes network or a Neural network is employed to fuse the extracted features and to produce the inference (i.e. classification through fusion). Bayesian or Neural network allows to combine information from different sources of measurement, therefore the fusion of incommensurable features (numerical, logical, semantical, etc.) can be performed. Supervised training of the network allows to estimate the network state and a classification is possible to perform. IV. AUTOMATIC CLASSIFICATION We have selected 8 main classes for the urban scene: 1) Low-rise buildings; 2) Medium-rise buildings; 3) High-rise buildings; 4) Roads; 5) Water; 6) Forest/Trees; 7) Grass; 8) Shadow. Since the same objects can have highly varying properties (spectral, textural, etc.) it may be very hard to train a classifier on such inhomogeneous data and to produce a classification with a high accuracy. For example, buildings have different material of the roofs, therefore highly varying spectral characteristics of the material (tiles, concrete, highlyreflecting metal, etc.) make difficult to classify such inhomogeneous objects into one class of interest. Therefore a predefined class containing objects with highly varying spectral properties is divided into several subclasses. Subclasses were defined for each of the low-, medium-, and high-rise buildings, and roads class. After such extension the overall number of the classes is 16: Low-rise buildings, include: 1) roof tile, 2) concrete roof, 3) dark color roof; Medium-rise buildings, include: 4) roof tile, 5) concrete roof, 6) green color metal roof, 7) highly reflecting roof; Highrise buildings, include: 8) roof tile, 9) concrete roof, 10) dark color roof; Roads, include: 11) asphalt pavement, 12) concrete pavement; 13) Water; 14) Forest/Trees; 15) Grass; 16)
In: Stilla U, Gamba P, Juergens C, Maktav D (Eds) JURSE 2011 - Joint Urban Remote Sensing Event --- Munich, Germany, April 11-13, 2011
Shadow. After the classification into the 16 classes, the defined subclasses are merged to produce the classes of interest. The ground truth for the area under investigation was proofed by the ATKIS vector map provided by Bavarian State Agency for Surveying and Geoinformation (Landesamt f¨ur Vermessung und Geoinformation). The assessment of the buildings height was made using the DSM and manual interpretation of very high resolution airborne data obtained by the DLR 3K camera system [11]. The number of clusters in the unsupervised clustering usually has value between 40 and 100. Experimental search found that the value of 80 provides significant dimensionality reduction with high accuracy of the landcover classification. A Multilayer perceptron (MLP) was employed for the data fusion and classification implemented in the IDL. A feedforward neural network based on scaled conjugate gradient training was employed [8]. The network contains two hidden layers with 16 neurons in each layer. Training of the MLP made 1000 training epochs. V. C HANGE DETECTION The classification using an MLP allows to obtain posterior probabilities of the classification map. Image area with a low probability is difficult to classify into any of the possible classes. This situation may be caused that these areas represent landcover classes not learned by the used classifier, or the used datasets provide different, unsufficient, or changed information about the area. For example, the time gap between the acquisitions may be long enough and some changes in the area may happen (pavement change, construction of buildings, etc.) and different data types can represent different types of landcover for the same region. Such areas with low probabilities can not be classified with high certainty, therefore labeled as changed landcover. VI. A SSESSMENT Table I presents Overall accuracy (OVA) and Kappa coefficient scores for the widely used classification methods Maximum Likelihood (ML) and Support Vector Machine (SVM) together with the proposed approach (INFOFUSE). The ML and SVM were run in the ENVI software, the SVM employed RBF kernel. The ML and SVM used feature data composed from the Multispectral, Texture, and the DSM. Classification results for different combinations of the data and features as well as classification using single sensor data are given. A. Automatic classification The best accuracy of the classification provided INFOFUSE method on the combination of the multispectral data, the texture features, and the DSM. Table II presents a confusion matrix for the best classification result (LRB - Low-rise buildings, MRB - Medium-rise buildings, HRB - High-rise buildings). Confusion of low-rise building (up to three floors) and medium-rise buildings (from four to eleven floors), or medium-rise buildings and high-rise buildings (from twelve to fourty floors) may be caused that buildings of different number
23
TABLE I C LASSIFICATION ACCURACY USING DIFFERENT METHODS TOGETHER WITH THE PROPOSED APPROACH . B EST RESULT IS MARKED IN BOLD Method ML ML ML ML ML ML ML SVM SVM SVM SVM SVM SVM SVM INFOFUSE INFOFUSE INFOFUSE INFOFUSE INFOFUSE INFOFUSE INFOFUSE
Features (fission, total number) Multispectral (8) DSM (1) Texture (64) Texture+DSM (65) Multispectral+DSM (9) Multispectral+Texture (72) Multispectral+Texture+DSM (73) Multispectral (8) DSM (1) Texture (64) Texture+DSM (65) Multispectral+DSM (9) Multispectral+Texture (72) Multispectral+Texture+DSM (73) Multispectral (8) DSM (1) Texture (64) Texture+DSM (65) Multispectral+DSM (9) Multispectral+Texture (72) Multispectral+Texture+DSM (73)
OVA, % 68.74 32.20 73.10 81.85 91.02 74.03 82.07 63.70 34.75 71.94 72.47 74.93 76.84 72.53 76.00 54.25 77.16 88.53 87.11 94.07 96.04
Kappa 0.6402 0.2478 0.6930 0.7900 0.8958 0.7073 0.7941 0.5771 0.2056 0.6757 0.6817 0.7078 0.7497 0.6822 0.7205 0.4511 0.7350 0.8644 0.8487 0.9309 0.9539
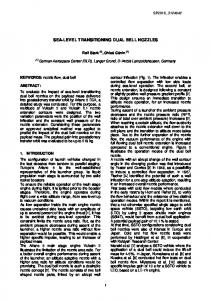
of floors can have the same height and similar material of the roofs, or the DSM data normalization produced errors. Also, low quality of normalized DSM data can lead to confusion of low-rise buildings and roads. Confusion of forest and shadow comes from the fact that trees in a forest produce shadowing, therefore forest area is always contains shadows. The accuracy highly depends on the preparation of the data (multispectral image pan-sharpening and the DSM normalizing). Low accuracies of the ML classification method may be caused that the ML classifier can not efficiently deal with different distributions of the data and features, or the multisensor data is not classified in the way of consensus classification [12]. High classification accuracy produced using the Multispectral and DSM data seems to be produced by a chance and is not promised to produce the same results on other data. A subscene of a classification map (INFOFUSE; Optical multispectral data+Texture+DSM) is presented in Figure 2. Figure 2(d) shows postprocessed image with clumping (clumping adds spatial coherency to existing classes by combining adjacent similar classified areas). B. Change detection Since the classifier provided posterior probabilities, the regions with low probabilities (below 0.95) are marked in black. Figure 2(b) together with the landcover classes contains such regions. The low probabilities are expected to show the evidence of the landcover class change (construction of buildings or change of the structures height). VII. C ONCLUSION This paper presents a multi-sensor data fusion method for urban area classification. The fusion model is based on information fission, dimensionality reduction, and information aggregation and employs relevant ways of multisource data
In: Stilla U, Gamba P, Juergens C, Maktav D (Eds) JURSE 2011 - Joint Urban Remote Sensing Event --- Munich, Germany, April 11-13, 2011 TABLE II C ONFUSION MATRIX , INFOFUSE, Class LRB MRB HRB Roads Water Forest Grass Shadow Total
LRB 1793 818 19 270 0 0 0 0 2900
USED DATA AND FEATURES : OPTICAL MULTISPECTRAL ,
MRB 32 5214 61 1 0 0 0 0 5308
HRB 13 104 4256 6 0 0 0 0 4379
Roads 14 0 0 7590 0 0 0 0 7604
Water 0 0 0 0 3784 0 0 4 3788
Forest 32 0 0 0 0 5714 31 28 5805
Grass 0 0 0 0 0 3 3528 0 3531
T EXTURE ,
Shadow 0 0 0 0 0 0 0 2961 2961
AND THE
DSM
Total 1884 6136 4336 7867 3784 5717 3559 2993 36276
combination. Utilized multi-sensor data (multispectral and DSM) allow to increase the number of classes and to boost the accuracy of the classification. The results of the classification are used for the composition of specific classes of interest (i.e. low-, medium-, and high- rise buildings) together with other urban classes. Multi-sensor data is processed separately and the fusion and classification method follows consensus rules of multisource data classification. The data classification is not influenced by the limitations of dimensionality and the calculation complexity primarily depends on the step of dimensionality reduction. The shown method has also a high potential for the task of change detection, which is a matter for future research.
(a)
ACKNOWLEDGMENT We would like to thank European Space Imaging (EUSI) for provision of Digitalglobe WorldView-2 data. This work was supported by the DLR-DAAD research grant (A/09/95629). R EFERENCES
(b)
(c)
(d) Fig. 2. A region of the classification map: (a) visible range multispectral image (bands 5,3,2), (b) a region of the classification into 16 classes, (c) composition of the subclasses to make the classes of interest (low-, medium-, and high-rise buildings) and other classes of urban area, (d) clumped (c)
24
[1] G. Palubinskas and M. Datcu, “Information fusion approach for the data classification: an example for ERS-1/2 InSAR data,” International Journal of Remote Sensing, vol. 29, no. 16, pp. 4689–4703, 2008. [2] F. Rottensteiner, J. Trinder, S. Clode, K. Kubik, and B. Lovell, “Building detection by Dempster-Shafer fusion of LIDAR data and multispectral aerial imagery,” ICPR, vol. 2, pp. 339–342, 2004. [3] F. Pacifici, F. Del Frate, W. Emery, P. Gamba, and J. Chanussot, “Urban mapping using coarse SAR and optical data: Outcome of the 2007 GRSS data fusion contest,” IEEE GRSL, vol. 5, no. 3, pp. 331–335, 2008. [4] M. Fauvel, J. Chanussot, and J. A. Benediktsson, “Decision fusion for the classification of urban remote sensing images,” IEEE TGRS, vol. 44, no. 10, pp. 2828–2838, 2006. [5] G. Palubinskas and P. Reinartz, “Multi-resolution, multi-sensor image fusion: general fusion framework,” accepted to the JURSE 2011. [6] A. Makarau, G. Palubinskas, and P. Reinartz, “Multiresolution image fusion: Phase congruency for spatial consistency assessment,” in 100 Years ISPRS - Advancing Remote Sensing Science Symposium, TC VII, Vienna, Austria, July 2010. [7] R. Neapolitan, Learning Bayesian Networks. Prentice Hall, 2004. [8] C. Bishop, Neural Networks for Pattern Recognition. Oxford University Press, 1995. [9] R. M. Haralick, K. Shanmugam, and I. Dinstein, “Textural features for image classification,” IEEE Transactions on Systems, Man, and Cybernetics, vol. 3, no. 6, p. 610621, 1973. [10] G. Palubinskas, “An unsupervised clustering method by entropy minimization,” in Maximum Entropy and Bayesian Methods, W. von der Linden et al., Eds., Kluwer Academic Publisher, 1999, pp. 327–334. [11] F. Kurz, D. Rosenbaum, U. Thomas, J. Leitloff, G. Palubinskas, K. Zeller, and P. Reinartz, “Near real time airborne monitoring system for disaster and traffic applications,” in ISPRS, Hannover, 2-5 June 2009. [12] J. Benediktsson, J. Sveinsson, and P. Swain, “Hybrid consensus theoretic classification,” IEEE TGRS, vol. 35, no. 4, pp. 833–843, jul. 1997.