[4] Jason Hill, Robert Szewczyk, Alec Woo, Seth Hollar, ... [6] Nirupama Bulusu, John Heidemann, and Deborah ... [18] Leonard Kleinrock and John Silvester.
Error Characteristics of Ad Hoc Positioning Systems (APS) Dragos¸ Niculescu and Badri Nath Rutgers University DATAMAN Lab
{dnicules,badri}@cs.rutgers.edu
ABSTRACT APS algorithms use the basic idea of distance vector routing to find positions in an ad hoc network using only a fraction of landmarks, for example GPS enabled nodes. All the nodes in the network are assumed to have the possibility of measuring: range, angle of arrival (AOA), orientation, or a combination of them. We give a lower bound for positioning error in a multihop network for a range/angle free algorithm, and examine the error characteristics of four classes of multihop APS algorithms under various conditions, using theoretical analysis and simulations. Analysis of range/angle free, range based, angle based, and multimodal algorithms shows a complex tradeoff between the capabilities used, the density of the network, ratio of landmarks, and the quality of the positions obtained.
Categories and Subject Descriptors C.2.2 [Network protocols]: Applications; C.2.3 [Network operations]: Network Management
Keywords Ad hoc networks, multihop positioning, ad hoc positioning system, APS, Cram´er-Rao lower bound, error analysis
General Terms Performance, Algorithms
1.
INTRODUCTION
Position and orientation information of individual nodes in ad hoc networks is useful for both service and application implementation. Services that can be enabled by availability of position include routing and querying. At application level, position is required in order to label the reported data in a sensor network, whereas position and orientation enable tracking. Nodes in an ad hoc network may have local capabilities such as the possibility of measuring ranges to neighbors, angle of arrival (AOA), or global capabilities, such as
Permission to make digital or hard copies of all or part of this work for personal or classroom use is granted without fee provided that copies are not made or distributed for profit or commercial advantage and that copies bear this notice and the full citation on the first page. To copy otherwise, to republish, to post on servers or to redistribute to lists, requires prior specific permission and/or a fee. MobiHoc’04, May 24–26, 2004, Roppongi, Japan. Copyright 2004 ACM 1-58113-849-0/04/0005 ...$5.00.
GPS and digital compasses (a compass shows orientation with respect to north). One scenario involving sensor networks frequently mentioned in literature is that of aircraft deployment of sensors followed by in flight collection of data by simply cruising the sensor field. This and other meteorological applications are implicitly assuming that the data provided by the sensor is accompanied by the sensor’s position. It is thus possible to attach the sensed information to a geographical map of the monitored region. If this is an absolute necessity for making sense of the observed data, accurate position might also be useful for routing and coordination purposes. For some ad hoc networks, algorithms such as Cartesian routing [1], geocast [2], or GoAFR [3] enable routing with reduced or no routing tables at all, and are appropriate for devices like the Rene mote [4], with only half a kilobyte of RAM. Location Aided Routing [5] is an improvement that can be applied to some ad hoc routing schemes when position is available, by limiting the search for a new route to a smaller destination zone. Positioning and orientation algorithms are appropriate for indoor location aware applications, when the network’s main feature is not the unpredictable, highly mobile topology, but rather temporary and ad hoc deployment. These networks would not justify the cost of setting up an infrastructure to support positioning, like proposed in [6], [7], or [8]. When deploying an ad hoc network that uses positions at application or service levels, the important decisions to be made are with respect to the node density, availability of landmarks, and node capabilities versus the desired quality of the positions. “One hop” solutions, such as GPS, in which each node is within communication range with the landmarks, are desirable for their simplicity, but may not be applicable in many setups because of form factor, power, cost, or line of sight conditions. Multihop solutions, which make the object of this study, while being more appropriate with respect to the mentioned conditions, face problems of error propagation, and provisioning. Error buildup is inherent in a multihop environment because angle and distance measurements are affected by error at each hop. Range measuring methods include signal strength, TDOA (time difference of arrival) based on the six order of magnitude difference between ultrasound and RF signals, and UWB. Angle measurements are provided by antenna arrays, or by TDOA methods, as shown in the prototype of the Cricket compass [9]. Provisioning of large ad hoc networks includes not only the networking related aspects, but the management of the
error, when positioning is needed. As we show in this paper, there is a tradeoff between capabilities of the nodes (angle and range measuring hardware), the density of the network, the placement of landmarks, and the quality of the positions obtained. By analyzing four multihop algorithms that make use of different capabilities - range/angle free, angle, range, angle+range - we examine the relationship between position error and the way the network is provisioned. This paper makes two contributions: First, we derive a Cram´er-Rao lower bound for positioning error of a multihop range/angle free positioning algorithm (APS/DV-hop) - equation (8). Its importance is in bounding the position error achievable by this multihop algorithm for a given network setup. The simulated algorithm closely follows the trend of the theoretical bound. Second, we analyze a multimodal algorithm that uses both angle and range measurements. Although it has higher hardware requirements, its behavior is predictable through analysis, and its performance is bounded (literally) in the parameter space by three other algorithms: range/angle free, range based, and angle based. Its complex relationship with the other analyzed algorithms provides insights with respect to the quality of hardware needed to obtain high quality positions in a multihop environment (Figure 10). An important insight is that for the analyzed algorithms, if the statistical measurement error is beyond a certain limit, then it is no better than not measuring at all. When provisioning an ad hoc network in terms of density or measurement hardware used, this result helps in choosing a solution that gives the lowest positioning error for the given conditions. The remainder of the paper is organized as follows: next section has a short review of APS family of algorithms, which are the subject of this analysis. Section 3 introduces error models for trilateration (3.2), DV-hop (3.4), and DVposition (3.5) algorithms. In section 4 we comparatively analyze four algorithms with different hardware requirements. For the better flow of the presentation, most mathematical derivations are detailed in four appendices A-D, at the end of the paper.
2.
APS ALGORITHMS
The assumptions made by most multihop solutions are that some measuring hardware gives some reading with respect to a node’s neighbor. A node may measure distance or range to its neighbors, with a given accuracy. Alternatively, it may measure bearing with respect to the node’s axis, or angle from which the signal is received, some times called AOA (angle of arrival). In extreme cases, a node has neither of the mentioned capabilities and has to rely on simple connectivity only. In the case it has them both, it can make more precise estimations, and we refer to this as “multimodal”. The positioning problem to be solved is: given imprecise bearing / range measurements to neighbors in a connected ad hoc network where a small fraction of the nodes have self positioning capability, find positions for all nodes in the network. The difficulty of the problem stems from the fact that the capable nodes (landmarks) comprise only a small fraction of the network, and most regular nodes are nodes are not in direct contact with enough landmarks. Ah Hoc Positioning System (APS) [10, 11] is a hybrid between two major concepts: distance vector (DV) routing, and beacon based positioning (GPS). What makes it similar
to DV routing is the fact that information is forwarded in a hop by hop fashion, independently with respect to each landmark. What makes it similar to GPS is that eventually each node estimates its own position, based on the landmark readings it gets. The APS concept has been shown to work using simple connectivity, range measurements [10], angle measurements [11], and a combination of them [12]. All propagations work very much like a mathematical induction proof. The fixed point: nodes immediately adjacent to a landmark get their bearings / ranges directly from the landmark. The induction step: assuming that a node has some neighbors with bearing / range for a landmark, it will be able to compute its own bearing / range with respect to that landmark, and forward it further into the network. What remains to be found is a method to compute this induction step, for any combination of local capabilities: connectivity only, ranging, angle measurements, and multimodal = angle + range. If for some reason a node does not get enough ranges / bearings in order to triangulate / trilaterate for a position, it could wait for the neighbors to successfully position themselves and either use local measurements in order to get a position, or simply use a weighted average with the positions of those neighbors. Even if position is available at a node, smoothing with the positions of the neighbors has been reported beneficial in certain cases [13, 14, 15].
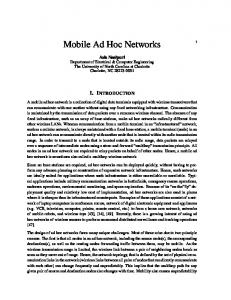
2.1 DV-hop propagation method This is the most basic scheme, which doesn’t require any hardware to measure ranges or angles to neighbors. It only relies on the connectivity of the underlying graph and it comprises of three non-overlapping stages. (I) First, it employs a distance vector exchange so that all nodes in the network get shortest paths, in hops, to the landmarks. Each node maintains a table {Xi , Yi , hi } and exchanges updates only with its neighbors. Xi , Yi are the coordinates of landmark i, and function here as a name for the landmark as well. hi is the shortest distance in hops to that landmark. This phase is the classical Bellman Ford distributed shortest path algorithm that is found in internet routing (RIP and BGP). (II) In the second stage, after it cumulates distances to other landmarks, a landmark estimates an average size for one hop, which is then deployed as a correction to the nodes in its neighborhood. (III) After receiving the correction, an arbitrary node may estimate distances to landmarks, in meters, which can be used to perform the trilateration. The correction a landmark (Xi , Yi ) computes is P ρj P ci = , i 6= j, all landmarks j heard by i (1) hj where hj is the p shortest distance, in hops from node i to node j, and ρj = (Xi − Xj )2 + (Yi − Yj )2 is the straight line distance between i and j. The advantages of DV-hop are that it is completely distributed and localized, and it only relies on connectivity. The drawback is that it will only work for isotropic networks, that is, when the properties of the graph are the same in all directions, so that the corrections that are deployed reasonably estimate the distances between hops. Also, shortest path to the landmark is assumed to be obtained by the distance vector procedure. This might not be the case in vari-
Figure 1: Euclidean, DV -bearing propagation
Figure 2: DV-position propagation method
N
B
A ab
D
L
b A
b ba
B A1
c
PSfrag replacements
North
C
able duty cycle sensor networks, mobile networks, or when processing is slow. When this happens a landmark proceeds to stage (II), or a node to stage (III) with a less than optimal path. These problems can be alleviated with careful provisioning of the timeouts between the stages in order to accommodate proper operating ranges for the density and the size of the network.
2.2 Euclidean and DV-radial The range based scheme Euclidean works by propagating the estimated Euclidean distance to the landmark, so this method is the closest to the nature of GPS. Euclidean makes use of range measurements to neighbors. The angle based scheme DV-bearing propagates in a similar fashion, but each node computes and forwards a bearing - the angle under which it ”sees” a landmark. It therefore needs angle measurement hardware, and can benefit from the presence of a compass in each node of the network. (I) An arbitrary node A needs to have at least two neighbors B and C which have estimates - angles or ranges - for the landmark L (Figure 1). For Euclidean, A also has measured estimates of distances for AB, AC, and BC, so there is the condition that: either B and C, besides being neighbors of A, are neighbors of each other, or A knows distance BC, from being able to map all its neighbors in a local coordinate system. For the quadrilateral ABCL, all the sides are known and one of the diagonals, BC is also known. This allows node A to compute the second diagonal AL, which in fact is the Euclidean distance from A to the landmark L. For DV -bearing, A knows all the angles in triangles ∆ABC and ∆BCL, indicated with continuous arrows. This allows for the computation of the bearing of A with respect to L, indicated with a dashed arrow. This step is the induction step, which propagates the capability from nodes B and C to node A which is one hop further from landmark L. (II) Once a node has ranges or angles to three landmarks, it may, by itself, estimate its position, by applying a trilateration procedure for the range based, or a triangulation procedure for the angle based method. The trilateration procedure is described in section 3.1. The advantage of the range / angle based methods is that they provide better accuracy under certain conditions, and there is only one communication stage (no corrections). On the down side, they require additional hardware, when compared to DV-hop, which makes them susceptible to measurement error.
2.3 DV-position If ranging and angle measurements (AOA) are both available at all nodes, DV-position can be used as a method that makes simultaneous use of both capabilities for increased accuracy. If compasses are available at landmarks, neighbors of landmarks can position themselves in one step using DV-position. In Figure 2, if landmark B has a compass and can measure b at angle ˆb, and also AOA capability to measure the angle ba which A is seen, then it is possible to compute the equation line on which A is placed. If the range AB is known, node A can find its own position. The absolute orientation of A can b + π − ab) b +b also be found, as 2π − (ba b. Using further propagation, node A can then behave as a less accurate landmark for further away nodes. DV-position is a much simpler scheme than the previous ones, but requires more hardware - both angle and range measurements. Nevertheless, its analysis is meaningful since its provides some insights to the behavior of the other algorithms and the quality of the hardware that is needed to produce good positions. Prototypes of small form factor nodes that feature the AOA capability (such as the Cricket Compass [9]), and good ranging capability (such as Medusa node [14]), make multimodal positioning a feasible solution.
3. POSITIONING ERROR ANALYSIS 3.1 Trilateration review In Global Positioning System (GPS [16]), trilateration (in reality multilateration) uses range estimates to at least three known satellites to find the coordinates of the receiver, and four satellites to also find the clock bias of the receiver. For our ad hoc positioning purposes, we are using a simplified version of the trilateration, as we only deal with distances, and there is no need for clock synchronization. The trilateration procedure starts with an apriori estimated position that is later corrected towards the true position. Let x ˆ be the estimated position, x = [x y]> the real position, xi = [xi yi ]> the known coordinates of the satellites, ˆ || the meaρ = ||xi − x|| the true range, and ρˆi = ||xi − x sured range to satellite i. The problem is to find x given ˆ , which proρi and xi . We start with an initial guess x vides associated ρˆi . The distance equation to each satellite p is ρi = (xi − x)2 + (yi − y)2 . The correction of the range, ∆ρ is approximated linearly using Taylor expansion. If Jˆi x ˆ − x, then and ∆x = x is the unit vector of ρˆi , Jˆi = xiρˆ−ˆ i the approximate of the correction in the range is: ∆ρ =
Figure 3: Progress per hop for MFR policy y
r
ρˆi − ρi ' Jˆi · ∆x. Performing the above approximation for each satellite independently leads to a linear system in which the unknown is the position correction ∆x = [∆x ∆y]:
∆ρ = J∆x 3 2 ∆ρ1 6 ∆ρ2 7 6 7 6 6 7=6 6 4 ... 5 6 4 ∆ρn 2
Jˆ1x Jˆ2x ... Jˆnx
3 Jˆ1y » – Jˆ2y 7 7 ∆x 7 7 ∆y ... 5 Jˆny
x
1 (2)
i
=
(J > W J)−1 J > W
(3)
After each iteration, the corrections ∆x and ∆y are applied to the current position estimate. The iteration process stops when the correction in position is below a chosen threshold. The uncertainties W are obtained as the estimated errors of the ranges computed by DV-hop and Euclidean. If W is known, it is actually possible to give a lower bound for the covariance of x, or position error, that can be achieved by trilateration.
3.2 CRLB for trilateration The Cram´er-Rao lower bound is method that sets a lower bound on the variance of any unbiased estimator. Its main merit is that it provides a benchmark against which to evaluate the performance of an estimator. In our case the trilateration problem is cast as an estimation problem by considering the true position x as a parameter to be estimated. The distribution of errors of distances to landmarks ρˆ is assumed to be known at this point in the presentation. Using notations introduced in the previous section, we now estimate the error in the obtained position given the range to landmark estimation error. This approach is applicable to all the algorithms that use trilateration as a final phase (DV-hop and Euclidean). The hop by hop nature of multihop algorithms always produces normal errors for a sufficiently large number of hops – we confirmed this by simulation for all algorithms mentioned here. In appendix B, we show that the CRLB of the variance in the estimated parameter x is: CRLB(Cov[x]) xi −x , ρi
=
(J0> W J0 )−1
x
PSfrag replacements
When all measurements have the same uncertainty, the system is solved as with OLS: ∆ρ = J∆x ⇒ ∆x = J + ∆ρ, where J + = (J > J)−1 J > is the pseudoinverse of J. If independent uncertainties σi are available for range estimates, the above system is solved using WLS with weights W = diag{ σ12 } = Cov[∆ρ]−1 , J + becomes J+
A
3.3 DV-hop range error In DV-hop, the main source of range error stems from the fact that a node translates the length of shortest path to a landmark into a Euclidean distance by assuming that every hop produces progress ci - equation (1). Greedy geographic forwarding has been shown in [17] to produce paths with low dilation, that is, good shortest path approximates. This means that if we apply a geographic forwarding policy such as MFR [18] in a uniform, dense network, the progress made by each hop is a good approximation for ci . If the network is not dense enough, areas with low connectivity result in either dropping the packet by the greedy forwarding scheme, or requiring the use of an obstacle avoiding algorithm. The analysis provided here only covers the cases when the network is dense enough so that simple greedy forwarding succeeds. High density however, is a requirement for a network to be connected in the case nodes are distributed randomly in a large network [19]. Kleinrock and Silvester [18] show that for greedy forwarding, the progress only depends on the node density. For DV-hop, this implies that in uniform networks, nodes may locally estimate the correction based on their local perception of density, and thus eliminate the need for the second stage of the algorithm. Assuming a Poisson spatial distribution of nodes with rate λ, and a wireless range of radius 1, the expected number of neighbors of a node will be πλ. Throughout the paper we will use both the average number of neighbors, or the rate λ when referring to density. A node chooses a next hop that produces most progress x towards a destination on the horizontal axis (Figure 3). There are no nodes in area A, which allows for the following derivation of the distribution of x. A(x) FX (x)
(4)
where J0 = using the true positions and ranges. This means that for a known setup, when landmark constellation is given as xi , true position as x, and errors in ranges as W , the best estimation error will be limited by V ar[x] ≥ CRLB(Cov[x])11 and V ar[y] ≥ CRLB(Cov[x])22 . While we don’t have an analytical model for Euclidean’s uncertainties W , they are propagated through the network and used in the triangulation phase (details can be found in [10]).
fX (x)
= 2
Z
1 x
p p 1 − t2 dt = arccos(x) − x 1 − x2
= {X ≤ x} = e−λA(x)
= {X = x} = −λA0 (x)e−λA(x) √ p 2 = 2 1 − x2 e−λ(arccos(x)−x 1−x )
(5)
Unfortunately, there are no closed forms for the first moments E[x] and V [x] of this distribution, but it can be approximated as a Beta distribution. In Figure 4, numerically evaluated variance V [x] and expectation E[x] as functions of density λ are shown together with the approximation to beta distribution. Also in Figure 4 are shown values of ci
7
Figure 4: Mean and standard deviation of x, r
6 pdf(r)
0.9 Mean, Std [#hops]
Node degree = 10 Node degree = 20
5
1 0.8 0.7
4 3 2
0.6
1
E[r], Var[r]: analysis E[x], Var[x]: analysis E[x], Var[x]: Beta approximation E[x]: Simulation
0.5 0.4 0.3
0
0.2
0.2
0.4
r
0.6
0.8
1
0.1 0
0
5
Figure 5: Probability distribution of r for two node densities
10 15 20 25 30 35 40 45 50 Node degree
obtained from simulation1 in a network with 1000 nodes with increasing densities, which match very closely values obtained from the numerical evaluation for the respective densities. Since these values only depend on the density of the network, we precomputed a table with all the values necessary for the experiments in this paper, namely for densities up to 20 neighbors. In DV-hop, range estimates are obtained as ρi = hi ci , where hi is the number of hops to landmark i, and ci is approximated by E[x]. If geographic forwarding model is used to approximate shortest path to the landmark, after jumping hi times (assumed independent), the obtained range is E[ρi ] = hi E[x] and its variance V [ρi ]
= hi V [x]
(6)
Referring to Figure 3, we now explore the behavior of r, the actual distance traveled in one hop by the MFR policy. Its distribution is actually needed for the analysis of DVposition, but its characterization is based on the pdf of x. The pdf of r is obtained as a sum of probabilities of a next hop, summed over the entire circle of radius r.
fR (r)
=
Z
2π 0
f (r cos t) √X dt 2 1 − r2 cos2 t
(7)
r is not available in closed form, but in Figure 5 we can see its behavior through numerical evaluation, for two different densities. As expected, larger jumps are much more likely than short jumps, which means larger errors if r is to be used as a measure of distance. In Figure 4, the mean and standard deviation of r are shown as a function of density. In the remaining sections the model for range error is assumed to be linear in the number of hops. We also assume that the model extends to continuous distances, that is, the variance in range error is linear with the distance 1 We implemented our own null MAC, unit disk graph, event based simulator with minimal support for positioning. The simulator uses an error model for angle and range measurements, and a broadcast primitive with perfectly circular coverage. The decision not to use an existing simulator such as ns-2 was based on: 1. the need to use large topologies (10000 nodes), 2. the paper’s focus on the quality of the positions rather than on the communication aspects of the positioning protocols, 3. the reduced number of required primitives: node broadcast and DV shortest paths.
ρi V [ρi ] = E[x] V [x]. This allows us to estimate the range uncertainties W that can be merged in trilateration CRLB (4).
3.4 CRLB for DV-hop positioning The last step of the analysis is to evaluate how range measurements are assembled into a position estimate, and what the covariance of this estimate is. We assume that DV-hop uses a TTL value of h for all the aspects of its protocol, and that the fraction of nodes that are landmarks is f . This entails that the landmarks are assumed a spatial Poisson process with the rate f λ. A node is then able to contact on average n = π(hE[x])2 f λ landmarks situated in a circle of radius hE[x]. After applying the trilateration procedure (section 3.1), the covariance of the position estimate is bounded using (4). The actual derivation is detailed in appendix C, and the obtained covariance is:
CRLB(Cov[ru ])
=
1 V [x] I2 f πh λE 2 [x]
(8)
The CRLB of the positioning error covariance is inversely proportional to the fraction of landmarks deployed and to the TTL used by the method, but also depends on the density of deployment λ (second fraction). Even if V [x] and E[x] cannot be shown in closed form as functions of λ (5), their approximations using the Beta distribution can provide an estimate of the error for provisioning purposes. In order to verify the behavior of the algorithm when compared to the lower bound, we traced the three parameters f , h, and λ using simulation. Figure 6 shows the values of the x coordinate of position standard deviation (Cov[ru ]11 in hops) obtained by varying each parameter and keeping the other two constant, both in simulation, and using equation (8). The values used were λ = 10 ,h = 15,f = 0.025 and the π simulation was run in a network with 1000 nodes. Although the bound is not tight, it properly describes the trend of positioning performance with respect to the three parameters. The difference is a constant factor, some of the which is due to our simplifying approximations. One such approximation is the independence assumption between paths to different landmarks, which may not always be disjoint. This however, is only degrading the bound, not increasing it above the tight lower bound, which means DV-hop is actually closer to the bound than shown in our estimation. A closed form of the lower bound can be determined if we don’t use weighting in the multilateration process by setting
Figure 7: Normal approximation of uncertainty Figure 6: DV-hop positioning error as a function σr of density, landmark ratio, and simulation p TTL - p vs. lower bound analysis: CRLB(λ) CRLB(f ) p PSfrag replacements CRLB(h) σy σa σx 1.6 1.4 position stddev
B
simulation CRLB
1.2 1 0.8 0.6
errors, angle of arrival (AOA) errors and range errors are approximated, assuming their independence. In Figure 7, assume the uncertainty at node B is UB , and node A, using an AOA reading with uncertainty σa2 = V [a] and a range reading with uncertainty σr2 = V [r] infers its position with uncertainty UA .
0.4 0.2
PSfrag replacements
0
fraction of landmarks h=TTL
5
6
7
8
9
10 11 12 13 14 15 16
πλ=average degree 0.8
simulation CRLB
position stddev
0.7
UA = U B +
0.6
0.4 0.3
0.1 0
h=TTL
0
0.01 0.02 0.03 0.040.05 0.060.070.08 0.09 0.1 0.11
f =fraction of landmarks
0.8
simulation CRLB
position stddev
0.7 0.6 0.5 0.4
rx ry
–> »
0.3
U
0.2
PSfrag replacements πλ=average degree fraction of landmarks
»
=
(
0 σy2
–»
rx ry
–
(10)
n X
Ui−1 )−1
(11)
i=1
0.1 0
σx2 0
When angular errors are small, the eigenvalues of the covariance matrix are given by: σx2 = σr2 and σy2 = r2 sin2 (σa ), where r is the actual range measured. The unit eigenvectors rx and ry are given by the direction of the vector r, respectively its normal, or they can be seen as the columns of a rotation matrix. One advantage of expressing the uncertainty using a covariance matrix is that it can easily be cumulated as the position gets propagated. A second advantage is that positions obtained from different landmarks can be merged in order to get the best position estimate, as ˆ ˜ well as an estimate of its uncertainty. If xi yi is the estimate from landmark i, and Ui is the uncertainty accumulated along the path from landmark i, the final uncertainty is:
0.5
0.2
PSfrag replacements πλ=average degree
A
r
and the position estimate: 0
2
4
6
8
10
12
14
16
h=TTL [x y] =
(
n X [ xi
yi ] Ui−1 )U
(12)
i=1
W = I. In this case, equation (19) becomes 2 P 2 P J0> W J0
CRLB(Cov[ru ])
= 4 P
=
2 I2 n
xi ρ2 i x i yi ρ2 i
x i yi ρ2 P yii2 ρ2 i
3 5
(9)
where n is the number of landmarks contacted by a node. It is of course a weaker bound (lower than (8)), but it gives an easier interpretation of the achievable accuracy, by confirming the intuition that position estimates are improved when more landmarks are provided.
3.5 DV-position error In order to propagate the uncertainty at each step, we assume that each node’s position has an associated uncertainty covariance matrix. In order to assume normal spatial
This is a simplified form of a Kalman filter that combines several “readings” with associated uncertainties, in order to produce the most likely estimate and its uncertainty. Intuitively, the uncertainty grows with each error affected measurement (10), but can be reduced if several landmarks are used (11). The actual position estimate is in fact a weighted estimate considering all the independent estimates and their uncertainties (12). Since DV-position uses shortest path in propagate position estimates, the range measured between two successive nodes may be approximated as a function of deployment density using the random variable for range advancement r in the MFR algorithm (equation (7) and Figure 4). In order to get a closed form of the final uncertainty U , we make the simplifying assumptions that angular errors and range errors produce a circular error ellipse. This avoids the need to apply rotation matrices at each step of the analysis when moving from a landmark to a node, and also to
Figure 8: DV-position positioning error as a function of density, landmark ratio, and TTL for a circular error covariance (σ p pr = σap= 0.32) - simulation vs. analysis: U11 (λ) U11 (f ) U11 (h)
1
simulation analysis
0.8
0.35
σr 8
10
12
14
16
πλ=average degree
0.5 0.45
18
20
0
0
0.2
0.4
0.3 0.6
0.5 0.8
1.0
0.7
1
1.2
1.4
σa
simulation analysis
position stddev
0.4
0.3 0.25 0.2 0.15 0.1 0.05 0
h=TTL
0
0.01 0.020.030.04 0.050.06 0.070.080.09 0.1 0.11
f =fraction of landmarks
0.5
simulation analysis
position stddev
0.45 0.4
0.35 0.3 0.25 0.2
0.15 0.1
PSfrag replacements πλ=average degree fraction of landmarks
0.2
U11 =0.1 6
0.35
PSfrag replacements πλ=average degree
5 0.7
PSfrag replacements
0.1 0.05 0 4
=
0.4
0.15
fraction of landmarks h=TTL
a 1σ 1.3
0.6
0.25 0.2
PSfrag replacements
+
0.3
σr
position stddev
0.5 0.45 0.4
√ Figure 9: DV-position position error U11 : the error surface is projected onto the plane of parameters. The 0.3 isoline indicates performance of DV-hop in the same network (h = 15, f = 0.01, λ = 10 ). π
0.05 0
2
4
6
8
10
12
h=TTL
14
16
apply rotation matrices to combine estimates from different landmarks. Taking σr = σr assumes that σ is a relative deviation, meaning that uncertainty in measured range increases with the actual range, which is consistent with behavior of most radio hardware. Taking sin(σa ) = σ just looks at particular combination of errors, for example, for a standard angular deviation of 5.72o ' 0.1 a range error with a standard deviation of 10% of the measured range would be used. Again, this circular covariance is assumed just for the purposes of obtaining a closed form position error, as the actual algorithm operates with arbitrary covariances. Using the same assumptions of Poisson distribution of nodes, and TTL limited operation of APS, the derivation of U is detailed in appendix D and shown to be:
U
=
1 E[r2 ] σ2 I2 2f πh λE 2 [x]
(13)
Taking into account that σ is relative to the range measured, and E[r 2 ] = V [r] + E 2 [r], relation (13) is similar to the CRLB derived for DV-hop (8), exhibiting the same type of dependence on the TTL h, fraction of landmarks f , and density λ. We simulated DV-position in a large network with 10000 nodes in order to verify the validity of (13). In Figure 8 one parameter is varied, while keeping the other two constant at σ = 0.32, h = 5, f = 0.01, λ = 20 - the vertical axis shows π the standard deviation of the x coordinate of the achieved position, in hops. The small difference between the analysis and the simulation is justified by the possible lack of independence assumed by (11) and (12). Even when a high degree is used, 20 in this case, shortest paths from a node to faraway landmarks may share one or more edges. We confirmed this by tracking the values of Ui (20), or by using a single landmark, both of which were closely predicted by simulation. We haven’t yet developed an error model for Euclidean, although through simulation we found that ranges to landmarks are normally distributed. This means that the same CRLB used for the trilateration (4) can be used, which would likely provide uncertainty estimates similar to (8) and (13). DV -bearing however, is using triangulation as the final phase, and while its analysis is not included in this study, simulation based results are used in the following discussion, as a means to cover all options for the hardware capabilities.
4. DISCUSSION A closed form for the general case DV-position uncertainty U (11) would be more laborious to obtain, therefore we evaluated the behavior of the algorithm by simulation, also to accommodate comparison to the other two algorithms for which we don’t have closed form uncertainties (Euclidean and DV-bearing). We tracked the error produced by the algorithm for all combinations of AoA error and range error for values of σr = 0..0.9 and σa = 0.. π2 in the same network of 10000 nodes. We now fix the three parameters used in the previous section at f = 0.01, h = 15, λ = 10 , and π look at the algorithm’s behavior with respect to range error σr and angle error σa . The error surface corresponding
Figure 10: Partitioning of parameter space between 4 algorithms: DV-hop (range/angle free), DV-radial (angle based), Euclidean (range based), and DVposition (multimodal: range and angle based). 1
0.8 0.7
σr
0.6
Euclidean=DV−position DV−Radial=DV−position DV−Hop=DV−position=0.3
DV−radial
0.9
σr
0.5
+
0.4
PSfrag replacements
0.3
DV−hop
1.3 1σ a
DV−position
0.2
=
0.7 5
0.1 0
5. RELATED WORK
Euclidean 0
0.1
0.2
0.3
σa
0.4
This study confirms the intuition that multimodal sensing has the potential of higher performance than single measurement approaches (angle only, or range only), but can compete with range / angle free positioning only when high quality measurements are available. Single measurement solutions (range only, or angle only) require even higher accuracy measurements, but their hardware requirements are available today in prototypes used by the research community. Even if measurement error inherently builds up in a multihop estimation environment, careful provisioning of the network density and landmark ratios can provide low error positions for most combinations of capabilities.
0.5
0.6
0.7
to this combinations is projected into the parameter space with a few error levels indicated in Figure 9. For example, the curve labeled U11 = 0.1 indicates combinations of standard deviations for angle and range measurements which produce a positioning error standard deviation of 0.1 hops. An interesting isoline is the one for positioning error of 0.3 because that is the performance achieved by DV-hop in the same network. This curve almost fits a straight line that partitions the parameter space between the two algorithms. There is no point in using DV-position to get worse errors than DV-hop gets, the latter doing so without any measurement hardware. For this particular conditions, precision of the hardware must satisfy the inequality σr + 1.3σa < 0.75 in order to use anything else than a range free algorithm like DV-hop. Of course, this demarcation line will be different for different conditions. In order to further partition the parameter space, we ran DV-radial (an improved version of DV-Bearing) and Euclidean in the same network, in order to ascertain in which situations these two algorithms perform better than DVposition and DV-hop. The same surface used to generate the isolines in Figure 9 is now intersected with the curves produced by DV-radial and Euclidean. The resulted intersection lines span different error levels, but their projection into parameter space is indicated in Figure 10. The dashed line marks points (σa ,σr ) in which DV-position using angle errors of σa and range errors of σr performs as well as Euclidean, which only makes use of range measurements with the same error σr . Due to the increased sensitivity to propagated errors, DV-radial and Euclidean use parameters f = 0.05, h = 8, λ = 10 . π The common line of DV-hop and DV-position is the same from Figure 9, an isoline indicating positioning error of 0.3. This partitioning of the parameter space shows that in absence of highly performant measuring hardware for both angles and ranges, range free algorithms such as DV-hop, provide the best performance tradeoff. On the other hand, existing prototype hardware, such as the Cricket compass [9] provide AoA with an estimated σa = 0.1 ' 5o for certain conditions. This is not enough to choose the angle only algorithm DV-radial, but may be enough for DV-position, given a satisfactory range measurement performance (Medusa nodes [14] achieve centimeter accuracy).
Positioning in ad hoc networks has recently received a lot of attention mostly with the advent of sensor networks. Doherty [20] used convex optimization to determine positions based exclusively on connectivity. Also using centralized methods, but accepting both mere connectivity and range measurements, MDS-MAP [21] finds positions using multidimensional scaling. The centralized solutions may not be desirable in certain situations, but they can be used as performance benchmarks since they make use of the knowledge of the entire topology. One hop solutions are those in which nodes can directly contact a landmark, for example GPS. Bulusu [6] proposed the use of a grid of strong landmarks, so that any node can contact some landmarks. This solution is distributed, but landmarks here play more the role of an infrastructure, having to completely cover the entire network. In the class of multihop algorithms, AhLOS [14] is a method that divides the network into groups of nodes containing enough landmarks to solve a nonlinear system positioning all the nodes in the group. The method is distributed and localized, and is closest in spirit to APS. Analytic characterization of performance of a positioning algorithm is achieved for a simplified model of a square neighborhood in [22]. An idea similar with APS/DV-hop has been independently explored in the context of amorphous computing by Nagpal [13], who has also given an upper bound on the accuracy as 4Nπr , where r is the wireless avg radius, and Navg the average number of neighbors of a node. For the AhLOS method, [23] gives the Cram´er-Rao lower bound of the covariance of achieved positions. Moses [24] investigates the use of a calibration phase before the actual positioning, and gives the CRLB for calibration uncertainty. While most approaches address the average case for uniform deployment of nodes, Bischoff et al. [25] show that hop based algorithms are not competitive in the worst case deployment. We shortly analyzed another case of nonuniform deployment in a previous paper [10]. For a particular case of nonuniform density, DV-hop is shown to be less predictable in performance than Euclidean. Although Taylor series is the most used method for position estimation, including in GPS [16], closed form estimators that perform close to CRLB are available, one of which is presented in [26]. Although this paper only considers distributed/multihop algorithms, a more comprehensive study would include the centralized methods as well, which is part of our future work. An especially interesting direction is a comparison of the position error lower bounds achievable for a given network
setup in a centralized versus a distributed approach. Another aspect that is neglected so far is that of communication cost of obtaining positions. Since communication has the dominating cost in the functioning of most ad hoc network, it is interesting to evaluate the relationship between positioning error and energy spent by these algorithms.
6.
CONCLUSION
We analyze the error characteristics of range / angle free, range based, angle based, and multimodal positioning algorithms that use distance vector as their main propagation method. Using a simplified network model, we assume a uniform deployment of the nodes, without obstacles, and gaussian error measurements, in order to provide error bounds for APS algorithms. Range free and multimodal methods are analyzed and shown to produce errors that are inversely proportional with the fraction of landmarks and with the TTL associated with the methods. The dependence of the covariance error is characterized in terms of deployment density, even if no closed form is available. Partitioning of the parameter space between the four analyzed algorithms provides insights with respect to the hardware performance needed to achieve good positioning in a multihop environment.
7.
ACKNOWLEDGMENTS
This research work was supported in part by DARPA under contract number N-666001-00-1-8953 and NSF grant ANI-0240383.
8.
REFERENCES
[1] G. Finn. Routing and addressing problems in large metropolitan-scale internetworks. Technical Report ISI Research Report ISI/RR-87-180, University of Southern California, March 1987. [2] J. C. Navas and Tomasz Imielinski. Geographic addressing and routing. In ACM MOBICOM, Budapest, Hungary, September 26-30 1997. [3] Fabian Kuhn, Roger Wattenhofer, Yan Zhang, and Aaron Zollinger. Geometric ad-hoc routing: Of theory and practice. In 22nd ACM Symposium on the Principles of Distributed Computing (PODC), Boston, MA, USA, July 2003. [4] Jason Hill, Robert Szewczyk, Alec Woo, Seth Hollar, David Culler, and Kristofer Pister. System architecture directions for networked sensors. In ASPLOS-IX, Cambridge, MA, November 2000. [5] Y.-B. Ko and N. H. Vaidya. Location-aided routing (LAR) in mobile ad hoc networks. In ACM MOBICOM, October 1998. [6] Nirupama Bulusu, John Heidemann, and Deborah Estrin. GPS-less low cost outdoor localization for very small devices. In IEEE Personal Communications Magazine, Special Issue on Smart Spaces and Environments. October 2000. [7] Paramvir Bahl and Venkata N. Padmanabhan. RADAR: An in-building RF-based user location and tracking system. In INFOCOM, Tel Aviv, Israel, March 2000. [8] N.B. Priyantha, A. Chakraborty, and H. Balakrishnan. The cricket location-support system. In ACM MOBICOM, Boston, MA, August 2000.
[9] N.B Priyantha, A. Miu, H. Balakrishnan, and S. Teller. The cricket compass for context-aware mobile applications. In ACM MOBICOM, Rome, Italy, July 2001. [10] Drago¸s Niculescu and Badri Nath. DV based positioning in ad hoc networks. Telecommunication Systems, Kluwer, 22(1-4):267–280, January-April 2003. [11] Drago¸s Niculescu and Badri Nath. Ad hoc positioning system (APS) using AoA. In INFOCOM, San Francisco, CA, April 2003. [12] Drago¸s Niculescu and Badri Nath. Position and orientation in ad hoc networks. Elsevier Ad Hoc Networks, 2003. to appear. [13] Radhika Nagpal. Organizing a global coordinate system from local information on an amorphous computer. Technical Report 1666, MIT AI Lab, 1999. [14] A. Savvides, C.-C. Han, and M. Srivastava. Dynamic fine-grained localization in ad-hoc networks of sensors. In ACM MOBICOM, Rome, Italy, 2001. [15] Koen Langendoen and Niels Reijers. Distributed localization in wireless sensor networks a quantitative comparison. Technical Report PDS-2002-3, Delft University of Technology, The Netherlands, 2002. [16] B.W. Parkinson and J.J. Spilker. Global Positioning System: Theory and Application. American Institute of Astronautics and Aeronautics, 1996. [17] P. Bose, P. Morin, I. Stojmenovi´c, and J. Urrutia. Routing with guaranteed delivery in ad hoc wireless networks. In 3rd International Workshop on Discrete Algorithms and methods for mobile computing and communications, Seattle, WA, August 1999. [18] Leonard Kleinrock and John Silvester. Optimum transmission radii for packet radio networks or why six is a magic number. In IEEE National Telecommunications Conference, pages 4.3.1–4.3.5, Birmingham, Alabama, 1978. [19] T.K. Philips, S.S. Panwar, and A.N. Tantawi. Connectivity properties of a packet radio network model. In IEEE Transactions on Information Theory, volume 35, pages 1044–1047, September 1989. [20] L. Doherty, L. E. Ghaoui, and K. S. J. Pister. Convex position estimation in wireless sensor networks. In IEEE INFOCOM, Anchorage, AK, April 2001. [21] Yi Shang, Wheeler Ruml, Ying Zhang, and Markus Fromherz. Localization from mere connectivity. In ACM MOBIHOC, Annapolis, MD, June 1-3 2003. [22] Slobodan Simi´c and Shankar Sastry. A distributed algorithm for localization in random wireless networks. Technical report, UC Berkeley, EECS, 2002. [23] A. Savvides, W. Garber, S. Adlakha, R. Moses, and M. B. Srivastava. On the error characteristics of multihop node localization in ad-hoc sensor networks. In IPSN03, International Workshop on Information Processing in Sensor Networks, PARC, Palo Alto, CA, April 22-23 2003. [24] R. Moses, D. Krishnamurthy, and R. Patterson. A self-localization method for wireless sensor networks. Eurasip Journal on Applied Signal Processing, Special Issue on Sensor Networks, 2002. [25] Regina Bischoff and Roger Wattenhofer. Analyzing connectivity-based multi-hop ad-hoc positioning. In
Figure 11: Joint distribution of ρ and α. y R
FC
= P {cos(α) < c} = 1 −
fC
=
fC 2 (x) =
a ρ
E[cos2 (α)]
PSfrag replacements
=
x
arccos(c) π
1 √ π 1 − c2 1 p π x(1 − x) 1 2
(15) (16) 2
In a similar fashion, distributions for sin(α) and sin (α) are derived and shown to be identical with cos(α) and cos2 (α). Let S = sin(2α), with S ∈ [−1, 1]. Ps IEEE Percom, Orlando, Florida, USA, March 2004. [26] Y. T. Chan and K. C. Ho. A simple and efficient estimator for hyperbolic location. IEEE Transactions on Signal Processing, 42(8):1905–1915, August 1994.
fs E[sin(2α)]
= {sin(2α) < s} =
arcsin(|s|) 1 + 2 π
1 √ π 1 − s2 = 0 =
(17)
Using (14) , (15), and (17) we conclude that cos2 (α) ] ρ sin(2α) E[ ] ρ
APPENDIX A.
E[
EXPECTATIONS
Given a circle of radius R, with points that are Poisson dis2 2 tributed, we wish to find the expectations of cos ρ(α) , sin ρ(α) , and sin(2α) , where ρ and α are the polar coordinates. Re2ρ ferring to Figure 11, the joint distribution function for the polar coordinates is:
Fρα
= P {a < α, r < ρ} =
fρα
=
fρ
=
fα
=
ρ
= = f 1 (e) = ρ
1 E[ ] ρ
=
1 P {E ≤ e} = P { ≤ e} = ρ 1 1 P {ρ ≥ } = 1 − P {ρ ≤ } e e 1 1− 2 2. R e 2 2 3 ZR ∞e 2 2 de = 1 R 2 e2 R R
Let C = cos(α), with C ∈ [−1, 1].
=
0
sin2 (α) 1 ]= ρ R (18)
Since the Fisher information matrix uses derivatives of the log-likelihood, we will need the following partial differentiations: ∂ρi ∂x ∂ 2 ρi ∂x∂y
∂ 2 Fρα ρ = ∂ρ∂α πR2 2ρ R2 1 2π
E[
TRILATERATION CRLB
αρ2 1 2 πR2
x − xi ρi (x − xi )(y − yi ) = − ρ3i =
x is the position to be estimated, seen as a parameter here, whereas ρˆ are the normally distributed ranges to a landmark. Their expectations are the true ranges ρ, and their covariance is given by the diagonal matrix W .
meaning that the polar coordinates are independent with 1 , ∞). a Poisson deployment. Let E = ρ1 , with E ∈ [ R
F 1 (e) =
B.
=
p(ˆ ρ; x) = L(x; ρˆ) = = ∂L ∂x
=
2
(14)
∂ L ∂x2
=
∂2L ∂x∂y
=
s
det(W ) −1 exp{ [ˆ ρ − ρ]> W [ˆ ρ − ρ]} (2π)n 2
1 (2π)n − {ln( ) + [ˆ ρ − ρ]> W [ˆ ρ − ρ]} 2 det(W ) ˆ i − ρ i )2 X (ρ 1 (2π)n − [ln( )+ ] 2 det(W ) σi2 ˆ i − ρi ) ∂ρi X (ρ σi2
∂x 2 X 1 ∂ρi 2 ˆ i − ρ i ) ∂ ρi ] [−( ) + (ρ 2 σi ∂x ∂x2 2 X 1 ∂ρi ∂ρi ˆ i − ρ i ) ∂ ρi ] [− + (ρ 2 σi ∂x ∂y ∂x∂y
Fisher information matrix I(x) is defined as
R∞
I(x) = −
Z
−∞
Z
"
∂2 L ∂x2 ∂2 L ∂x∂y
− ∞
p(ˆ ρ; x)
−∞
∞
p(ˆ ρ; x)
−∞
because
Z
#
∂2 L ∂x∂y ∂2 L ∂y 2
Z
∞ −∞
p(ˆ ρ; x)dˆ ρ
∂2L p(ˆ ρ; x)dˆ ρ = ∂x2
X 1 (x − xi )2 dˆ ρ σi2 ρ2i
X (ρˆi − ρi ) (x − xi )(y − yi ) σi2
Z
∞
p(ˆ ρ; x)dˆ ρ = 1; −∞
J0> W J0
=
=
+
=
2 P 2 P x i yi 3 xi 3 E[x] 4 ρ ρ3 (19) P xiiyi P yii2 5 V [x] ρ3 ρ3 i i " P cos2 (α ) P sin(2α ) # i i E[x] ρi 2ρi 2 P P sin(2α sin (α ) i) i V [x] 2ρi ρi " # 2 E[ cos ρ(α) ] E[ sin(2α) ] E[x] 2ρ n 2 V [x] E[ sin(2α) ] E[ sin (α) ] 2ρ
dˆ ρ =
where the sums in (19) are over all the landmarks inside the TTL circle of radius hE[x], and αi are polar angle corresponding to (xi , yi ). Using the results in appendix A it 2 2 1 i) i) ] = E[ sin ρ(α ] = hE[x] , and is shown (18) that E[ cos ρ(α i i
ρ3i X 1 (x − xi )2 σi2 ρ2i
∞
p(ˆ ρ; x)ˆ ρdˆ ρ=ρ
i) E[ sin(2α ] = 0. 2ρi
−∞
In the same manner it is shown that −
Z
∞ −∞
which produces 2
2
= 4
P
P
I(x) = 4 P
2 1 (x−xi ) σi2 ρ2 i 1 (x−xi )(y−yi ) σi2 ρ2 i
x−x1 ρ1 x−x2 ρ2
y−y1 ρ1 y−y2 ρ2
...
...
= J0> W J0
CRLB(Cov[ru ])
X 1 (x − xi )(y − yi ) σi2 ρ2i
∂2L p(ˆ ρ; x)dˆ ρ = ∂x∂y
3>
2
1 (x−xi )(y−yi ) σi2 ρ2 P 1 (y−yi i )2 σi2 ρ2 i
5 W4
x−x1 ρ1 x−x2 ρ2
y−y1 ρ1 y−y2 ρ2
...
...
3
3 5
5
C.
=
D.
2
x1 ρ1 x2 ρ2
y1 ρ1 y2 ρ2
2
...
...
E[x] ρi V [x]
= 4 6 = 4
0 0
E[x] ρ2 V [x]
0
3 0 7 0 5 ...
0
0 1 hE[x]
#−1
Assuming there are ni hops to landmark i, and a circular error covariance:
Ui
=
ni » 2 2 X rj σ 0
' σ2
ni X
0 rj2 sin2 (σa )
–
rj2 I2
j=1
= σ 2 E[r2 ]ni I2 ρi I2 = σ 2 E[r2 ] E[x] Using derivations in appendix A, n X
Ui−1
=
i=1
0
1 hE[x]
UNCERTAINTY FOR DV-POSITION
3 5
"
hV [x] I2 n 1 V [x] I2 f πh λE 2 [x]
=
(J0> W J0 )−1
DV-HOP CRLB
W
=
j=1
W.l.o.g., assume the true position to be in the origin ru = 0. The variances in ranges are known to be inversely proportional with the distance in hops.
J0
V [x] E[x]n
=
The matrix J0 is in fact the Jacobian of the true ranges with respect to the true position. CRLB(Cov[x])
ρ
(
n X
E[x] X 1 I2 ρi σ 2 E[r2 ]
=
2n E[x] I2 σ 2 E[r2 ] hE[x]
Ui−1 )−1
=
hσ 2 E[r2 ] I2 2n
U
=
E[r2 ] 1 σ2 I2 2f πh λE 2 [x]
i=1
(20)