tinguishable by texture, trees, elds, shadows, roads, ... texture region is the boundary of a connected com- ..... 6] J. R. Bergen, \Theories of Visual Texture Per-.
Texture Segmentation of SAR Images By-Her Wang and Thomas O. Binford � Robotics Laboratory, Computer Science Department Stanford University, Stanford, CA 94305
Abstract The image surface of synthetic aperture radar imagery (SAR) is dominated locally by peaks and clusters of peaks, especially in terrain and vegetation areas. More globally, there are extended regions distinguishable by texture, trees, elds, shadows, roads, etc. We describe an algorithm which segments SAR images into a set of regions of pre-speci ed classes, based on two procedures: rst, the classi cation of peaks into N = 3 pre-speci ed classes, and second, a segmentation of the Delaunay triangulation of peaks into connected regions. A peak detection operator is used to estimate peaks in SAR images; thresholds are determined by using the histogram of the peak amplitude of each class. Peak amplitude was found to be the most useful discriminant by far in the multi-variate distribution in peak amplitude, peak width, and peak density. A Delaunay triangulation was established on the peaks of each class. Links in the triangulation were removed if they were unlikely for a population of that class. The boundary of a texture region is the boundary of a connected component of the modi ed Delaunay triangulation of the appropriate class of peaks. Linking by boundary traversal was developed to extract closed boundaries of each class. Experimental and simulation results are presented in SAR and synthesized images, respectively. Boundaries of regions can be determined to an accuracy of about 2 pixels.
1 Introduction One apparent characteristic of Figure 3 is the density of peaks nearly everywhere in the image. From the physics of SAR imaging, trihedrals are important in analyzing scattering from components of targets This research was supported by a contract from the Air Force, F33615-93-1-1281 through WPAFB from ARPA ASTO \Multi-Sensor ATR: Quasi-Invariants and High Accuracy Measurements in Bayesian Inference" and \Context and Quasi-Invariants in ATR with SAR Imagery". �
and in clutter analysis. Around peaks, the SAR impulse can be modeled by two-dimensional Gaussian functions. It is known that other components have di�erent scattering behaviors, e.g. dihedrals. An image may be interesting at the level of single peaks, e.g. a corner re ector may be interesting on its own. However, typically, physically similar areas are interesting as extended structures or regions, e.g. trees, grass, elds, buildings, and targets. Extended regions appear as textures of peaks. Thus, a second level of image model is piecewise regions of uniform textures of peaks. Textures could be complex, directional, and hierarchical; in fact they are complex, as in a plowed eld. But a class of textures appears useful that are isotropic, i.e. non-directional, distinguished by the values of peak amplitude, peak width, and peak density. Further, it appears empirically as though the local textures are distinguished by the probability density function (pdf) of peak amplitude. There is a growing interest in the development of algorithms which can extract boundaries automatically for a broad range of applications, such as conventional optical, radar and medical imagery [5][14]. In some domains, boundary detectors identify boundaries between surfaces with uniform re ectivity as oriented edgel discontinuities of order zero or one in the image intensity surface (e.g. [1]). Some special SAR images containing smooth objects (e.g. sea ice) can be segmented by an edgel-based operator[2]. Unfortunately, this kind of edgel-based algorithm can not be applied to general SAR images very generally because various features, either natural or man-made, are dominated by peaks. A peak-based texture segmentation operator is thus important for SAR images. This paper develops a new algorithm to extract closed boundaries of various features in SAR images. N classes of peaks, in our case tree, ground, and shadow, are extracted by a peak detector [3] and classi ed by thresholds. For an image including one single class of peaks, peak densities can be determined from distances of neigh-
bors, thus from lengths of links in the Delaunay triangulation; from this it determines discontinuities in peak density. Therefore, boundaries can be determined by traversal of peaks which are located at these discontinuities.
Eq.(1)) for narrow peaks is correct.
In Section 2, peak detection and classi cation are described brie y. In Section 3, the algorithm for texture segmentation is presented. In Section 4, the performance of this operator is examined in synthesized and real SAR images.
After applying a normalized Gaussian lter, the ltered peak can be written as
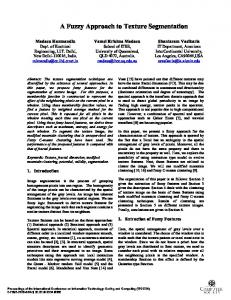
DIGITAL SAR IMAGE
I(x; y) = He?
? 2�yy2 2
f(x; y)
? = p 2 H�2 � 2 e 2 (� + � )(� + � ) x
x
PDF OF PEAK AMPLITUDE
x2
2�x 2
y
y
t
x2
2(�x 2 +�t 2 )
(1)
? 2(�y 2y+2 � 2 ) l
l
(2)
PEAK DETECTION
THRESHOLDS OF PEAK AMPLITUDE PEAK CLASSIFICATION
where � = mask width in transverse (or x) direction � = mask width in longitudinal (or y) direction t
l
DELAUNAY TRIANGULATION HISTOGRAM OF LINKS THRESHOLDS OF LINK LENGTH BREAKING LONG LINKS
For a separable two-dimensional Gaussian function, f(x; y), the level lines of f = 0 and f = 0 are parallel to the x-axis and y-axis, respectively. Therefore, the peak position can be determined by a unique point that satis es both conditions of f = 0 and f = 0 inside the 3 � 3 grid of pixels. x
y
x
y
LINKING BY TRAVERSAL
Peak width, � or � , can be obtained from quadratic equations (see Eqs.(3a) and (3b)) which are derived by Eq.(2) and its second derivative. f (x; y) = 1 x2 f(x; y) (� 2 + � 2)2 ? (� 2 + � 2 ) or [ ff ](� 2 + � 2 )2 + (� 2 + � 2) ? x2 = 0 (3a) x
BOUNDARIES OF OBJECTS (TREE, SHADOW, GROUND..)
Figure 1. Block diagram of the texture segmentation algorithm.
2 Peak Detection and Classi cation of Peaks A peak detector developed in previous work[3] is used to extract peak position, width and amplitude in SAR images. Based on pdfs of peak amplitude, peak width, and peak spacing for pre-speci ed classes of peaks, thresholds are determined interactively to distinguish groups of peaks, in our case, shadow, trees, and grass.
2.1 Peak Detection Extended elements in SAR images consist of many narrow peaks generated from imaged point scatterers, with the SAR impulse modeled by twodimensional Gaussian functions[3]. Experimentally, the assumption of separable Gaussian peaks (see
y
xx
x
x
t
t
xx
x
t
x
t
[ ff ](� 2 + � 2 )2 + (� 2 + � 2 ) ? y2 = 0 yy
y
l
y
l
(3b)
Peak Amplitude, H, can be solved by substituting peak width back to Eq.(2).
2.2 Peak Classi cation The peak-based classi cation algorithm is described in this subsection. To illustrate, detected peaks in a SAR sub-image are shown in Figure 3(c), and peaks of the non-shadow region are presented as black dots in Figure 3(e).
� Histogram Analysis and Thresholding
A peak detector is applied to selected training SAR images with N classes, respectively. From the detected peaks, the histogram and pdf of peak amplitude for each class is computed. For N pre-speci ed classes, (N ? 1) thresholds can be set in order to segment N regions. For example, three classes are considered in this case, i.e. tree, ground, and shadow. Based on Bayes' decision rule, two thresholds are chosen from the pdf of peak amplitude to separate peaks in tree regions and peaks in non-shadow regions, respectively.
� Peak Classi cation
Given a digital SAR image, we detect peaks at di�erent amplitudes by using the peak detector described in Section 2.1. The rst threshold is used to extract peaks of tree regions and the second threshold is used to extract peaks of non-shadow regions.
the points that have broken links. Those points are discontinuities in peak density.
� Stage 3: A Linker by Traversal
To connect those boundary peaks extracted by the last stage, a linker by traversal is used. In Figure 2, locally a vector, centered at one boundary peak (black dot) and pointed at the previous neighboring boundary peak (gray dot), is rotated by the minimum angle to the next neighboring boundary peak (gray dot). Boundary peaks are linked by this simple traversal algorithm. Finally, with knowledge of the average peak distance, the boundary can be determined by extending the linked curve by half of the average peak distance. An example is shown in Figure 3(e) for regions of shadow.
3 Texture Segmentation Algorithm After peak classi cation, (N ? 1) images can be obtained for an original image with N classes. The peak density can be determined by lengths of the links in the Delaunay triangulation. A histogram of link lengths can be generated to obtain a threshold. The hypothesis is that after breaking longer links, the boundary peaks (compared to edge pixels) can be extracted from discontinuities in the peak density. A linker by traversal connects boundary peaks to determine the closed boundary. This whole algorithm is shown in Figure 1 and described in the following three stages:
� Stage 1: Delaunay Triangulation
A triangulation of P is de ned as a maximal planar subdivision to interpolate a terrain given P sample of points[4]. Given a set P of points in the plane, any locally and globally equiangular triangulation of P is the Delaunay triangulation of P. Therefore, the optimal approximation of a terrain can be achieved by the Delaunay triangulation. One example of the Delaunay triangulation is shown in Figure 3(d) for the terrain of non-shadow. � Stage 2: Breaking Long Links The lengths of sides of triangles in the Delaunay triangulation is inversely proportional to the peak density locally as shown in Figure 3(d). The histogram of lengths of sides of all triangles from the Delaunay triangulation is computed to determine the threshold interactively. Links that are longer than the threshold are broken and recorded. It is intuitively clear that the boundary points can be obtained by collecting
Figure 2. An example of linking by traversal, where the dashed lines represent the broken links and solid lines are shorter than the threshold.
4 Simulation and Experimental Results The performance of this new texture segmentation operator can be evaluated by simulation results. Each test image is synthesized with two concentric square regions, i.e. shadow and non-shadow regions. The boundary of shadow is estimated and compared with the pre-speci ed boundary. The average estimation error is less than 0.2 pixel at peak density of 0.11 per pixel; the standard deviation of estimation is 1.5 pixels. At peak density of 0.14 per pixel, the average estimation error is less than 0.4 pixel and the standard deviation is 1.0 pixel. For real SAR images that we are deal with, the average peak density is about 0.125 per pixel resulting from the peak detector. Therefore, simulation results show
that this algorithm determines boundaries to an accuracy of about 2 pixels in SAR images. The experimental result is demonstrated in Figure 4, which shows the boundaries of tree and shadow regions in a sub-image of Figure 3(a).
5 Conclusion A peak-based texture segmentation operator has been developed to extract boundaries of regions with uniform textures in SAR images. Peak classi cation was accomplished with the pdf of peak amplitude for every pre-speci ed class. With the Delaunay triangulation, discontinuities in peak density can be determined by links of triangles. Thus, the boundary peaks can be extracted at discontinuities and linked by traversal. Finally, the boundaries can be re ned by extending these curves by half of average peak distance. The performance of this new operator is demonstrated by simulation and experimental results. Simulation results show that this algorithm determines boundaries to an accuracy of about 2 pixels.
References [1] J. Canny, \A computational approach to edge detection," IEEE Trans. Pattern Anal. Machine Intell., vol. 8, pp.679-698, 1986. [2] J. Helterbrand, \One-Pixel-Wide Closed Boundary Identi cation," IEEE Trans. Image Processing, vol. 5, no. 5, pp.780-783, 1996. [3] B. Wang and T.O. Binford, \Generic, Modelbased Estimation and Detection of Peaks in Image Surfaces," Proceedings of Image Understanding Workshop, Vol. 2, pp.913-922, 1996. [4] M. Berg et. al., \Computational Geometry by Example," Department of Computer Science, Utrecht University, the Netherlands, Chapter 9, pp.159-171, 1996. [5] H. Voorhees and Tomaso Pogglo, \Computing texture boundaries from images," Nature, vol.333, no.6171, pp. 364-367, 1988. [6] J. R. Bergen, \Theories of Visual Texture Perception," Spatial Vision", D. Regan, ED., CRC PRESS, 1991. [7] M. Unser, \Texture Classi cation and Segmentation Using Wavelet Frames," IEEE Trans. on Image Processing, vol. 4, no.11, pp.1549-1560, 1995. [8] A. Talukder et. al. \Model selection and texture segmentation using partially ordered Markov models," 1995 International Conference on Acoustics, Speech, and Signal Processing, vol.4 , pp. 2527-30, 1995.
[9] H. Chao et. al. \Texture segmentation using joint time frequency representation and unsupervised classi er," 1995 IEEE International Conference on Systems, Man and Cybernetics, vol. 1, pp.304-309, 1995. [10] X. Xie et. al. \Texture segmentation using visual nonlinearity," SPIE, vol. 2597, pp.142-149, 1995. [11] D. Dunn and W. E. Higgins, \Optimal Gabor lters for texture segmentation," IEEE Trans. on Image Processing, vol. 4, no. 7, pp.947-964, 1995. [12] D. J. Telfer and K. O. Pritchard, \Histogram correlation of the output from a small mask operator: a basis for adaptive texture segmentation," Fifth International Conference on Image Processing and its Applications, no. 410, pp. 841846, 1995. [13] K. Sutherland and J.W. Ironside, \AUTOMATIC TEXTURE SEGMENTATION USING MORPHORLOGICAL FILTERING ON IMAGES OF THE HUMAN CEREBELLUM," Proceedings of the 5th International Conference on Image Processing and its Applications,
no.410, pp. 777-780, 1995. [14] S. Krishnamachari and R. Chellappa, \Multiresolution Gauss-Markov random eld models for texture segmentation," IEEE Trans. on Image Processing, vol.6, no.2, pp. 251-67, 1995.