th
The 14 World Conference on Earthquake Engineering October 12-17, 2008, Beijing, China
Estimation of Modal Parameters of Buildings by Wavelet Transform 1
M.R. Hamtaei and S.A. Anvar
2
1 2
Graduate Student, Dept. of Civil & Environmental Engineering, Shiraz University, Shiraz, Iran Assistant Professor, Dept. of Civil & Environmental Engineering , Shiraz University, Shiraz, Iran Email:
[email protected],
[email protected]
ABSTRACT : In this paper, determination of structural dynamic characteristics by wavelet transform (WT), which is capable of yielding time-frequency representation of structural response, is employed. In this application of WT, to achieve optima simultaneous localization in time and frequency domains the shape of mother wavelet has been controlled. For this, modified Morlet wavelet, having two free parameters, was used. The optimum values of these two parameters were obtained by employing an optimization technique which minimizes the entropy of the continuous wavelet transform, while varying these parameters simultaneously. The effectiveness of this algorithm in determination of modal parameters of buildings, especially those having close modal frequencies, was investigated and results is presented in this paper. Moreover the results of WT have been compared with those of AVS and NExT-ERA techniques, especially with regard to the number of identified modes. KEYWORDS:
modal analysis, wavelet transform, ambient vibration, time-frequency representation
1. INTRODUCTION Experimental modal analysis is the process of extracting modal parameters of structures; namely modal frequencies, damping ratios and mode shapes; from their measured vibration data. The system would be set into vibration either by forced excitation or ambient sources such as wind, traffic and micro tremor. For large-scale civil engineering structures in service, it is impractical to excite the structure by mechanical devices, and thus ambient excitation input, which is often immeasurable, becomes the only excitation source of vibration and can be used in the modal identification of output-only systems approach; i.e. in which the modal parameters must be estimated without knowing the excitation input to the system. To overcome the inability of the Fourier-based approach to capture time-varying features of structure, some new tools such as Wigner–Ville distribution, wavelet transform (WT) and Gabor transform, capable of yielding time–frequency representation of response, have been developed and widely used in system identification and damage detection. Neild and McFadden (2003) have presented a brief summary of applications of time-frequency distribution tools for analysis of structural vibrations. Wavelet analysis may be viewed as an extension of the traditional Fourier transform with adjustable window location and size. Merit of wavelet analysis lies in its ability to examine local data with an ‘‘adjustable focus zoom lens”. The WT has the ability to decouple the measured multimodal signal to monomodal signals, which when processed by identification schemes of single-degree-of freedom (SDOF) systems, lead to modal parameters. WT has been applied to the simulated data of a 3-DOF system and also ambient vibration data of Shiraz University Central Administration Building (SUCAB). The results of these applications along with their comparison with those of AVS and NExT-ERA techniques is presented in section 3 of this paper, whereas the continuous wavelet transform; its concept, basics, properties and ridges of its profile; are introduced in section 2. Finally, the conclusions are presented in Section 4 of the paper. For details of the technique and its application refer to Hamtaei (2007).
th
The 14 World Conference on Earthquake Engineering October 12-17, 2008, Beijing, China
2. CONTINUOUS WAVELET TRANSFORM AND MODAL PARAMETER IDENTIFICATION 2.1. Basics Fourier transform of a function (or a signal) x(t) is a linear transformation based on the decomposition of this function into its basis elementary functions e-iωt. Fourier transform is more like a decomposition of x(t) into its frequency components, and this has a serious drawback. In transforming to the frequency domain, time information is fully lost. However a localized decomposition can be obtained using time-frequency transform. The windowed Fourier transform is an example of such time-frequency localization. The Short Time Fourier Transform (STFT) represents a compromise between the time and frequency based approaches. However, the drawback of STFT is that once a particular size for the time window is chosen, that window has to be the same for all frequencies. Many signals require a more flexible approach; one where the window size can vary to determine more accurately either time or frequency characteristics of the signal. Wavelet analysis is the next logical choice: a windowing technique with variable-sized regions. The continuous wavelet transform of the function x(t) is defined as
W ( a, b) =
1
+∞
a ∫-∞
x(t ) ψ (
t −b ) dt a
(2.1)
Where ψ (t ) is the mother wavelet, b is the time domain localizing parameter of the wavelet function, and a is the dilatation or scale parameter defining the analyzing window stretch. W(a, b) shows the local information about x(t) at the time t = b and with scale a. The idea of the continuous wavelet transform is to decompose a function x(t) into wavelet coefficients W(a, b) by using mother wavelet functions. The wavelet coefficients represent a measure of the similitude between the dilated and shifted wavelet and the function x(t) at time b and scale a. Hence, the dominant frequency components of the signal create wavelet coefficients with high standing amplitudes and this is the basis of the WT-based modal identification. 2.2 Modulus and Phase of WT
The WT of a signal results in a series of complex-valued coefficients. To understand the relation between the modulus and phase of these coefficients and estimate of modal parameters, a general signal can be considered as
x(t ) = A e −ςωnt cos(ω d t + φ0 ) = k (t ) cos [ϕ (t )]
(2.2)
where k(t) and φ(t) are respectively amplitude envelop and phase function of the signal. For analysis of the above signal we select the complex Morlet wavelet as the mother wavelet. It is defined in the time domain as 2 ψ (t ) = e −0.5t eiω0t
(2.3)
where ω0 is the wavelet frequency. The coefficient of morlet WT of x(t) is 2 W (a, b) = a k (t ) e −(a ϕ (t ) − ω0 ) eiϕ (t )b .
(2.4)
The modulus and phase of the wavelet coefficient evaluated at scale a = ai are
W (ai , b) = ai k (t ) e −( ai ϕ (t ) −ω0 )
2
and ∠ [W (ai , b)]=ϕ (t )
(2.5)
th
The 14 World Conference on Earthquake Engineering October 12-17, 2008, Beijing, China
Eqn. 2.5 can be used to evaluate time varying amplitude envelope k(t) and phase φ(t) of the analyzed signal.
k (t ) =
W ( a i , b) ai e
−( ai ϕ ( t ) − ω0 ) 2
= A e −ξ ωn t and ϕ (t ) = ω d t + ϕ 0
(2.6)
2.3 Ridges of the Continuous Wavelet Transform
It can clearly be seen that the time-frequency representation of a signal is localized around a certain number of points, and it is tempting to associate such points with its harmonics. The square of the real part of the CWT coefficient can be interpreted as an energy density distribution over the time- frequency plane. The energy of the signal is essentially concentrated on the time-frequency plane around a region called the ridge of the time-frequency transform. In other words, the ridge of the time-frequency transform is the region containing the points defined by fi = fi(t), where the amplitude of the time-frequency transform is maximum. In such cases, only the ith harmonic related to the frequency fi has a significant contribution, while the contribution of other (n-1) harmonics appears to be negligible, Staszewski (1997). Note that the quality of above approximation is dependent on the correlation between the harmonics. The ridges are identified by seeking out the points where the time-frequency transform coefficients take on local maximum values. 2.4 Estimation of Natural Frequencies, Damping Ratios, and Mode Shapes
The corresponding frequency of each ridge is one of the natural frequencies of a MDOF system. From Eqn. 2.5, it is clear that the modulus of the CWT coefficient along a ridge is a function of ξ and f.
W (ai , b) = A0 e −2π ξi fi t
(2.7)
This equation shows the amplitude envelop of each modal component. Since the value of fi corresponding to each mode can be estimated from the ridges of CWT, Eqn. 2.7 has only 2 unknown parameters, A0 and ξi. If the modulus of each skeleton of CWT is fitted by function y = A e
error =
−λ t
, the error is defined as
∑ [y(t j ) − W (ai , t j ) ]
2
.
(2.8)
j
The modal damping ratio can be obtained by minimizing the error as defined in Eqn. 2.8 to get λ. Then
λ = 2π ξ i f i ⇒ ξ i =
λ 2π f i
(2.9)
To obtain the mode shapes, the response of the jth DOF is acted upon by CWT and the real part of the coefficients corresponding to the ridge of the ith mode, named Cij(tk), normalized with respect to rth DOF coefficients gives the ith mode shape as ⎛ C ij (t k ) ⎞ ⎟ ⎟ ( ) C t ir k ⎝ ⎠
φij = mean ⎜⎜
(2.10)
Eqn. 2.10 shows that simultaneous recording of all DOF responses are required if one wants to estimate mode shapes of a MDOF system.
th
The 14 World Conference on Earthquake Engineering October 12-17, 2008, Beijing, China 2.5. WT Resolution
The validity of decoupling procedure described in section 2.3 is strictly linked with the wavelet capability of separating close different harmonic components in the time signal. For a given time–frequency representation, it is impossible to achieve perfect time-frequency localization, because of the Heisenberg uncertainty principle, (Carmona et al.1998). This means that a compromise between time and frequency localization by controlling the shape of mother wavelet is a must. To have control on the shape of mother wavelet, modified Morlet wavelet having two free parameters was used.
1
ψ (t ) =
π fb
e
−t2 i 2π fc t fb
e
(2.11)
Kijewski and Kareem (2003) investigated the impacts of modal separation and end-effect on the time–frequency resolution and suggested guidelines for parameter selection. To separate two closely spaced frequency components fi and fj with a difference of Δfi,j and an average of fi,j, the parameters fb and fc have to satisfy
f i, j
f b ≥ 2α
fc
(2.12)
2π Δf i , j
End-effect, has also inevitable influence on the quality of the wavelet coefficients. Based on Kijewski and Kareem’s study (2003), to limit the time length of the two ends of the ith modal response record that should be discarded, tdisc, the parameters fb and fc should satisfy the following condition
f b f c ≤ t disc
2 fi
(2.13)
β
To achieve optimum time and frequency resolution, fb and fc should satisfy Eqns. 2.12.and 2.13. There exist numerous pairs of fb and fc for this selection. It is necessary to introduce an additional criteria to select optimum values of fb and fc. The minimum Shannon entropy criterion, (Yan 2006), is employed here. Assume that W(ai , t), i = 1, 2, . . . ,M is a set of wavelet coefficients. The Shannon wavelet entropy is calculated by
WE = −
∑ pai log( pai ) where pai = ∑ aiEai E
i
& Eai =
∑ Wψ [x](ai , b j ) 2
(2.14)
j
i
So the problem reduces to a nonlinear constrained optimization given by
Minimize WE = − ∑ p ai log( p ai )
subject to
i
2α
fi ≤ 2π Δf i
f b f c ≤ t disc
2 fi
β
, f b > 0 and f c ≥
5 2π
(2.15)
3. APPLICATION
The method outlined in section 2 was applied to two systems; a simulated 3DOF system and SUCAB. The results are presented in sections 3.1 and 3.2, respectively. This approach does not require knowledge of the excitation, so it is applicable to any problem where the excitation is from ambient sources and is, generally, not
th
The 14 World Conference on Earthquake Engineering October 12-17, 2008, Beijing, China
measurable. For the structures subjected to the ambient excitation, the Random Decrement Technique (RDT) is used to obtain the free vibration response, upon which the WT is employed to identify the modal parameters (Kijewski 2003). 3.1. Ex. # 1, Simulated 3 DOF System
To evaluate the ability of the WT in identifying the harmonics of structural systems when the structure has closely spaced harmonics and the recorded response is polluted by noise of considerable strength, the free vibration response of a special 3DOF system was analyzed by WT. The pollution of signal with noise prior to being analyzed by the WT was carried out by adding a zero mean Gaussian noise, with a certain signal-to-noise ratio (SNR) level, to the recorded signal; the SNR level being defined as SNR = 10 log (
var(signal ) ) var(noise)
(3.1)
where var stands for variance of the signal or noise. The differential equation system governing the motion of this system is
[M ]{&x&}+ [C ]{x&}+ [K ]{x}= {0}
(3.2)
Where M and K are the system property matrices of the structure defined as follows ⎡ 4 −1 0 ⎤ [M ] = m [I ] , [K ] = k ⎢⎢− 1 2 − 1⎥⎥ and ⎢⎣ 0 − 1 4 ⎥⎦
⎧0.05⎫ ⎪ ⎪ ξ = ⎨0.03⎬ ⎪0.02⎪ ⎩ ⎭
(3.3)
where m = 1000 kg and k = 10 kN/m. The eigenfrequencies of the structure are f1 = 0.57 Hz, f2 = 1.01 Hz and f3 = 1.09 Hz. Note that the frequencies of the last two modes of the structure are rather close as compared to the first one. The damped free vibration response of the system subjected to a randomly generated initial displacement was calculated by using a fourth-order Runge–Kutta procedure. The time increment chosen corresponded to a sampling frequency of 10 Hz and the total record time was 100 sec. For investigating the effect of noise, the response signal was then polluted with noise level of SNR=15 dB. To decrease the impact of end effect as much as possible, the minimum possible value of f c so by substituting all the parameters values into Eqns. 2.12.and 2.13, we have Δf 2 , 3 = 0.08 Hz and
⎛ f 2,3 f 2 , 3 = 1.05 Hz ⇒ ⎜ 2 α ⎜ 2π Δf 2 , 3 ⎝
⎞ ⎟ = 7.42 ⇒ ⎟ ⎠ max
fc
f b was selected,
f b ≥ 7.42
(3.4)
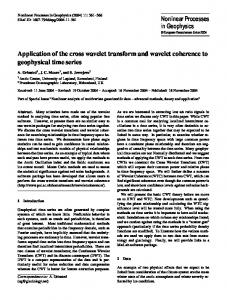
Taking f c f b = 7.42 and solving Eqn. 2.15, the optimum values of fb and fc become respectively 1.29 and 6.54. The CWT is then applied to the polluted free vibration response of all 3 DOFs of system, separately. As mentioned in Section 2 the CWT is a signal decomposition procedure working as a filter in the time–frequency domain, so that it becomes possible to isolate each mode. The CWT of the free vibration response of the first DOF of this system is shown in Fig. 1 with its amplitude in Fig. 1.a and its profile at 0.2 sec in Fig. 1.b. The result of such modal decoupling presents itself by the ridges of the amplitude frequency diagram, Fig. 1.b.
th
The 14 World Conference on Earthquake Engineering October 12-17, 2008, Beijing, China 0.14
Continuous Wavelet Transform Amplitude
1.5
↓ 1.09 0.12
0.16
0.1
↓ 0.56
0.12
1
Amplitude
F re q u e n c y (H z )
0.14
0.1
0.08
↓1
0.06
0.08 0.5 0
20
40 60 Time (sec)
80
0.06
0.04
0.04
0.02
100
0
(a): Amplitude
0.5
1
1.5 2 Frequency (Hz)
2.5
3
(b): Instantaneous frequency spectra at t = 0.2 sec
Figure 1 Continuous wavelet transform of 1st DOF displacement Damping ratio of each mode was obtained by curve fitting procedure as presented in section 2.4, Fig. 2. Estimated natural frequencies and damping ratios of this simulated system that were obtained by analyzing of polluted free vibration response of each DOF, are shown in Table 3.1. Referring to Table 3.1 it is seen that no values are obtained from 2nd DOF response for mode # 2. It is understandable because the 2nd DOF has zero value in the second mode, see Fig. 3. Estimated mode shapes of the system, using Eqn. 3.7, are shown in Fig. 3. -3
Amplitude
12
Free Vibration Envelope of Mode #1 Component
x 10
Data Exponential Curve Fitting ← 0.62082 * exp ( 2*π*0.56 * 0.04971 * t )
10 8 6 4 23
23.5
24
24.5
25
25.5
26
26.5
27
Time (sec)
Figure 2 Curve fitting on free vibration envelope of first mode component for estimation of ξ Table 3.1. Estimated dynamic characteristics of 3-DOF simulated system DOF # 1 DOF # 2 DOF # 3 Mode 1 Mode 2 Mode 3
fi
e%
ζi %
e%
fi
e%
ζi %
e%
fi
e%
ζi %
e%
0.56 1.00 1.09
1.08 0.99 0.00
4.97 2.99 1.07
0.60 0.33 7.00
0.56 ---1.09
1.08 ---0.00
4.84 ---1.08
3.20 ---8.00
0.56 1.01 1.09
1.08 0.00 0.00
4.92 2.95 1.10
1.60 1.67 10.00
M ode S hape # 1
3
3
M ode S hape # 2
3
.5
2 .5
2 .5
2
2
2
.5
1 .5
1 .5
1
1
1
.5
E s t im a t e d M o d e S h a p e 0 .5 E x ac t M ode S hape
M ode S hape # 3
0 .5
R e f e re n c e L in e 0
0
1
2
3
0 -2
-1
0
1
0 -1
0
1
Figure 3 Mode Shapes of 3-DOF System
th
The 14 World Conference on Earthquake Engineering October 12-17, 2008, Beijing, China 3.2. Ex. # 2, SUCAB
To investigate the effectiveness of the hybrid RDT and WT technique in determination of modal parameters, the results obtained by Karbasi (2003) for Shiraz University Central Administration Building (SUCAB) were used. This building is an 8-story concrete frame shear wall with total height of 31m and trapezoidal plan dimensions of 15m in N-S direction and 45m in E-W direction. The response of the structure subjected to ambient excitation, sampled at a frequency of 233 Hz for a duration of 550 sec, were recorded by three sensors having three different configuration schemes at 3rd, 6th and 8th story levels, (Karbasi, 2003). The time history of E-W direction velocity response of the roof level of the building when subjected to ambient excitation is shown in Fig. 4.a and its free vibration response constructed by RDT is shown in Fig. 4.b. 100
50
80 40
60 40
30
Velocity
Velocity
20 0 −20 −40
20
10
0
−60 −10
−80 −100
0
1
2
3
4
Time (sec)
(a): Ambient Vibration Response
5
−20
0
1
2
3
4
5
Time (sec)
(b): Free Vibration Response by RDT
Figure 4 Time history of roof velocity response of SUACB in E-W direction The continuous wavelet transform of the free vibration response of the 8th floor of this building in N-S and E-W directions are processed by the procedure outlined in section 2 and the corresponding estimated values of the frequencies and damping ratios are presented in Tables 3.2 and 3.3. It is to be noted that parameter i does not necessarily represent the modes number; these are just the ridge number in their respective amplitude profiles. Also, note that there are four frequencies common between Tables 3.2 and 3.3, i.e. 1.8, 5.8, 7.6, and 12.5 Hz. The building under study is not regular in plan, and hence some of its modes have both N-S and E-W vibration components and thus both N-S and E-W sensors had picked contribution from these modes. Table 3.2 Detected modal frequencies & damping ratios from N-S direction signal i 1 2 3 4 5 6 7 8 fi (Hz) 1.8 5.8 7.6 8.2 10.7 12.5 13.5 17.5 ξi % 0.9 1.29 2.7 1.4 1.27 1.31 1.6 3.2 Table 3.3 Detected modal frequencies & damping ratios from E-W direction signal i 1 2 3 4 5 6 7 fi (Hz) 1.8 2.3 5.8 7.6 9.5 12.5 18.8 ξi % 0.9 0.85 1.1 2.03 3.8 4.27 4.05 Arranging, in ascending order, the estimated frequencies listed in Tables 3.2 and 3.3 for N-S and E-W directions, respectively, one sees that wavelet transform has successfully identified eleventh modal frequencies of SUCAB. These are listed in Table 3.4 along with the corresponding values that AVS and NExT-ERA techniques could identify (Karbasi, 2003 & Rahmatkhah, 2005). Since the simultaneous vibration records of only 3 stories of SUCAB were recorded, mode shapes of this building could not be identified.
th
The 14 World Conference on Earthquake Engineering October 12-17, 2008, Beijing, China
Table 3.4 Modal frequencies & damping ratios for Shiraz University Central Administration Building Mode Number i 1 2 3 4 5 6 7 8 9 10 11 fi(Hz) 1.8 2.3 5.8 7.6 8.2 9.5 10.7 12.5 13.5 17.5 18.8 WT+RDT ζi % 0.9 0.85 1.29 2.7 1.4 3.8 1.27 4.27 1.6 3.2 4.05 fi(Hz) 1.84 2.23 5.66 7.23 NExT-ERA ζi % 5.6 0.60 1.32 1.72 fi(Hz) 1.82 2.28 AVS ζi % 5.04 11.33 -
5. CONCLUSION
This paper presents the results of a study to detect modal parameters of civil structures by wavelet transform, and discusses the application of this technique to the simulated data of a 3 DOF system with 2 closely modes and the ambient vibration data of Shiraz University Central Administration Building. This study has shown that the wavelet transform could be effectively used for determination of modal parameters and it is advantageous over AVS and NExT-ERA with regard to the number of modes that can be identified especially if the system has modes that are close with regard to frequencies and mode shapes. For modal frequencies and damping ratios estimation, the response signal of only one channel is enough. However, for determination of mode shapes signals from more channels recorded at different DOF are required. By optimizing the values of parameters fb and fc of the modified Morlet wavelet, closely spaced modal frequencies and damping ratios could be identified. As with the damping ratios of the buildings evaluated by this method, no logical trend is observed, the same as with AVS and NExT-ERA.
REFERENCES
Carmona, R., W. L. Hwang, and B. Torresani, 1998. Practical Time-Frequency Analysis, Academic Press, New York. Hamtaei, M. R., 2007. Estimation of modal parameters of building by wavelet transform, M.Sc. Thesis, Shiraz University, Shiraz. Karbasi, A., 2003. Evaluation of the Iranian seismic code formula for fundamental period of buildings and refinement of analytical models based upon ambient vibration survey results, M.Sc. Thesis, Shiraz University, Shiraz. Kijewski T., and A. Kareem, 2003. Wavelet transforms for system identification in civil engineering, Computeraided Civil and Infrastructure Engineering 18, pp. 339–355. Neild, S. A., P. D. McFadden, and M. S. Williams, 2003. A review of time-frequency methods for structural vibration analysis, Engineering Structures 25, pp. 713–728. Rahmatkhah, R., 2005. Estimation of modal parameters of structures using ambient vibration measurements, M.Sc. Thesis, Shiraz University, Shiraz. Staszewski, W. J., 1997. Identification of damping in mdof system using time-scale decomposition, Journal of Sound and Vibration 203, pp. 283–305. Yan, B. F., A. Miyamoto 2006. Wavelet transform-based modal parameter identification considering uncertainty, Journal of Sound and Vibration 291, pp. 285–301.