Jan 1, 2001 - Scott et al. (1998). Sacramento. 1,358.1. McPherson et al (1999a). Modesto. 1,501.2. 2,163.6. 924.3. McPherson et al. (1999b). San Joaquin.
Journal of Environment and Earth Science ISSN 2224-3216 (Paper) ISSN 2225-0948 (Online) Vol.7, No.10, 2017
www.iiste.org
Estimation of Temperature Humidity Index Value Based on CO2 Anthropogenic Emission and Green Open Space of Bogor City Using Dynamic System Approach Tajuddin Bantacut1* Muhammad Iqbal Department of Agroindustrial Technology - Bogor Agricultural University IPB Dramaga Campus, Post Box 220, Bogor 16680, Indonesia Abstract Urban development in Bogor City has been responsible for the urban heat island effect and raised the air temperature. The main cause is the increasing of anthropogenic emission from fossil energy combustion and municipal solid waste treatment. On the other hand, the increasing of built up space and declining green open space also lead the increasing of the air temperature. Limited green open space reduced the capacity of environment to mitigate (purifying) itself. The purpose of this study was to: (i) estimate the minimum needs of green open space in accordance with its CO2 sink capacity, (ii) analyze possible policy to support green growth based development in Bogor City, and (iii) estimate CO2 emission and Temperature Humidity Index value in the future using dynamic system approach. The result of this research, especially the study of the conditions of urban heat island effect, indicated that Bogor city would experience the urban heat island effect where the value was higher than 270C in 2031. A Green scenario was developed using simulation is expected to be able to control urban heat island up to 2048. Moderate scenario has shown that the urban heat island effect will be experienced in 2039. Pessimistic scenario estimated that Bogor city would experience urban heat island effects in 2028. Keywords: anthropogenic emission, built up, dynamic system, green open space, urban heat island 1. Introduction Bogor is a medium city located about 45 km southern the capital city of Jakarta. This position brings about rapid development of city in the areas of settlement, industrial zones, transportation, and commercial. Population growth (migration and local) pushes more rapid service and infrastructure development. In 1995, its population was 647,912 people increased more than 35% to 879,138 in 2005. Development caused significant changes in land uses and population growth multiplied the use of all resources contribute to local and regional climate change. The main indicator of these changes are an increasing of temperature humidity indices. BMKG Bogor (local meteorology body) released data showed temperature increased from 26.04oC in 2001 to 27.040C in 2005. This institution also noted an unusual change of 320C in April to 26.730C in Mei 2011 which should normally happen to August of the year. Any change in temperature influences the level of convenience and other environmental services. Temperature Humidity Index (THI) is one possible tool to understand the relationship between living convenience in the city and temperature and humidity. Population growth of Bogor City tends to increase to the average of 2.7% per year from 2001 to 2014. The population tend to be evenly distributed among all areas of Bogor City. The largest population of 2014 was located in West Bogor District with 228,860 people occupying an area of 32.85 ha, the lowest population was in East Bogor District with 101,984 people occupying an area of 10.15 ha. Table 1 shows the development of population of Bogor City during the interval 2001-2014. 2. Current States and Theoretical Background 2.1. Transportation and Fuel Requirement Dahlan (2007 ) has warned and predicted that vehicles population influence much the fuels consumption and city air pollution in Bogor. The main fuel are gasoline. Vehicles are private cars (PC), public cars (GC), truck, buses and motorbike. Figure 1 shows vehicle population and gasoline consumption. Adityawati (2008) estimated kerosene demands related to government policy on saving fuel by converting it to LPG (liquid petroleum gas) showed that kerosene and LPG are substitute and inelastic which price will not affect the amount of demand. In reverse, since LPG and kerosene are substitutes, LPG price increases will negatively affect the demand for kerosene. Similarly, rising kerosene prices will affect the demand for LPG gas negatively. Other variables affecting demand for kerosene and LPG gas include Gross Domestic Product (GDP) and population.
13
Journal of Environment and Earth Science ISSN 2224-3216 (Paper) ISSN 2225-0948 (Online) Vol.7, No.10, 2017
www.iiste.org
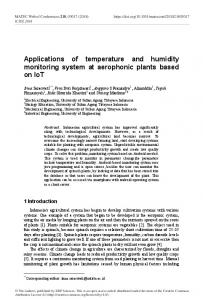
Table 1. Population of Bogor City 2001-2014 Year Population 2001 760,329 2002 789,423 2003 820,707 2004 831,571 2005 855,085 2006 879,138 2007 905,132 2008 942,204 2009 946,204 2010 977,054 2011 987,315 2012 1,004,831 2013 1,013,019 2014 1,030,720 Source: Bogor City Statistics Office Figure 1 shows increased gasoline consumption is in line with the increased in personal car. The increase in gasoline demands occurred in 2004 in line with the growth of motor vehicles and private cars that increased in 2005. Similar situation occurred in 2008 where the consumption increased correlated with number of private cars in 2007 which demanded gasoline distribution in Bogor City. General Passenger Cars (GC) numbers has been relatively small growth due to the policy issued by the Bogor City government to limit its growth. However, GC remains main contributors in increasing the gasoline consumption of Bogor. Figure 2 shows that the increased diesel fuels consumption in line with the growth number of trucks and buses. There was declination of diesel consumption of 2008 to 2010 which caused by inter-city buses that refilling gasoline at gas stations outside the City. Then, the increase in diesel consumption is not much related to the increase in the number of buses. Kerosene and LPG are basic goods of society and mutually substitute. Figure 3 shows that the increased consumption of kerosene and LPG gas is positively correlated the number of population where an increase in population will lead to an increase in these two fuels consumption. It can be concluded that the increasing consumption of kerosene and LPG is in line with population. An interesting thing happened to 2007 where kerosene consumption felt gradually followed by an increase in LPG gases consumption of the same year. This was due to the government conversion program from kerosene to LPG. Conversion is made with withdrawal of subsidies on kerosene so that the price increased then followed by limited supply of the market.
Figure 1. Vehicle population and gasoline consumption (Dahlan 2007)
14
Journal of Environment and Earth Science ISSN 2224-3216 (Paper) ISSN 2225-0948 (Online) Vol.7, No.10, 2017
www.iiste.org
Figure 2. Vehicle population and diesel oil consumption 2.2. Emission Emission is calculated based on the amount of fuel consumed (gasoline, diesel oil, kerosene, LPG gas) with their emission factors. The amount of emissions is equal to amount of fuel multiplied by each emission factor. The emission factor is number of pollutants per unit of energy, mass, or volume resulting from the use of each energy source. Then, the amount of emission is determined by multiplying the volume of fuel used with the emission factor. Based on figure published by IPCC (2006), diesel oil has the highest emission factor followed by kerosene, gasoline and LPG. Considering the biggest use of fuel were from gasoline consumption, it can be regarded as the biggest contributor of CO2 emission. On the other hand, LPG can prospectively substitute gasoline since it has lower emission factor. Carbon dioxide is also generated during waste bacterial decomposition process together with methane gas (CH4) at certain level of yield. Methane is a more dangerous gas compared to CO2 in its greenhouse effect. Suprihatin (2006) states that every ton of garbage that accumulates in temporary dumping site will produce 0.25 m3 methane, where the methane mass is 0.5447 g / L. The equivalence value of methane to CO2 is 24.5 t CH4 / t CO2, then every ton of waste with landfill process will produce 0.16 tons of CO2. Figure 4 shows the flow of anthropogenic CO2 emission calculation of Bogor City where each variable contributes to CO2 emissions of Bogor City.
Figure 3. Population, and kerosene and LPG consumption
Figure 4. Calculation step of CO2 emission 15
Journal of Environment and Earth Science ISSN 2224-3216 (Paper) ISSN 2225-0948 (Online) Vol.7, No.10, 2017
www.iiste.org
2.3. CO2 Sink CO2 gas sink is the amount of CO2 absorbed by several types of vegetation cover that exist on Bogor City every year. The amount of CO2 absorbed can be calculated through the size of landcover based on the type of vegetation (urban forest, plantation, grass, and bush) and their capacity to sink CO2. The CO2 sink capacity is the amount of CO2 absorbed (ton) per area of landcover (ha) per unit time (hour/year). The amount of CO2 absorbed is multiplication of the area of landcover type by the CO2 sink capacity of each landcover. Figure 5 shows that each type of landcover plays a role in CO2 gas absorption forms together carrying capacity of green open space of Bogor City.
Figure 5. Flow of CO2 sink capacity calculation 2.4. Green Open Space Suryadi et al. (2008) indicated that there had been a phenomenon of land use change in Bogor City in 1972, 1983, 1990, 2000, 2005, until 2012. Data of landcover type changes are presented in Table 2. In the table it is shown that there is a negative growth of the type landcover of forests, mixed gardens, open land, and rice fields. While there is positive growth of bush and settlements. Growth of bushes is possible temporarily as a result of the land transfer process from existing to other types of landcover. Table 2. Landcover changes of Bogor City 2001 – 2005 and 2012 Mixed Open Rice Year Forest Settlement Bush Garden Space Field 2001 448.72 4302.28 4574.07 457.34 790.75 933.68 2002 356.44 4266.55 4697.14 403.69 811.51 925.17 2003 264.16 4230.83 4820.21 350.03 832.26 916.65 2004 171.88 4195.10 4943.28 296.38 853.01 908.13 2005 187.15 4250.87 5068.25 258.02 866.28 902.05 20121 129.71 2591.02 5340.40 330.13 383,55 1.818,66 Source: Suryadi et al. (2008); 1Bappeda Bogor City (2012) 2.5. Temperature Humidity Index Temperature Humidity Index (THI) is a value represents the level of air comfort in a city. It is calculated based on temperature and humidity data. Factors that cause an increase in urban air temperature are the phenomenon of Urban Heat Island/Temperature (UHT). In the phenomenon of the " hot islands " is caused by the concentrated population of a particular area that is coupled by industry, trade, and dense urban transport. Gray and Deneke (1978) stated that sunlight reaches surface of the earth through process of reflection, transmission, and absorbs. Hot islands are commonly found in the non-vegetated areas of the city where the factors synergised each other increasing air temperatures. So, the variables that affect the increase in the air temperature is being influenced by several other variables such as the amount of CO2 emissions, built areas and green open space. Table 3 are baseline data to calculate THI for next coming years.
16
Journal of Environment and Earth Science ISSN 2224-3216 (Paper) ISSN 2225-0948 (Online) Vol.7, No.10, 2017
www.iiste.org
Table 3. Baseline Data of Temperature Humidity Index of Bogor City Year Air Temperature (0C)a Humidity (%)a THI (0C)b 2000 25.6 0.84 20.52 2001 25.5 0.85 20.44 2002 25.7 0.84 20.60 2003 25.8 0.83 20.68 2005 25.8 0.84 20.68 2005 25.8 0.87 20.68 Source: aStasiun BMG Kota Bogor (2006) b Calculated according to Nieuwolt (1975) 3. Method 3.1. Material and Equipment This study used secondary data in the form of Bogor City administrative map and emission factors of kerosene, gasoline, diesel oil and LPG obtained from literature study. Data consumption of kerosene, petrol and diesel for Bogor City were obtained from Downstream Product Management of Oil and Gas (BPH Migas). Data on population, household consumption of LPG, and the number of vehicles for Bogor City was taken from Central Bureau of Statistics (BPS). Data on landcover were obtained from literature study. The tool used was a set of computer and its software to process data. The software used to process obtained data was Powersim Studio 2005, Minitab 14, and Microsoft Excel. 3.2. Estimation of Carbon Dioxide Absorption Value Carbon dioxide absorption analysis is useful to get information about green open space capacity to absorb carbon dioxide for each sub-district in Bogor City. The approach to calculate carbon dioxide absorption was based on determined areas of landcover of vegetated areas. Landcover information was obtained from secondary data. The area and distribution of green open space obtained then used to calculate vegetation ability to absorb carbon dioxide. Table 4 presents the value of carbon dioxide absorption for each type of vegetation. Table 4. Carbondioxides absorption rate by vegetated land Absorption Vegetation Type C (ton/ha) CO2 (ton/ha) Forest 15.9 58.2576 Plantation 14.3 52.3952 Bush 0.9 3.2976 Grass 0.9 3.2976 Source: Iverson (1993) Thus, the CO2 uptake value by Green Open Space based on vegetation type is explained by the following formula: Total Emission CO2 absorb = ∑ Notes: Total CO2 emission absorp: Amount of absorbed CO2 emission by city vegetated area Land are a : Total vegetated land that capable to absorp CO2 CO2 aborption : Value of CO2 absorbed by vegetation type 3.3. Temperature Humidity Index The convenience index is based on the THI value which accommodates air temperature and relative humidity using the following equation (Nieuwolt, 1975): THI = 0.8 Ta + !"" where Ta : air temperature (0C) RH : air relative humidity (%) Rushayati (2012) used this equation for her research in Bandung Regency (West Java, Indonesia), and concluded that THI of 21 - 240C all populations felt comfortable. While THI of 25 - 270C only 50% of population declared convenient, and THI> 270C all populations felt uncomfortable. Therefore, the model simulation was stopped when the value exceeds 270C. 3.4. Dynamic System Design Dynamic system modeling in this study refers to Sterman (2000), and Menestch and Park (1977). The modeling
17
Journal of Environment and Earth Science ISSN 2224-3216 (Paper) ISSN 2225-0948 (Online) Vol.7, No.10, 2017
www.iiste.org
flow is divided into two parts, development of conceptual and technical aspects. The conceptual part is the system development based on the variables chosen and built to explain the system. Menestch and Park (1977) provide the stages of the system approach (Figure 6). Need analysis is the first stage of the system assessment mainly to identify the needs of each stakeholder (Hartisari, 2007). Each actor has different needs and requirements that may affect the system performance. The need identification would have different and contradiction between actors. This causes difficulty to meet the systems' objectives. If the system met certain actor’s needs only, then the other parties involved in the system will not function as expected and degrade the system performance or does not work at all. This stage is to understand the mechanisms that occur in the system. This is to relate needs statement and problem statement to be solved to meet the goals (Hartisari, 2007). The simple approach to describe the system is by drawing the mind map of the system. Mind map drawing is done using CLD (Causal Loops Diagram) and SFD (Stock and Flow Diagrams). Need analysis, problem formulation and system identification are to develop dynamic system concept to be modeled. The next stage is a technical step in making dynamic system modeling. Modeling process is a creative process, not linear, but must comply with scientific discipline, logical thinking and iterative in nature (Hartisari, 2007). According to Sterman (2000), the stages in constructing a model include: problems articulation, hypotheses formulation, model formulation, and testing and analysing the model.
Figure 6. Flow of system approach The most important stage of modeling is the problems articulation. A useful model is that reviews the problem specifically and simplify them and not redraw the system in detail (Sterman, 2000). A good model suits the purpose of modeling that represents the problem of the system, and not modeling the whole system. Therefore, it is necessary to review the variables that are important to be involved and drop the variables that are not inconsistent with the purpose of modeling. Model verification is the proof that the constructed computer model is able to simulate the abstracted system being studied (Eriyatno, 2003) so that verification can be interpreted as a process to make sure that the computer program created and its application is correct. It is to test the extent to which the computer program created has shown the behavior and response according to the purpose of the model. Validation is a step to make sure that the model have a nature of represented real-world. The most obvious approach to a validation is to compare the model output with the real system. According to Eriyatno (1999 ), verification model is the stage of proof the computer prepared model in the previous stage is able to simulate the abstracted model being studied. The general purpose of validation are to proof a model representativeness of actual behavior as closely as possible to substitute the real system. In addition, validation aims to increase the model credibility so that it can be used for decision making. Mathematical validation is done by calculating the MAPE (Mean Absolute Percentage Error) value in which the deviation percentage of the allowable error value between 5 - 10% , as defined by the following equation (Makridakis, 1991).
18
Journal of Environment and Earth Science ISSN 2224-3216 (Paper) ISSN 2225-0948 (Online) Vol.7, No.10, 2017
www.iiste.org
1 # $% & ( | ,-
*+
| . 100 %
Where: n is number of observationa data, Xt = actual data, and Ft = simulated data 3.5. Model Design Causal Loops Diagram (CLD) CLD is also called the causal causation diagram describing the relationship between one with other elements in the form of one-way and two-way relationship. In the emission estimation model, there is a one-way relationship between the elements that make up a CLD model. CLD forming elements starts from the need for transportation means that will certainly cause the need for fuel and has implication on the generation of emissions. Increased fuel consumption in the form of gasoline and diesel oil is determined by the demand for such fuel which is influenced by the increasing number of vehicles. Increased consumption of gasoline and diesel fuel will certainly have an impact on the CO2 emissions. The Causal Loops diagram for Bogor City emissions is presented in Figure 7.
Figure 7. Causal loop diagram of CO2 emission in Bogor City Stock and Flow Diagram (SFD) An SFD model is the translation result of the CLD model using Powersim software. The relationship between the elements contained in the SFD model will be transformed into a simple mathematical operation in the form of multiplication and incremental relationships. Figure 7 shows estimated Causal Loops for Bogor City emissions. Figure 8 shows the SFD model of THI values of Bogor City. 4. Simulation and Scenario Test 4.1. Verification Verification aims to check the consistency of both relationships between variables (links), variables itself, and simulation to see whether the model has followed system behavior in the real world. Relationships between variables marked with a '#' sign on the link, while the model consistency in the variable marked by the '?'. The estimation model of CO2 and THI emission of Bogor City do not have any inconsistency. Furthermore, the model was tested for a simulation to check whether it has followed real world behavior or not. It is proven that the model showed a pattern of linear behavior with exponential generation behavior of emission. This indicated that the model has fulfilled the verification stage procedure referring to Schlesinger et al. (1979) in Rohmatulloh (2007).
19
Journal of Environment and Earth Science ISSN 2224-3216 (Paper) ISSN 2225-0948 (Online) Vol.7, No.10, 2017
www.iiste.org
Figure 8. Stock Flow Diagram of THI values Estimation Model of Bogor City 4.2. Validation The theoretical validation results showed that the designed model was good and represented the real world system. This means that the designed variables have followed the results of the previous study and reinforced with the results of unit consistency analysis on Powersim software. Consistency of output was checked by calculating the average percent error (APE). THI validation resulted the MAPE (Mean Average Percentage Error) values of 0.5% . This indicated that the simulated error rate is within permitted intervals of simulation result and it represents the real-world system correctly. Muhammadi et al. (2001) used errors below 10% as the standard model represents the real world. Therefore, the model is good enough to represent the real world system, consistent and statistically valid based on its behavior (Table 5).
20
Journal of Environment and Earth Science ISSN 2224-3216 (Paper) ISSN 2225-0948 (Online) Vol.7, No.10, 2017
www.iiste.org
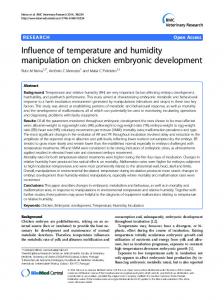
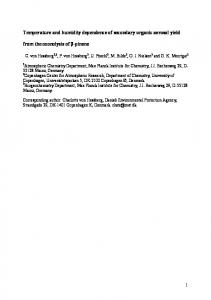
Table 5. Temperature Humidity Index validation results Temperature Humidity Index Tahun APE (%) Simulated Actual 2001 24.73 24.70 0.12131 2002 24.87 24.89 0.080418 2003 24.92 25.06 0.561798 2004 24.97 25.2 0.921105 2005 25.13 25.33 0.795862 2006 25.6 25.45 0.585938 2007 25.42 25.53 0.43273 2008 25.61 25.61 0 2009 25.82 25.68 0.542215 2010 26.05 25.76 1.113244 0.515462 MAPE Notes: APE = Average Percent Error; MAPE = Means Average Percent Error 4.3. Model Sensitivity Test Sensitivity analysis is needed to find out how the model responds to a change in assumptions. Based on this test, it was found that changed into variables in the model changed the final conclusion of the model. Sensitivity analysis was done by changing the rate of increasing number of motor vehicles, population growth, and growth rate of green space that resulted in changes in the THI value. Sensitivity tests results of each of these variables showed a change in model performance when given a stimulus. This showed that the model is sensitive to any change of assumption (Muhammadi et al. 2001). Sensitivity test results showed that an increase in the number of motor vehicles, an increase in built environment, and a decrease in green space caused an increase in air temperature that implies the increase in THI value. This showed the theoretical resemblance to behavior and structure of the model that indicated the model was good. 4.4. Analysis of Basic Behavior Basic behavior scenario analysis describes the current real conditions in Bogor City with the value of each variable on the model based on existing condition without any changes. The result of simulation of THI values presented in Figure 9 that shows THI values will be higher than 27oC in year 2031 that passes a comfortable category. According to Rushayati (2012) at that condition, 100% of population of Bogor City feel uncomfortable with air temperature and humidity which was 24.73oC in 2001 as is a medium category with 50% of population still feel comfortable. In the case of land development, if not handled, in 2050 the amount of built land will be 7,401.05 ha, whereas urban forest area will survive at 183 ha or not experienced conversion because it is a protected conservation area, Bogor Botanical Gardens and Cimanggu Research Forest. The area of rice fields will remain 630.86 ha, while the area of bushes and grass will remain 569.75 ha. The mixed garden has the highest rate of decline and will be 3,014.30 ha. The result of simulation of Bogor City's basic landcover behavior model is presented in Figure 10. 28
C
THI
27
26
25 Jan 01, 2001
Jan 01, 2011
Jan 01, 2021
Jan 01, 2031
Jan 01, 2041
Figure 9. Basic Behavior Model of Bogor City THI 2001 – 2050
21
Non-commercial use only!
Journal of Environment and Earth Science ISSN 2224-3216 (Paper) ISSN 2225-0948 (Online) Vol.7, No.10, 2017
www.iiste.org
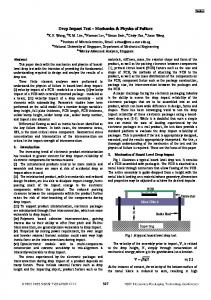
Figure 10. Basic behavior model of Green Open Space Bogor City 2001 – 2050 4.5. Scenario Model One way to develop Bogor as a green city to sustain anthropogenic activities of its population that causes Urban Heat Island is to cut the rate of population growth, the increase in motor vehicles, as well as the rate of built land by increasing urban forests as a climate support. Green scenario consists of handling factors affecting the increase in THI Bogor City due to the phenomenon of Urban Heat Island. The influencing factors are changed according to the possibility of being aggressively biased. Some of the changes made between factors, among others, are of wetland area decrease, growth rate of motorcycles, growth rate of private cars, rate of population growth, and rate of decline in the area of mixed gardens. In the green scenario, growth rates of the rice field and mixed gardens will be reduced from 0.8% to 0.4% per year and from 0.7% to 0.4% per year respectively. In addition to restraining the rate of conversion to green land, there would be reforestation of 100 ha/year. The growth rate of motorcycles and private cars that become the largest source of anthropogenic emissions in transportation equipment would be reduced to 15% from 23.5% per year and 10% from 20.8% per year. The rate of population growth would be reduced to 2% from the beginning of 2.8% per year. This is because the population is one of the main emission sources where the resulting emissions are the result of household activities including the use of LPG and kerosene as well as the MSW (Municipal Solid Waste) burning or decomposition. The result of simulation as presented in Figure 11 shows that with green scenarios, THI increase can be controlled. This scenario indicates that THI condition higher than 270C will be happening to year 2048 is longer than of the behavior scenario that would occur to 2031.
Gambar 11. THI of green scenario model Bogor City 2001 – 2060 Figure 12 shows the slope change in landcover growth of Bogor City where the assumptions of annual increase have been changed. When compared to the basic behavior, the most obvious dynamics occur to the 22
Journal of Environment and Earth Science ISSN 2224-3216 (Paper) ISSN 2225-0948 (Online) Vol.7, No.10, 2017
www.iiste.org
increase in the area of forest, bush and grasses. This is because the reforestation program of 100 hectares per year applied to landcover in the form of bush and grass, so that the simulation results show a significant increase in forest areas and the decrease of the bush and grass. In the year 2048 where the value of THI> 270C indicates that the land area is 6,453.11 ha and total green open space 5,346.98 ha.
Figure 12. Lancover change of green scenario model of Bogor City 2001-2060 The moderate scenario illustrates a rather loose policy alternative to urban climate management due to UHT. This scenario shows change the rate of wetland conversion decreased to 0.6% per year, mixed gardens to 0.6% per year, the growth rate of motorcycles to 20% per year, the private car growth rate to 15% per year and the green open space growth rate to 50 ha per year. The simulation result of THI values are presented in Figure 13 which shows the temperature and humidity of Bogor City will be uncomfortable (THI> 27oC) in 2039, slower than those of the basic behavior that would occur in 2031.
Figure 13. THI of moderate scenario of Bogor City 2001 – 2060 Figure 14 shows the simulated landcover changes in the moderate scenario. There is only a little different from the green scenario, the most obvious changes occur to the growth of the city, the bush and grasses. This is because the greening policy of 50 ha per year on the landcover is a bush and grass. In 2031, it will end with built land areas of 6,337.62 ha and total green open space of 5,462.47 ha.
23
Journal of Environment and Earth Science ISSN 2224-3216 (Paper) ISSN 2225-0948 (Online) Vol.7, No.10, 2017
www.iiste.org
Figure 14. Landcover change of moderat scenario of Bogor City 2001-2060 Pessimistic scenario is a scenario of choice where there is no environmental management at all so that some of the variables determining conclusions of the model continue to increase. The rate of wetland areas decreased is assumed to be 1% per year, the number of motorcycles increased by 27% per year, the increase of private car rate 26% per year, the population growth increase to 3% per year, and no reforestation activities. Figure 15 shows the result of THI values of pessimistic scenarios. This scenario shows accelerate increase in the air temperature and humidity of Bogor city so that in 2028 THI will be bigger than 270C.
Figure 15. THI of pesimistic scenario of Bogor City 2001 – 2060 In the pessimistic scenario where variable assumption changes are contradictory to the assumptions of green and moderate scenarios, there is an increase in the value of factors that cause the THI value increase because it is assumed that there is no effort to control those factors. The pattern of landcover change is not much different from the basic behavioral pattern but there is a more significant increase in the built land area and the decrease in mixed gardens. Figure 16 shows landcover simulation results that in 2028 the built land is 6,703.5 ha and the green open space is 5,096.59 ha. Basically, the real difference in the three types of scenarios is the area of urban forest. In the pessimistic scenario, there is no reforestation of urban forest so that although the area of green land is not much different, the area of urban forest as a type of landcover that has a large climate amelioration ability is very small. 5. Policy Implication Based on simulation result of the scenarios model, it is found that green scenario is the best alternative to handle the climate problem of Bogor City. The green scenario has included variables based on green growth which is the concept of WWF and PWC (2011). Development of green growth is implemented by seeking the balance 24
Journal of Environment and Earth Science ISSN 2224-3216 (Paper) ISSN 2225-0948 (Online) Vol.7, No.10, 2017
www.iiste.org
between economic, social, culture, and environment. The concept of green growth considers the following five key pillars: economic growth, improved social conditions, biodiversity conservation and environmental services, adaptability to global climate change, and reduced greenhouse gas emissions. According to the results of the scenario, the land use plan (RTRW) of Bogor City in 2003 with settlement area of 8,300 ha can not support climate change as a result of anthropogenic activities in urban areas. There are several ways to overcome degradation of air quality and city climate, including inventory and mitigation. Inventories are conducted to determine the sources of greenhouse gas emissions along with the resulting emissions. Mitigation is done to obtain a certain emission level by replacing existing technology with newer technology. Greenhouse gases mitigation technologies are grouped into two categories: supply side and demand-side. The supply side is done by using a more efficient conversion system as well as converting fuel to lower emissions fuel by increasing the use of renewable energy. The demand side is done using a management that is to use more efficient equipment (Sugiyono, 2006).
Figure16. Landcover change of pesimistic scenario of Bogor City 2001-2040 Sugiyono (2006) described several mitigation options that can be done in various sectors of energy use. Some options that can be done to mitigate climate degradation of Bogor City, among others are (i) enacting the conversion to biofuels such as biodiesel and bio-ethanol in transportation system, and (ii) apply intermodal shift or replacing the transportation with mass transportation system by using more than one mode of transportation to achieve a goal. Sugiyono (2011) in his research on the low-carbon transport development concluded that by increasing the growth of mass transportation modes in Jakarta City for every bus that replaces 4 units of car and bus growth is increased from 0.4% per year to 5% per year can reduce CO2 emission up 33% in the next 20 years. Nowak (2000) mentioned that the role of urban green open space to urban air quality is due to some anthropogenic emissions or ozone formation depending on air temperature. Trees in urban forests play a role in absorbing pollutants entering ambient air through a transpiration process in addition to its role in dealing with particulate dust. Indirectly, green open space can cut the impact on energy uses from built land related to its role in lowering the temperature and as a barrier of solar radiation through the canopy. Therefore, the use of green open space can be a cost benefit because it has a role to conserve energy and emissions amelioration resulting from anthropogenic activities. Brack (2002) explained that the conservation of energy gained from the use of green space is due to the reduced energy used for air conditioning during the summer. Reduce energy used for air conditioning, of course, results of reduced emissions generated from energy sources used for refrigerators that indirectly offer cost saving benefits. Table 6 shows the cost benefits provided by green space due to energy conservation, pollution, and hydrology per year. Table 7 shows the cost benefit obtained from each scenario of the mitigation framework of climate degradation of Bogor City. The assumption used in the cost benefit is the use of urban forest only. This is because urban forests have significant influence on lowering the air temperature associated with the ability to block incoming sunlight, to store water, and to absorb high pollution. The value of the cost benefit of city forest per year is obtained by multiplying the average area of urban forest with the minimum cost benefit.
25
Journal of Environment and Earth Science ISSN 2224-3216 (Paper) ISSN 2225-0948 (Online) Vol.7, No.10, 2017
www.iiste.org
Tabel 6. Cost Benefit of urban forest impact (Rp/m2) Energy Pollution Acoording to: Study Area Rp/m2/year Rp/m2/year McPherson (1992) Tuscon 5,452.2 1,093.5 McPherson (1994b) Chicago 6,206.4 McPherson(1994a) Chicago 11,861.1 805.5 McPherson et al. (1998) Sacramento 664.2 Scott et al. (1998) Sacramento 1,358.1 McPherson et al (1999a) Modesto 1,501.2 2,163.6 McPherson et al. (1999b) San Joaquin 999 2,783.7 Rata-rata 5,203.8 1,477.8 Source: Brack (2002); 1 USD was about 10,000 rupiah at the time of study conducted.
Scenario Green Scenario Moderat Scenario Pesimistic Scenario Benefit /year
Hidrology Rp/m2/year 1,566 924.3 464.4 984.6
Table 7. Benefit of each scenario of climate control policy of Bogor City Urban Pollution Hydrologic Saved Energy Forest Amelioration Amelioration (Rp/year) (Rp/year) (Rp/year) (ha/year) 1,039.00 10,037,961,000 6,901,038,000 4,825,116,000 938.90 9,379,611,000 6,236,173,800 4,360,251,600 197.9
1,977,021,000
1,314,451,800
919,047,600
21,394,593,000
14,451,663,600
10,104,415,200
6. Conclusion and Recommendation 6.1. Conclusion Basic behavior simulation shows that Bogor City still has an ideal temperature and humidity of air until 2031 during which the value of THI