Evaluating Machine Learning for Improving Power Grid Reliability
Leon Wu
[email protected] Gail Kaiser
[email protected] Department of Computer Science, Columbia University, 1214 Amsterdam Avenue, New York, NY 10027 Cynthia Rudin
[email protected] MIT Sloan School of Management, Massachusetts Institute of Technology, Cambridge, MA 02142 David Waltz
[email protected] Roger Anderson
[email protected] Albert Boulanger
[email protected] Ansaf Salleb-Aouissi
[email protected] Haimonti Dutta
[email protected] Manoj Pooleery
[email protected] Center for Computational Learning Systems, Columbia University, 475 Riverside Drive, New York, NY 10115
Abstract Ensuring reliability as the electrical grid morphs into the “smart grid” will require innovations in how we assess the state of the grid, for the purpose of proactive maintenance, rather than reactive maintenance – in the future, we will not only react to failures, but also try to anticipate and avoid them using predictive modeling (machine learning) techniques. To help in meeting this challenge, we present the Neutral Online Visualization-aided Autonomic evaluation framework (NOVA) for evaluating machine learning algorithms for preventive maintenance on the electrical grid. NOVA has three stages provided through a unified user interface: evaluation of input data quality, evaluation of machine learning results, and evaluation of the reliability improvement of the power grid. A prototype version of NOVA has been deployed for the power grid in New York City, and it is able to evaluate machine learning systems effectively and efficiently.
Appearing in the ICML 2011 Workshop on Machine Learning for Global Challenges, Bellevue, WA, USA, 2011. Copyright 2011 by the author(s)/owner(s).
1. Introduction A sustainable energy future depends on an efficient, reliable and intelligent electricity distribution and transmission system, i.e., power grid. The smart grid has been defined as an automated electric power system that monitors and controls grid activities, ensuring the two-way flow of electricity and information between power plants and consumers—and all points in between (Force, 2010). Without the smart grid, many emerging clean energy technologies such as electric vehicles and solar, wind or cogeneration power cannot be adopted on a large scale (Anderson, 2004). The smart grid of the future will have to operate efficiently to satisfy the increasing capacity demand, and should use the current legacy grid as much as possible to keep costs lower. This leads to a critical challenge of ensuring power grid reliability. In fact, the power grid has become less reliable and more outage-prone in the past years. According to two data sets, one from the U.S. Department of Energy and the other one from the North American Electric Reliability Corp., the number of power outages greater than 100 Megawatts or affecting more than 50,000 customers in the U.S. almost doubled every five years in the past fifteen years, resulting in about $49 billion outage costs per year (Amin, 2011). A smart grid should anticipate and respond to system disturbances (self heal), focusing on prevention, and minimizing impacts on consumers. To tackle this power grid reliability challenge, we have collaborated with the Consolidated Edison of New York, the main power utility provider of New York
Evaluating Machine Learning for Improving Power Grid Reliability
City, and developed several machine learning systems to rank some types of electrical components by their susceptibility to impending failure. The rankings can then be used for planning of fieldwork aimed at preventive maintenance, where the components should be proactively inspected and/or repaired in order of their estimated susceptibility to failure (Rudin et al., 2011; 2010; Gross et al., 2009). One important aspect in this collaborative research is that researchers and sponsors require objective evaluation of the machine learning model, the quality of the data input and output, and the consequential benefits, i.e., physical system improvements, after the actions recommended by the machine learning have been taken. For this purpose, we have developed a comprehensive multi-stage online evaluation framework named NOVA (Neutral Online Visualization-aided Autonomic evaluation framework) that is able to provide such an evaluation objectively, effectively, and efficiently. We implemented NOVA in evaluating two complex online machine learning ranking systems for distribution feeders in New York City and analyzed the experimental results. In the following section, we present preliminary information on the systems being evaluated. Then we describe the NOVA framework, followed by experimental results, analysis, and discussion. There is a large body of literature addressing machine learning algorithms for various domains, but little work describing how these algorithms should be evaluated in large complex systems; NOVA attempts to address this gap in the literature by providing an outline of how one might do this for the power grid. It can also be applied in other fields that have similar requirements.
port Vector Machines (SVM ), RankBoost, Martingale Boosting and an ensemble-based wrapper. The ODDS ranking system uses ranked lists obtained from a linear SVM.
3. Evaluation Framework NOVA conducts an automated and integrated evaluation at multiple stages along the workflow of the online machine learning system. There are three steps provided through a unified user interface, as illustrated in Figure 1: first, evaluation of the input data; second, evaluation of the machine learning output; third, evaluation of the system’s performance improvement. The results from Step 1, 2 and 3 are eventually directed to a centralized software dashboard (a visualization-aided user interface). When abnormal results trigger predefined thresholds at any step, warning messages are dispatched automatically. We have implemented the NOVA evaluation framework for use on the New York City power grid, to conduct some comparative empirical studies on MartaRank and ODDS feeder ranking systems. In the following subsections, we will describe the details of each evaluation stage and demonstrate useful summarization charts for each step.
User Interface Visualization Alert
Data Collection From Power Grid
1 Data Preparation
Evaluation
Machine Learning
2. Background One of the main causes of power grid failure is electrical component failure. These component failures may lead to cascading failures, as in the 2003 U.S. Northeast blackout, caused by some strained high-voltage power lines in Ohio (Force, 2003). To ensure the power grid is running smoothly, the electrical components that are most susceptible to failure should be proactively taken offline for maintenance or replacement. Primary distribution feeders (called simply “feeders” here) are large cables that distribute power from substations to the secondary grid. In New York City, feeders are among the most failure-prone electrical components. MartaRank (Becker & Arias, 2007; Long & Servedio, 2005) and ODDS (Gross et al., 2009) are two online machine learning-based feeder ranking systems for preventive maintenance. MartaRank employs Sup-
2 Output Results
Evaluation
Recommended Actions Taken on Power Grid
Data Collection From Power Grid
3 Evaluation
Figure 1. NOVA system design and workflow.
3.1. Step 1: Evaluation of Input Data Quality In order for a machine learning system to perform as expected, the input data sets have to meet the predefined quality specifications. The evaluation process
Evaluating Machine Learning for Improving Power Grid Reliability
first uses data constraints and checks to see whether the required data exist and are up to date. Then the evaluation process conducts some more fine-grained checks, for example by using a sparkline graph, which is a type of information graphic characterized by its small size and high data density (Tufte, 2006). These checks would help researchers to correlate the changes in the input data sets with the variations of machine learning results, so that further study may be done to improve machine learning accuracy. As illustrated in Figure 2, for the one-day period preceeding an actual outage, among ten feeder attributes—maximum scaled voltage, number of joints, number of cables, and peak load, etc.— being plotted, attribute 5 shows a big drop and subsequent climb in the sparkline time series graph. This kind of information can be important for feature derivation and selection.
Figure 2. Sparkline graph for attributes data.
3.2. Step 2: Evaluation of Machine Learning Results In evaluating a ranked list of components ordered by potential vulnerability, we use Receiver Operator Characteristic (ROC ) curves, and accompanying rank statistics such as the Area Under the Curve (AUC ). The ranking systems generate new models continuously, so the evaluation is presented as a time series of AUC values as shown in Figure 3. The black series in the figure shows the AUC time series of ODDS and the gray series shows the ones for MartaRank, both for the time period from May 2010 to November 2010. Our experiments show that MartaRank and ODDS feeder ranking systems have comparable overall performance according to the AUC.
an understanding of the mechanism behind the cyclicity challenge will lead to performance improvements for the system.
Figure 3. AUC cyclicity graph.
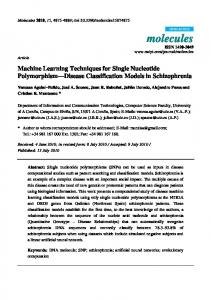
3.3. Step 3: Evaluation of the Reliability Improvement of the Power Grid After the machine learning outputs ranking results, the feeders ranked with highest susceptibility to failure are usually treated with a higher priority. The final stage of the evaluation is to validate that the recommended actions are in fact leading to the expected power system improvement, i.e., fewer outages and longer time between failures. For a longer time, a log(cumulative outages) versus log(time) chart is useful for seeing the changes in the time interval between failures. This graphical analysis is also called a Duane plot, which is a log-log plot of the cumulative number of failures versus time (Gaudoin et al., 2003), shown in Figure 4. The changing slope of the regression lines of the cumulative outages shows the improved rate of outages. If the failure rate had not changed, this loglog plot would show a straight line.
Figure 4. Cumulative outages versus time log-log chart.
3.2.1. AUC Cyclicity Challenge One perplexing phenomenon we identified is the AUC cyclicity that appears in both feeder ranking systems as shown in Figure 3. Although the two AUC time series’ vary differently, they both possess an inherent cyclical pattern, which we dubbed the AUC cyclicity challenge. It is an open problem to determine what causes this phenomenon. We hypothesize that
One experimental result we concluded from the evaluation using NOVA is the increasing MTBF (Mean Time Between Failures), i.e., lower failure rate and better system reliability, for most networks. Figure 5 illustrates MTBF time series for all the feeders in a specific network for the period from 2002 to 2009 and the linear regression. On average, the MTBF for feeders in this network are improving over time.
Evaluating Machine Learning for Improving Power Grid Reliability
Anderson, Roger N. Building the energy internet. Economist, March 11th 2004. Becker, Hila and Arias, Marta. Real-time ranking with concept drift using expert advice. In Proceedings of the 13th ACM SIGKDD International Conference on Knowledge Discovery and Data Mining (KDD), pp. 86–94, New York, NY, USA, 2007. ACM.
Figure 5. MTBF versus time and linear regression.
4. Discussion We have given examples above of each of the three steps of evaluation, using NYC power grid data. Depending on specific data and operational goals, there may be many ways to perform one of the three evaluations; the key point is that all of these three types of evaluation must be present. In machine learning, only the second type of evaluation is typically considered (step 2), and even that evaluation is mainly considered in static settings (without the element of time). Langley’s seminal paper “Machine Learning as an Experimental Science” made empirical study an indispensable aspect of machine learning research (Langley, 1988). Since that time, many challenges in experimental machine learning have been identified. For instance, a more recent survey of Japkowicz reviewed shortcomings in current evaluation methods (Japkowicz, 2006). Through using NOVA on the New York City power grid, we have also been able to identify new challenges (e.g., the AUC cyclicity challenge). In machine learning, the goal is often to optimize the criteria used for evaluation. NOVA suggests a much more ambitious set of evaluations than what are usually performed in machine learning experiments, potentially leading to a much broader way to consider and design machine learning systems, and hopefully leading to improvements in power grid operations.
Force, Federal Smart Grid Task. Smart grid basics, 2010. URL http://www.smartgrid.gov/basics. Force, U.S.-Canada Power System Outage Task. Interim report: Causes of the august 14th blackout in the united states and canada, 2003. Gaudoin, Oliver, Yang, Bo, and Xie, Min. A simple goodness-of-fit test for the power-law process, based on the duane plot. IEEE Transactions on Reliability, 52(1):69–74, March 2003. Gross, Phil, Salleb-Aouissi, Ansaf, Dutta, Haimonti, and Boulanger, Albert. Ranking electrical feeders of the new york power grid. In Proceedings of the International Conference on Machine Learning and Applications (ICMLA), pp. 725–730, 2009. Japkowicz, Nathalie. Why question machine learning evaluation methods (an illustrative review of the shortcomings of current methods). In 2006 AAAI Workshop Evaluation Method for Machine Learning. AAAI, 2006. Langley, Pat. Machine learning as an experimental science. Machine Learning, 3(1):5–8, 1988. Long, Philip M. and Servedio, Rocco A. Martingale boosting. In Eighteenth Annual Conference on Computational Learning Theory (COLT), pp. 79– 94, 2005. Rudin, Cynthia, Passonneau, Rebecca J., Radeva, Axinia, Dutta, Haimonti, Ierome, Steve, and Isaac, Delfina. A process for predicting manhole events in manhattan. Machine Learning, 80(1):1–31, 2010.
5. Conclusion
References
Rudin, Cynthia, Waltz, David, Anderson, Roger N., Boulanger, Albert, Salleb-Aouissi, Ansaf, Chow, Maggie, Dutta, Haimonti, Gross, Philip, Huang, Bert, Ierome, Steve, Isaac, Delfine, Kressner, Arthur, Passonneau, Rebecca J., Radeva, Axinia, and Wu, Leon. Machine learning for the new york city power grid. IEEE Transactions on Pattern Analysis and Machine Intelligence, To Appear, 2011.
Amin, S. Massoud. U.s. electrical grid gets less reliable. IEEE Spectrum, pp. 80, January 2011.
Tufte, Edward. Beautiful Evidence. Graphics Press, 2006. ISBN 0961392177.
This paper presented a novel framework named NOVA for evaluating online machine learning algorithms that are operating within large complex systems, specifically, on the power grid. By using an extensive evaluation system like NOVA, we aim to make the grid more efficient, more reliable, and more sustainable.