Rinker School of Building Construction with its faculty members and staff for giving me the opportunity to ... This research has been supported and funded by the Florida Department of .... New Ultrasound and Sound Generation Methods .
EVALUATING NONDESTRUCTIVE TESTING TECHNIQUES TO DETECT VOIDS IN BONDED POST-TENSIONED DUCTS
By ELIE GEORGE ANDARY
A THESIS PRESENTED TO THE GRADUATE SCHOOL OF THE UNIVERSITY OF FLORIDA IN PARTIAL FULFILLMENT OF THE REQUIREMENTS FOR THE DEGREE OF MASTER OF SCIENCE IN BUILDING CONSTRUCTION UNIVERSITY OF FLORIDA 2003
ACKNOWLEDGMENTS I would like to express my gratitude to all those who gave me the possibility to complete this thesis. I feel a deep sense of gratitude for my parents, Asma and George, who formed part of my vision and taught me the good things that really matter in life. Their presence and prayer still provide a permanent inspiration for my journey in this life. I am grateful for my brother, Nazih, and for my sisters, Nadine and Aline, for rendering me the sense and the value of brotherhood. I am glad to be one of them. I want to thank the College of Design, Construction, and Planning, and especially the Rinker School of Building Construction with its faculty members and staff for giving me the opportunity to commence this thesis and to do the necessary research work. I am deeply indebted to my advisor Dr. R. Raymond Issa, whose help, stimulating suggestions, and encouragement helped me in accomplishing my master’s degree. I wish to express my gratitude to my committee chairman, Dr. Larry Muszynski, for reviewing the manuscript of this thesis, and being helpful with comments and answering questions. Moreover, I am very grateful for the support and experience that Dr. Abdol Chini provided and for his valuable discussions. This research has been supported and funded by the Florida Department of Transportation; sincere thanks go to the State of Florida’s engineers for their guidance, support and encouragement. I want to thank my colleagues for all their help, support, interest, and valuable hints, especially Mr. Antoine Faddoul, Mr. Uluc Bayar, Mr. Francisco Monteallegre, Mr. Mathew Harris, and Mr. Vali Tirsoaga.
ii
TABLE OF CONTENTS page ACKNOWLEDGMENTS…………………………………………………………………. ii LIST OF TABLES………………………………………………………………………….vi LIST OF FIGURES………………………………………………………………………..vii ABSTRACT…………………………………………………………………………...….…x CHAPTER 1
INTRODUCTION………………………………………………………………….. 1 Statement of Problem ................................................................................................ 1 Objective of the Study ............................................................................................... 3
2
LITERATURE REVIEW…………………………………………………………... 4 Introduction ............................................................................................................... 4 Ultrasonic Tomography Theory ................................................................................ 4 Tomographic Survey Instrumentations and Experimental Procedure....................... 5 Reflection Seismology............................................................................................... 5 Infrared Thermography ............................................................................................. 7 Titman’s General Principles ...................................................................................... 8 Spectral Analysis or Ultrasonic Signals .................................................................... 9 Ultrasonic Testing ................................................................................................... 10 New Ultrasound and Sound Generation Methods ................................................... 11 New Methods for Stress Wave Generation in Concrete.......................................... 14 Inquiring Agency NDT&E Techniques .................................................................. 16 Mechanical Wave Techniques (MWT) ................................................................... 16 Electromagnetic Microwave Techniques (EMT) .................................................... 17 Optical Techniques (OT)......................................................................................... 18 Other Techniques..................................................................................................... 19 Split Spectrum Processing....................................................................................... 20 Acoustic Tomographic Imaging of Concrete Infrastructure ................................... 22 Radar… ................................................................................................................... 27 Impact-Echo ............................................................................................................ 28 Ultrasonic Pulse Echo, A-scan ................................................................................ 28 Ultrasonic Pulse Array ............................................................................................ 29 iii
Ultrasonic Pulse Echo, B-scan ................................................................................ 29 Ultrasonic Pulse Echo, B-scan, LSAFT .................................................................. 30 Ultrasonic Pulse Echo: 2D-Synthetic Aperture and 3D-SAFT ............................... 30 EFIT Simulation ...................................................................................................... 31 3
SURVEY OF STATE DEPARTMENTS OF TRANSPORTATION……………. 34 Introduction ............................................................................................................. 34 Results of the Survey............................................................................................... 34
4
RESEARCH METHODOLOGY…………………………………………………. 39 Introduction ............................................................................................................. 39 NDT Technologies to be Evaluated ........................................................................ 40 Materials .................................................................................................................. 42 Grout…………….................................................................................................... 42 Mixing Grout ........................................................................................................... 42 Ducts….................................................................................................................... 43 Tendons ................................................................................................................... 43
5
TEST RESULTS AND DISCUSSION…………………………………………… 44 Introduction ............................................................................................................. 44 PHASE I .................................................................................................................. 44 NDT Technologies Evaluated..................................................................... 47 Phase I Results ............................................................................................ 50 PHASE II................................................................................................................. 50 Background ................................................................................................. 52 Impact Echo (IE) Method ........................................................................... 52 Spectral Analysis of Surface Waves (SASW) Method............................... 54 Ultasonic Pulse Velocity Tomographic Imaging (UPVT).......................... 59 Phase II Results........................................................................................... 60 PHASE III ............................................................................................................... 78 Research Investigation Scope ..................................................................... 78 Summary of Findings.................................................................................. 78 Background ................................................................................................. 79 Wall Specimen II ....................................................................................... 79
6
CONCLUSIONS………………………………………………………………….. 91 Results from IE Scans ............................................................................................. 91 Results from SASW tests ........................................................................................ 91 Results from Pulse Velocity UPVT......................................................................... 91 Impactechogram ...................................................................................................... 92
7
RECOMMENDATIONS…………………………………………………………. 93
iv
APPENDIX A.
SAMPLE SURVEY………………………………………………………………. 94
B.
DATA FROM STATE DEPARTMENTS OF TRANSPORTATION SURVEY... 96
C.
TECHNICAL DATA GUIDE…………………………………………………..…97
D.
MATERIAL SAFETY DATA SHEET…………………………………………..101
LIST OF REFERENCES………………………………………………………………... 105 BIOGRAPHICAL SKETCH…………………………………………………………….. 107
v
LIST OF TABLES Table
page
1-1 Summary of NDT Techniques................................................................................... 32 3-1 Range of Material Quantities for Class A, B, C, and D. ........................................... 37 3-2 Nondestructive Inspection Method............................................................................ 37 3-3 Post-tensioning Failures Experienced by DOTs........................................................ 38 5-1 IE Depth Results for Empty Ducts and Solid Concrete............................................. 68 5-2 IE Depth Results for Fully Grouted, Partially Grouted and Empty Ducts. ............... 68 5-3 UPVT Velocities in ft/ms for Fully Grouted, Partially Grouted and Empty Ducts... 77 6-1 Summary of NDT Evaluation.................................................................................... 92
vi
LIST OF FIGURES Figure
page
3-1 Results of Post-Tensioning Systems (Bonded and Unbonded) ................................. 35 3-2 Frequency of Duct Material Used in Post-Tensioning .............................................. 35 3-3 Bonded Grout Class Used.......................................................................................... 37 4-1 Research Methodology Flow Chart........................................................................... 39 5-1 Grouted Beam Samples ............................................................................................. 45 5-2 Grout Beam Samples with Defect Locations ............................................................ 45 5-3 Schematic of Defect Type and Location for Grouted 3-inch Corrugated Metal Duct Samples........................................................................................................... 46 5-4 Schematic of Defect Type and Location for Grouted 2-inch Corrugated Plastic Duct Samples........................................................................................................... 46 5-5 Scanning IE Device and Data recorder...................................................................... 48 5-6 Close-up of Scanning IE Device Relative to Specimen Size .................................... 48 5-7 Static Ultrasonic Tomography (UT) Test.................................................................. 49 5-8 UT Test in Progress ................................................................................................... 49 5-9 Reinforced Concrete Dimensions and Duct .............................................................. 51 5-10 Two Concrete Walls with Steel and Plastic Ducts .................................................. 51 5-11 Schematic of Impact Echo Method ......................................................................... 53 5-12 Freedom Data PC Acquisition System with IE Scanner ......................................... 54 5-13 The Impact Echo Scanning test ............................................................................... 54 5-14 Field Setup for SASW Test ..................................................................................... 56
vii
5-15 SASW Test on the Wall........................................................................................... 56 5-16 Tomography Test - Source and Receiver Combinations at Different Depths......... 60 5-17 Nominal Wall Thickness and its IE frequency response from IE Scanning of Solid Concrete........................................................................................................... 61 5-18 IE Thickness Results and Example Frequency Response from the Empty Steel Duct of Wall II (Duct Center Line Scan).................................................................. 62 5-19 IE Thickness Results and Example IE frequency response from the Empty Plastic Duct of Wall II (Duct Centerline Scan)......................................................... 63 5-20 IE Thickness and Frequency Results from a Steel Duct – Wall I ........................... 65 5-21 Impactechogram of the IE test Results along the Steel Duct .................................. 66 5-22 IE Thickness and Example Frequency Results from a Plastic Duct........................ 67 5-23 Schematic of compression wave penetration through the ducts.............................. 69 5-24 Schematic of compression wave penetration through partially grouted ducts. ....... 70 5-25 Impactechogram of Frequency Data from a Plastic Duct........................................ 70 5-26 IE Thickness Results from IE Scanning off the Center Line of Steel Duct ............ 71 5-27 IE Thickness Results from IE Scanning across Steel and Plastic Ducts – Fully Grouted Ducts ........................................................................................................... 72 5-28 IE Thickness Results from IE Scanning across Steel and Plastic Ducts – Partially Grouted Ducts (Debonded) ....................................................................................... 73 5-29 IE Thickness Results from IE Scanning across Steel and Plastic Ducts – Empty Ducts ......................................................................................................................... 73 5-30 Surface Wave Velocity Dispersion Curve Results from Steel Duct ....................... 74 5-31 Surface Wave Velocity dispersion Curve Results from Plastic Duct...................... 75 5-32 Velocity Tomogram Image from Fully Grouted Steel and Plastic Ducts................ 76 5-33 Velocity Tomogram Image from Partially Grouted (Debonded) Steel and Plastic Ducts ......................................................................................................................... 76 5-34 Velocity Tomogram Image from Empty Steel and Plastic Ducts ........................... 77
viii
5-35 Data Acquisition System with IE Scanning Device ................................................ 79 5-36 Reinforced Concrete Dimensions and Duct Location ............................................. 80 5-37 Concrete Walls with Steel and Plastic Ducts........................................................... 80 5-38 Calibration Scan from Sunday, 12/29/02 ................................................................ 82 5-39 Calibration Scan from Tuesday, 1/12/03................................................................. 82 5-40 Horizontal Scan from Sunday, 12/29/02 – Day 1.................................................... 83 5-41 Horizontal Scan from Tuesday, 1/21/03 – Day 24 .................................................. 84 5-42 Scan along Steel duct from Sunday, 12/29/02 – Day 1 ........................................... 85 5-43 Scan along Steel duct from Tuesday, 1/21/03 – Day 24 ......................................... 85 5-44 Scan along Plastic duct from Sunday, 12/29/02 – Day 1 ........................................ 86 5-45 Scan along Plastic duct from Tuesday, 1/21/03 – Day 24....................................... 87 5-46 Off Centerline of Steel Duct from 12/29/02 – Day 1 .............................................. 88 5-47 Off Centerline of Plastic Duct from 12/29/02 – Day 1............................................ 88 5-48 Off Centerline of Steel Duct from 1/12/02 – Day 24 .............................................. 89 5-49 Off Centerline of Plastic Duct from 1/21/03 – Day 24........................................... 90
ix
Abstract of Thesis Presented to the Graduate School of the University of Florida in Partial Fulfillment of the Requirements for the Degree of Master of Science in Building Construction EVALUATIONG NONDESTRUCTINE TESTING TECHNIQUES TO DETECT VOIDS IN BONDED POST-TENSIONED DUCTS By Elie George Andary August 2003 Chairman: Larry Muszynski Cochair: R. Raymond Issa Major Department: Rinker School of Building Construction The use of post-tensioning in bridges can provide durability and structural benefits to the system in the construction field. In bonded post-tensioned construction, Portland cement grout is used to form a sheath around the steel tensioning strand, and act as a solid impermeable barrier to prevent the ingress of chlorides from reaching the steel and initiating corrosion. Too often, voids are formed in the post-tensioning duct from incomplete grouting, trapped air pockets, or from evaporation of bleed water due to poor grout design or poor grouting procedures or both. Tendons are subjected to large tensile stress; tendon failure due to corrosion may result in the failure of the concrete member, leading to severe damage for the whole structure that might lead to a disaster. That is why those types of structures need to be adequately tested to ensure acceptable performance during their service life.
x
There are three non destructive testing (NDT) techniques that were evaluated in this research: Impact Echo (IE), Spectral Analysis of Surface Waves (SASW), and Ultrasonic Pulse Velocity Tomography (UPVT). Impact Echo has been used successfully since the end of 1980s to detect cracks or defects in concrete slabs or beams. The method has been also used to detect voids versus grouted conditions inside of bonded post-tensioned ducts where the ducts are metal. The Spectral Analysis of Surface Waves (SASW) method uses the dispersive characteristics of surface waves to determine the variation of the shear wave velocity (stiffness) of layered system with depth. The SASW method can be performed on any material provided an accessible surface is available for receiver mounting and impacting. Materials that can be tested with SASW include concrete, asphalt, soil, rock, masonry, and wood. Ultrasonic Pulse Velocity Tomography (UPVT) requires access to two sides of a structural element in order to send and receive sound waves at multiple angles above and below ducts that allow images of internal concrete and duct conditions. The tomography tests use two ultrasonic transducers, one as a source and the other as a receiver. Acoustic data are collected for many receiver and source combinations at different depths, and can produce UPV based images of a 2-D or 3-D concrete zone. The results from IE tests showed the most promise for assessing grout conditions of all three tests. The IE method was used successfully to identify internal conditions of a steel duct. For a plastic duct, it was more difficult to identify grout conditions due to partial debonding conditions between the plastic duct and concrete wall and apparent multiple resonant frequencies.
xi
CHAPTER 1 INTRODUCTION The use of post-tensioning in bridges can provide durability and structural benefits to the system while expediting the construction process. However, applying non-destructive testing on the members of the post-tensioning system is vital to the integrity of the structure because loss of post-tensioning can result in catastrophic failure. Usually chloride induced corrosion of steel in concrete is ranked as one of the most costly forms of corrosion. This type of corrosion usually affects coastal substructure elements, exposed to seawater by immersion or spray, and inland bridges may also be at risk due to the application of deicing salts. Statement of Problem Portland cement grout is often used in post-tensioned structures to provide bond between the tendon and the surrounding duct and also as corrosion protection for the tendons. Grout for bonded post-tensioning is a combination of Portland cement and water, along with any admixtures necessary to obtain required properties such as fluidity, thixotropy, and reduced permeability. The grout plays a crucial role in the corrosion protection of the system since it may be the “last line of defense” against chloride attack of the post-tensioning strands; an optimum grout combines desirable fresh properties along with good corrosion protection.
1
2 Grouts with properties such as fluidity, low permeability, and bleed resistance can provide maximum protection when combined with proper grouting procedures. Voids can be formed in the post-tensioning duct from incomplete grouting, trapped air pockets, or from the evaporation of bleed water pockets. High performance grout is of little benefit if poor grouting procedures result in large void formations, which provide no protection to the strand and no transfer of bond. Proper venting of the posttensioning duct is critical for complete grouting. The void between the tendon and the post-tensioning duct is a very complex space. For instance, a parabolic shaped duct with a tensioned tendon may have a number of small voids of varying shapes and sizes, and a very stiff grout may not fill the interstices. Bleed lenses can form a result of the separation of water from the cement. This sedimentation process is accentuated by the addition of seven-wire strands, which act as a “water-important mechanism.” The spaces within the individual twisted wires that form the strand are large enough to allow easy passage of water but not cement. Ducts with vertical rises will typically cause more bleed due to the increased pressure within the grout section of the duct exposing the tendon. Even in parabolic draped ducts, any bleed water will tend to gather near the highest intermediate points, leaving voids in the duct. Grouts containing anti-bleed admixture, or thixotropic grouts, can be bleed resistant even when used in ducts with large vertical rises. The grouts are able to retain their water even under high pressures and can eliminate significant void formation when proper grouting procedures are followed.
3 Objective of the Study The objective of the research contained in this thesis is to evaluate nondestructive testing (NDT) techniques to detect voids in bonded post-tensioned ducts. NDT techniques have been practically used for testing concrete elements, but there is a need to speedup the field test process and improve the analysis procedures of this testing. Moreover, it would be useful to identify the advantages and the disadvantages of each technique and compare the effectiveness and the accuracy of their results and outputs.
CHAPTER 2 LITERATURE REVIEW Introduction The literature review is divided into one section for each of the methods discussed. Each section addresses one of the techniques used for testing concrete. A brief definition followed by a review and a conclusion of early theories and past research on each characteristic is included in theses sections. This study illustrates a theory and an experimental procedure called the Ultrasonic tomography theory and Tomographic survey instrumentations and experimental procedure. Ultrasonic Tomography Theory The mathematical theory of Ultrasonic Tomography was established by Radon in 1917 in which it is shown that the internal characteristics of an object can be exactly reconstructed by a complete set of projections through the object. The simplest form of tomography is to measure the energy transmitted through the specimen and constructing the section. This can be performed by measuring the times-of-flight of a series of stress pulses along different paths through the specimen. “The basic concept is that the stress pulse on each projection travels through the specimen and interacts with its internal construction. Variations in the internal conditions result in different tunes-of-flight being measured. The tomographic software reconstructs the section by combining the information contained in a series of these projections,
4
5 obtained at different angles through the section. The greater the number of measurements taken, the more accurate are the results” (Martin et al. 2001). Tomographic Survey Instrumentations and Experimental Procedure Tomographic survey instrumentations and experimental procedures have been widely used to non-destructively test concrete and is robust and therefore suitable for use onsite. The data of measuring the time-of-flight of an ultrasonic pulse, along many ray paths through a section of the beam is then processed using tomographic software and the results are given as a contour plot of velocity across the section (Martin et al. 2001). In conclusion, ultrasonic tomography is a successful method of investigating posttensioned concrete beams. However, the method is time consuming and so should be used in conjunction with another testing method, such as sonic impact-echo. Moreover, array systems could be developed which would greatly reduce the testing time (Martin et al. 2001). Reflection Seismology Chang et al. (2001) described the theory of reflection seismology. The multi-sources and multi-receivers are distributed on the surface of a two-layer system to generate and pick up the ultrasonic waves, respectively. The distance between the source and receiver is known as offset, and this method requires 48 receivers for each source. The near offset is the distance from source to first receiver and far offset is the distances from source to last receiver. When source 1 is triggered, 48 receivers in spread 1 simultaneously record the reflected echoes from the interface of the two-layer system. After the source 1 shot, the source and all receivers move forward a unit distance, then source 2 is triggered and the 48 receivers in spread 2 record the reflected echoes, and so
6 forth. The middle point between source 1 and receiver 1 on the interface of the two-layer model is the common depth pointy (CDP) CDP1, and the middle point between source 1 and receiver 2 is the CDP2, and so on. The fold number is defined as the number of time histories having the same CDP and the time histories will be stacked (added) together. In this configuration, the CDP1, and CDP2 have 1-fold and CDP3 has 2-fold. The time histories having different offsets but the same CDP are sorted to a CDP gather which is a side-by-side display of time histories. The normal move out (NMO) is the time difference of the echoes reflected from the CDP between the zero offset measurement (source and receiver located at same point) and some offset measurement. Before stacking the time histories in a CDP gather, the (NMO) corrections for the time histories are required. After stacking, the new time history can be considered as the echoes recorded directly above CDP using the single-probe pulse-echo method. The section is constructed by side-by-side display of the new time histories and contains information of any cracks presented in the concrete (Chang et al. 2001). The advantages of this method are that the signals reflected from the interface will be enhanced and it is not necessary to pick the travel times or the waveform of the reflected echoes for analysis. The necessary data processing can be conducted using a personal computer and the output represents an image of the geometry of the reflecting interface (Chang et al. 2001). The ability of detecting cracks in concrete relies strongly on the capability of the sensing system, techniques, and theories of detection, and signal processing techniques for record data. The ultrasonic system and data processing techniques, demonstrate that horizontal cracks of length 3 cm, depth 6 cm deep and of length 5 cm, depth 14 cm and
7 an inclined crack with a 150 dip angle, 6 cm deep can be imaged successfully. Although not all the cracks in concrete can be detected, some of the small cracks in concrete structures can be detected by the reflection seismology method that other ultrasonic nondestructive methods would miss. However, the more weakness of the echoes reflected (or diffracted) from the crack, the more measurements from different surveying angles (offsets) are required for the stacking process on order to make a correct estimation of the crack. The quality and resolution of the signals can be improved by stacking the measurements after some necessary correction (Chang et al. 2001). Infrared Thermography According to Titman (2001), infrared thermography is a well-established tool in the armory of non-destructive testing (NDT) and monitoring techniques. It can be used to investigate a very broad range of situations where variation in surface temperature may indicate a problem in or a particular property of the material(s) below the surface. The successful application of thermography has become possible due to the development of sophisticated portable thermal imagers, specifically designed for NDT and condition monitoring. In view of its totally non-destructive and non-invasive nature, a thermographic survey may, in general, be very rapidly completed, with minimal access requirements and can therefore be very cost-effective. The 'visual' nature of the output can frequently lead to an immediate interpretation by a skilled practitioner. High winds can reduce the effectiveness of outdoor surveys due to surface temperature shear effects. Similarly, rain may lead to surface cooling, thus masking thermal effects from below the surface. Standing water on roofs must be avoided (Titman 2001).
8 Titman’s General Principles All bodies above absolute zero temperature emit electromagnetic radiation. Whilst visible light occupies a narrow spectral band (0.4-0.7 µm), thermography, as the name implies, utilizes the ability of specialized imagers to detect radiation in the “thermal” part of the infrared spectrum, typically in the 3-5 or 8-14 µm windows (Titman 2001). There are three types of conditions necessary for thermography to be useful. These are as follows: Heat (cold) Source An object at depth is hotter (or colder) than the medium in which it is embedded. The corresponding raising (or lowering) in surface temperature directly over this object may enable its location. The temperature of the object (relative to the general surrounding material), together with its depth below the surface, will have a bearing on its detectability or resolution from adjacent similar warm objects (Titman 2001). Thermal Gradient If a stable thermal gradient exists through an element of a structure and there is no significant variation in thermal conductivity of the materials within the element, (then the surface temperature over the warm face should be constant; and similarly for the cool face. Material omission, or local damage within the element, lead to variations in conductivity which are indicated by surface temperature fluctuations (Titman 2001). Induced Heating In the absence of either of the above, application of a hot (or cold) source to a surface will cause the surface to heat up (or cool down) at varying rates and to differing ultimate surface temperatures depending on the thermal resistance (Titman 2001).
9 As a conclusion, wide range of structural situations has been considered where a thermographic survey can be useful. Whether used in isolation or in combination with other techniques, thermal imaging can prove highly cost effective in view of its speed and the general lack of access requirements compared with other methods. The results, in the hands of a skilled practitioner, can be very graphic and immediate to understand (Titman 2001). Spectral Analysis or Ultrasonic Signals Halabe and Franklin (1999) describe the use of spectral analysis or ultrasonic signals in identifying areas of distress in different construction materials. Despite the success with time domain analysis for certain applications, several researchers have recognized its limitation and suggested the use of frequency domain analysis to enhance the sensitivity and reliability of ultrasonic testing. Horne and Duke have shown the need for using normalized power spectrum to analyze ultrasonic signals shat are dispersive using three case studies. Fast Fourier Transforms (FFT) has been used to characterize wave attenuation in wooden members. Some researchers have stressed the need for frequency domain analysis for crack detection. Also, power spectral density (PSD) analysis has been used to detect cracks in metal plates. Engineers emphasize the use of frequency domain analysis and employs power spectrum analysis in conjunction with time-of-flight measurements to detect flaws in structural materials. The underlying philosophy of the spectral analysis has been discussed along with the necessary measurement conditions. The methodology presented here will greatly help in identifying areas of distress in infrastructures built with various construction materials as in
10 aluminum, wooden, and composite wrapped concrete members (Halabe and Franklin 1999). Ultrasonic Testing In a study by Yeih and Huang (1998), the amplitude attenuation method in Ultrasonic Testing (UT) was used to evaluate the corrosion damage of reinforced concrete members. It is found that the amplitude attenuation method has good performance in corrosion detection for reinforced concrete members. There exists a consistent relationship between the average amplitude attenuation and the electrochemical parameters such as open circuit potential values, the instantaneous corrosion rate, and thickness loss (Yeih and Huang 1998). UT has not been used in concrete detection as commonly as it has been used in metal detection. The reason for the limited applications of UT in concrete structures is that the penetration depth required in concrete members is usually much longer than that in metal members. For full penetration of ultrasonic wave in RC members, a lower excitation frequency (e.g., 500 KHz) should be used. However, a lower excitation frequency induces longer wave length, so that a loss of resolution may occur. The UT method employs an excited transducer, usually Piezometric Transducer (PZT), to excite a mechanical wave and the mechanical wave propagates inside the object to be detected. A receiver (PZT) is mounted on the other side of the object to receive the signals of this mechanical wave. According to the wave signals, two important parameters, pulse velocity and amplitude, are frequently used to analyze the integrity of the object. The pulse velocity is calculated from dividing the total wave path length by the total flying time it required. When a flaw, like a major crack, is along the wave path, the total flying
11 time of the wave is longer due to the diffraction of wave. The amplitude attenuation is mainly due to the dispersion and dissipation of wave. In a corroded RC structure, the scattering phenomenon of wave by cracks, the dissipating oscillation due to cracks, and reduction of transmitted wave due to the change of acoustic impedance either from cracks inside the concrete or rust on the concrete-rebar interface result in additional amplitude attenuation compared to an undamaged body (Yeih and Huang 1998). In the UT method, the wave signals reflect information along the wave path. When only a spot is examined, this is called an A-scan. When spots are connected into a line, this is called a B-scan. When the lines of B-scan are combined, information on the examined surface can construct the C-scan. For a 3-D view, the D-scan can be constructed by combining information on all surfaces of the object. Concrete strength was reported to have an empirical relation with UT pulse velocity and the pulse velocity method was used to evaluate cracks in concrete. The average UT amplitude attenuation percentages have been found to have interesting relationships with electromechanical parameters in accelerated corrosion experiments. The average UT amplitude attenuation in the higher strength concrete was easier to detect because of the brittle microstructure. Due to the rebar size effect, specimens with smaller size rebars had more significant UT amplitude attenuation than those with larger size rebars in the beginning stage of corrosion process (Yeih and Huang 1998). New Ultrasound and Sound Generation Methods According to Popovics et al. (1999), transient stress waves used in new ultrasound and sound generation methods offer a powerful approach for non-destructive condition evaluation of concrete structures. However, currently used stress-wave-generating
12 techniques are limited by poor controllability and/or penetrating ability. Stress wave generation must therefore be improved so that the application of existing and new ultrasonic and sonic non-destructive testing techniques to concrete structures will be more effective. Electromagnetic and piezoelectric based stress wave sources are investigated for potential applicability with existing concrete non-destructive evaluation (NDE) techniques. A suitable stress wave source must be flexible in terms of input signal control, in order to be used with the various non-destructive stress wave techniques. The final signal source must also be effectively applicable to rough surfaces of unprepared concrete structures. In particular, the following characteristics should be considered for each potential stress wave source: (a) Frequency-content control (a frequency range of 1-50 kHz is desired) (b) Control of the magnitude of the .loading force (the source must be able to propagate signals through attenuating material with large path lengths and unprepared surfaces) (c) Wave mode generation (the ability to generate longitudinal-type and/or surface-type waves is desired) (Popovics et al. 1999). At present, two methods are commonly used for the generation of transient stress waves for testing concrete: traditionally excited piezoelectric sources and impact events. Traditional Piezoelectric Excitation Transient ultrasonic waves generated by traditional piezoelectric excitation are a result of the resonance vibration of a piezoelectric crystal, housed within a transducer unit, in direct contact with the inspected concrete structure. The crystal is driven by an electrical signal supplied by an attached pulser-receiver unit; the driving signal typically has the form of a voltage spike and the amplitude can range from 300 to 1000 V. The control of frequency content and pulse length is therefore achieved by changing the
13 piezoelectric transducer, as each transducer has a characteristic resonant frequency and bandwidth, while the electrical driving signal remains the same. This source type is designed primarily for the inspection of engineering materials other than concrete, and transducers with a relatively high frequency range of 0-25 to 10 MHz are typically utilized. The principal drawback of using traditionally excited piezoelectric transducers as stress wave sources for concrete is the inability to generate controllable and usable signals in the desired frequency range of 150 kHz which may be applied in existing NDE techniques (Popovics et al. 1999). Impact The use of mechanical impact, such as a single ball drop or hammer strike, as a source of transient stress waves for specific non-destructive tests of concrete has been widely used. The technique is popular because relatively large stress wave energies may be easily generated. Since the character of the generated stress wave is primarily a function of the vibration properties of the impactor, the pulse shaping ability (centre frequency and frequency content control) is limited to controlling the impact duration and intensity. Theoretically, the frequency content of the wave action generated by a ball drop on an elastic half-space can be controlled by varying the ball size and drop height, as defined by the Hertz solution for impact; the size of the impacting ball is the most significant factor in controlling the input frequency content. The frequency distribution of impact-generated wave pulses is generally broad, and the frequencies are relatively low-generally below 30 kHz. Control of the generated stress wave field in the material is limited: impact sources generate all wave modes (longitudinal, transverse and surface) with non-planar wave fronts. The principal drawbacks of using impact sources for stress
14 wave generation in conjunction with concrete-testing techniques are poor signal consistency. Poor signal controllability in terms of frequency content and poor stress wave field directivity control (Popovics et al. 1999). Some of the new methods for stress wave generation in concrete are Frequency-modulated Chirp Driving Signal and Amplitude-modulated Driving Signal. New Methods for Stress Wave Generation in Concrete Frequency-Modulated Chirp Driving Signal The use of piezoelectric-based stress wave sources which are driven with a frequency-modulated (FM) chirp electrical signal in place of a voltage spike has recently been reported for use in concrete testing. In contrast to traditionally excited piezoelectric sources, the characteristics of the electrical driving signal, rather than the resonance of the piezoelectric crystal, primarily determine the character of the resulting stress wave. The advantages of such excitation are improved control of the character of the stress wave in terms of centre frequency and frequency content and increased signal penetrating ability within the frequency region of interest, assuming that the driven source is suitably well behaved in a given frequency region. A drawback of FM chirp signals is the need for an advanced random signal synthesizer to generate the signal (Popovics et al. 1999). Amplitude-Modulated Driving Signal Electrical signals in the shape of amplitude-modulated (AM) sine bursts may also be used to drive the stress wave generators. AM burst-driven sources have the same advantages as those driven by FM chirps. However, sophisticated signal synthesizers are not required to generate AM burst signals. AM burst signals are obtained from two basic waveform generators connected together: one generator, designated as the carrier signal
15 generator, generates a sine burst (tone burst) of a given frequency and cycle length; the other generator, designated as the modulating signal generator, amplitude-modulates the burst with a sine or ramp function of lower modulating frequency. The only requirements for the signal generators are that the carrier signal generator must have tone burst generation and eternal AM input capabilities and that the modulating signal generator must have an external trigger input capability (Popovics et al. 1999). The following conclusions are drawn on the basis of the data presented in this study. Basic, readily obtainable signal generators and laboratory equipment may be assembled to generate AM-Burst driving signal. Piezoelectric ultrasonic transducers and electromagnetic modal shakers which are driven by AM bursts provide controlled and usable stress wave pulses in the frequency range needed for concrete testing: an appropriate electromagnetic modal shaker provides the lower-frequency signals (below 10KHz), while an appropriate piezoelectric transducer provides the higher range (15=50KHz). Piezoelectric ultrasonic transducers and electromagnetic modal shakers which are driven by amplified AM bursts provide stress waves with sufficient energy to test full sized concrete structures. The versatility of AMburst driven sources makes them eminently suitable for application to concrete testing techniques such as the impact echo and spectral-analysis-of-surface-waves tests. AMburst-driven stress wave sources offer excellent frequency-content control and significant noise reduction capability not found in the stress wave sources currently used with concrete test (Popovics et al. 1999). Direct measurement NDT & E techniques can be used to measure the properties of materials and the corrosion state in bridge damage detection directly. These techniques
16 could be based on various physical parameters. However, a technique is sometimes not suitable for in situ application. In a slightly destructive manner, however, samples could be taken from a bridge by using DS. HCPM can be used for detecting the rate of the corrosion of the steel bars in reinforced concrete. MFL can be used for locating the fracture of steel rebar in reinforced concrete and for detecting the corroded and broken cables for bridge cables (Wang et al. 2001). Inquiring Agency NDT&E Techniques Inquiring agency NDT & E techniques use an inquiring agent as a probe and which can be active or passive. The agent usually is a wave packet. In active techniques, the wave packet is generated by the testing instrument and transmitted into the materials to be tested. The examples are UT and GPR. The probe agent, the wave packet, interacts with the material and the foreign objects if it exists. Then it gives out some signals, which are carrying the information about the specimen. In passive techniques, the wave packet stems from the tested specimen itself and carries the information about the process the specimen is undergoing (Wang et al. 2001). Mechanical Wave Techniques (MWT) MWT takes mechanical waves as the working agency. The principle of these techniques is the generation, propagation and reception of mechanical waves. The wave packet transmitted into the materials to be tested interacts with the material and changes its own parameters, which carries the information about the properties of the tested object. MWT can meet most of requirements for NDT&E in bridge engineering. They are accurate in determining shape, size and depth of the defective areas, with high sensitivity, deep penetration, low cost, easy and fast operation, and convenient for in-situ use.
17 Working in the ultrasonic band, as an active method, UT can locate and identify defects, fractures, voids and inhomogeneous regions can measure thickness and size of defects, can estimate strength of steel and concrete in bridges. AE is one of the most important passive NDT&E techniques. Due to its passive measurement nature, AE can be applied to measure the object when the loads are actively added on a specimen and to monitor the dynamic behavior of structures such as bridges and buildings. It has been used to measure stress, identify rebar corrosion, locate corrosion position, estimate corrosion rate and monitor the cracking behavior of concrete. It is an extremely powerful technique for evaluating properties of the fracture and corrosion process. Working in the acoustic and low ultrasonic frequency band, as an active method, IE can be used to detect and locate flaws, fractures, voids, and delaminations in bridge deck and girder. It can also measure the depth of the flaws (Wang et al. 2001). Electromagnetic Microwave Techniques (EMT) EMT uses the special band of electromagnetic wave as the inquiring agency. As an active method, it is based on the physical laws on microwave generation, propagation and reception. By determining the wave velocity, reflection coefficient, and the attenuation and the velocity of the microwave packet to be tested, reliable and reproducible results can be obtained, which also depend on electromagnetic parameters of the material and the geometrical parameters of the object. By measuring the time of flight of microwaves, or the attenuation during passing through the testing object, or the reflection/transmission coefficients, one can deduce the parameters of the tested object, hence, to deduce some information about the structure and the mechanical properties of the tested object. As most of the non-metal materials are transparent to electromagnetic
18 waves, EMT possesses many advantages over other techniques. It can penetrate more deeply than ultrasound and is very sensitive in detecting the foreign metal objects inside the non-metal matrix, such as steel bars in concrete. It can detect a flat defect, which is difficult to detect by X-ray techniques. It is not sensitive to aggregate size and type. It can precisely locate the objects and has a wide range of measurement from microns of thickness of paint coating to meters of concrete articles. GPR is one of the most successful techniques using in bridge damage detection. It has been used for detecting bridge pier scour and deck delamination (Wang et al. 2001). Optical Techniques (OT) OT uses light waves as the inquiring agency. It is an active method and is based on interferometry and energy transportation. Representative of OT techniques applied in bridge damage detection is Infrared Detection (IRD). IRD uses the infrared light as the inquiring agency. It does not rely on the wave properties as do other wave based techniques. The thereto-properties of materials provide the basis for the measurements. It is also a non-contact, remote, and real time technique. The temperature resolution can reach 0.01 oC. Different kinds of Infrared Thermometer (IRT) systems are used in the implementation of IRD. IRT maps the isotherms over the surface of a component using a heat-sensitive device. By being loaded with heat energy, for example the sun's radiation, the object to be tested is pre-heated. There is a temperature distribution formed and the defects beneath the surface will affect the surface temperature and cause differences in the surrounding area, which can then be recognized from the map. IRT systems have been used for detecting delamination of reinforcement concrete bridges. Yanev (1995), Zachar et al (1992), and Maser et al (1990) have presented the principles and application
19 of IRT for detecting deterioration of bridge decks. TFHRC (1997) has reported two ongoing projects applying IRT: 1) to detect and quantify the fatigue cracks in steel highway bridges; 2) to develop a dual-band IRT imaging system for bridge deck inspection (Wang et al. 2001). Other Techniques There are also many other NDT&E techniques applied in bridge damage detection. These techniques could be an innovation and/or an integration of the techniques mentioned above. One example is the embedded corrosion microsensor (ECMS). The ECMS is developed to quantitatively measure the corrosion activity inside concrete. It is small and inexpensive which will allow hundreds or thousands of them to be embedded in concrete structures. The integrated circuit provides electrochemical measurements of corrosion rate with polarization resistance, and measures chemical parameters such as pH, chloride ion concentration, and temperature in an embeddable package. It is powered and it telemeters sensor data via wireless communication. Vibration-based damage detection methods have been successful to a certain extent, especially when the overall damage is significant. However, their application in bridge structures is often challenged since significant local damage might not cause observable difference in the observed quantities and because the number of measurements which can be made is limited. Much of this is related to systematic errors between the model and the structure and the non-stationary of the structure, and the modal data of concrete structure is particularly different to interpret, due to the non-uniformity of the material. Robust identification techniques that are able to locate damage based on realistic measure data sets still seem a long way from reality. Certainly however, if the horizons are
20 reduced and significant prior knowledge of the structure is included and sufficient measurements are taken, some progress can be made in some applications. One scenario is that damage detection using low frequency vibration is undertaken to identify those areas where more detailed local inspection should be concentrated. The most promising methods seem to be based on modal data and rely on the forward type identification methods. Even so, relying on low frequency vibration data will always be able to locate damage with a limited accuracy because of the global nature of the methods. Special instruments have shown great advantages in doing some specialized things better and more effectively than the general one. More commercial instruments for different specific purposes need to be developed. In bridge damage detection a problem usually requires different NDT&E techniques. Two or more independent techniques are needed for confidence in the results. However, information from different NDT systems can be conflicting, incomplete or vague if studied as discrete data. The new data fusion techniques seem to light the way to correct answers (Wang et al. 2001). Split Spectrum Processing SSP was initially introduced to enhance the signal-to-noise ratio for nondestructive testing of materials. This technique was shown to be effective in flaw enhancement, particularly in the detection of targets with similar spectral characteristics, yielding the hidden target information. The SSP method has been successfully used for noise suppression in non destructive testing of stainless steel and has the potential to improve detection of discontinuities in concrete as well. However, application of SSP to concrete is difficult because the internal structure of concrete varies within much wider limits than that of polymer composites or material, and the scatterers in concrete vary in
21 size to a much greater extend than in metals. There are several different scatterers in concrete, such as aggregate particles, voids, cracks, delaminations, etc. This is a more complex microstructure than in metals; the aggregate type and quantity can vary within can vary within wide limits in concrete. However, the preliminary tests have produced encouraging results with SSP, which appears to be a promising new technique for concrete inspection. In SSP, the backscattered wideband signal from concrete passed through a Gaussian filter bank to obtain signals at different normalized individually, giving zero-mean outputs. This introduces weighing to the frequency bands, which should have the effect of flattening the original spectrum, thus broadening the effective bandwidth and improving the system resolution. Subsequently, these signals are combined nonlinearly to obtain the processed signal where the interference noise caused by backscattering is suppressed. Split spectrum processing makes it possible to use ultrasound of MHz frequencies for testing. Despite the presence of significant scatterer noise, both the minimization and polarity shareholding algorithms reduce the noise level and help identify the ultrasonic signals reflected from the back surface and targets of interests. The experimental results demonstrate the potential of SSP for signal-to-noise enhancement of high-frequency ultrasound signals in concrete. This improvement can be related to the decorrelation of grain echoes resulting from frequency shifts between the transmitted signals. These results not only illustrate the capability of SSP in detecting multiple targets simultaneously, but also the ability of detecting discontinuities that are not readily visible in the unprocessed data. SSP is effective for detection of discontinuities and thickness measurement in concrete. The methods can be easily
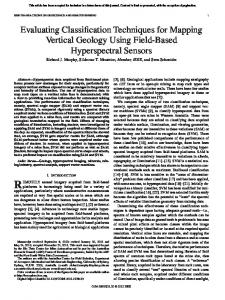
22 extended to two dimensional ultrasonic imaging of concrete, which is planned in future work (Karagouz et al. 1998). Acoustic Tomographic Imaging of Concrete Infrastructure According to Rens et al. (2000), Schuller et al. (1994) used the tomography technique to monitor the effectiveness of grouting repairs to masonry structures (Acoustic Tomographic Imaging of Concrete Infrastructure).Tomograms taken before and after grout injection were compared. The postrepair tomograms showed areas of increased velocity, indicating sound material. Rhazi et al. (1996) report success using a similar method. Several successful efforts have been made to image concrete sections with X-ray and gamma-ray tomographic systems. Morgan et al. (1980) used X-ray scanners to create tomograms of concrete cylinders. Narrow cracks of