EVALUATING THE APPLICATION OF NEURAL NETWORKS AND FUNDAMENTAL ANALYSIS IN THE AUSTRALIAN STOCKMARKET Bruce J Vanstone School of IT Bond University Gold Coast, Queensland, Australia
Gavin R Finnie School of IT Bond University Gold Coast, Queensland, Australia
Clarence N W Tan School of IT Bond University Gold Coast, Queensland, Australia
[email protected]
[email protected]
[email protected]
ABSTRACT This paper evaluates the use of an artificial neural network within a stockmarket trading strategy. The neural network was previously developed by the same authors, and has been trained using fundamental, company specific data. This study sites the neural network within a trading context, and demonstrates it is capable of producing economically significant results after accounting for costs.
1.
INTRODUCTION
In the field of computational finance, there have been a number of studies which demonstrate the superior predictability achieved by artificial neural networks (ANNs) as compared to a variety of other methods. Although these studies generally demonstrate superior predictability, it is necessary to go further when considering the use of a neural network as a trading tool. It must be demonstrated that the returns earned using a neural trading strategy are economically viable, that is, that profit is achieved after costs have been taken into account. Within the context of stock market trading, the relationship between predictability and returns is a complex one, and the logical idea that higher predictability equals higher returns is quite often not true. Indeed, Azoff [1] makes the point that there is no reason to assume that a system with a low forecast accuracy is necessarily unprofitable, until the forecasts are implemented in a trading system, and the capability to exploit large moves is gauged. This paper considers an ANN trained using fundamental company data, and previously published by Vanstone et al [2]. In this paper, the ANN is given rigorous out-of-sample testing, and the results are documented and benchmarked. The ANN was previously trained using NeuroLab, and is tested here using WealthLab, both tools of choice for developing and backtesting trading systems. As previously mentioned, the goal is to demonstrate that the ANN is capable of achieving superior, economically viable out-ofsample performance. To achieve this goal, it is necessary to site the ANN within a valid stockmarket trading system.
2.
REVIEW OF LITERATURE
According to Chande [3], a trading system consists of three major functions, namely: • • • 2.1.
Rules to enter and exit trades, Risk Control, and, Money Management RULES TO ENTER AND EXIT TRADES
Two different trading strategies are defined for the ANN being tested. In both cases, the outputs from the ANN are used as the primary signals to enter and exit trades, as described in the methodology. 2.2.
RISK CONTROL
According to Chande, risk control is defined as the process of managing open trades using pre-defined exit orders. In essence, stops (exit orders) are used by the trader to ensure the value at risk is constrained. There are a great many strategies for determining the placement of stops, however, there is no scientific process to determine an optimal stop value, instead, the choice of stop is often closely related to the actual entry used. A variety of methods are available, such as Volatility stops (refer to Overholser [4]), Fixed Dollar / Fixed Percent stops, Support and Resistance stops, Time delay stops, and Dev-Stops (refer to Kase [5, 6]). It should be noted that there are a variety of other techniques in common usage, a brief summary of other techniques is provided by Tharp [7]. Also, the use of stops within a given strategy, particularly if it is a long-term strategy, may not always be appropriate. Kaufman [8] demonstrates how the performance of a longer-term trending strategy without stops is most consistent, and concludes that the use of fixed value stops may even conflict with the strategy’s objectives.
The authors do not encourage trading without stops, and they acknowledge that the use of a stop can constrain losses dramatically. However, given that the goal of this research is to test the ANN developed, it would be ideal if the results achieved could be directly attributed back to the ANN output. For this reason, no stops are used within this paper. This allows us to fully test the output range of the ANN, and potentially exposes all hidden characteristics of the ANN without allowing it to be saved from disastrous trades by a stop. MONEY MANAGEMENT
2.3.
Money management refers to the actual size of the trade to be initiated, taking into consideration the account equity and potential for trade risk. Like risk control, the style of money management is closely related to the trading system, as it is influenced by many variables which are constrained by the specific system. As every trade carries a potential for loss, there is a need to determine the maximum amount of capital to expose at each trade, given a finite capital base. A number of specific approaches exist, and the reader is encouraged to pursue the following references: • • •
Kelly system: well described by Balsara [9] Optimal f: refer to Vince [10] Percent of equity: refer to Elder [11], and Pring [12]
The issue of money management is a complex one, and is only relevant here to provide a suitable framework to site the ANN trading system. For this reason, a simple form of money management was selected, namely, the use of 2% of equity per trade (as suggested by Elder). Not only is this simple to implement, but it also avoids having to determine how much of any profit effect observed is attributable to the neural network, and how much is attributable strictly to money management. Given the goal of this research, this choice seems appropriate. 2.4.
BENCHMARKING
A primary objective of a trading system is to produce (and capture) profit. However, in itself, the amount of profit obtained is an unsuitable benchmark for a variety of reasons. The desire to produce a profit must be tempered with such considerations as trading risk, equity curve management, amount of capital required, drawdown, and consistency. These factors determine how tradeable a system would be in practice. Trading systems are typically assessed according to a variety of metrics. The metrics presented in Table 1 are sourced from Babcock Jr [13], Chande [3], Ruggiero [14], Pardo [15], Kaufman [8], Tharp [7], and Refenes[16]. Each metric is briefly discussed in Table 1.
It should be remembered that the factors which determine whether a system is acceptable or not are ultimately the choice of the trader. No system should be chosen if it displays undesirable characteristics; however, individual traders would differ on their choice of system, dependant on such issues as their tolerance to risk, their amount of starting capital, and their trading horizon. Metric Net Profit Annualized Gain (%) Number of Trades Exposure (%) Winning Trades (%) Average Profit (%)
Losing Trades (%) Average Loss (%)
Max. Drawdown (%)
Profit Factor Recovery Factor
Payoff Ratio
Sharpe ratio
Brief Description Ending Capital – Starting Capital Annualized Net Profit (Loss). aka Annual Percentage Return (APR) Total Trades initiated by strategy Area of portfolio equity exposed to market, as calculated on a day-by-day basis. Percentage of trades that were winners. Average profit per winning trade, expressed as a percentage. Includes effect of trading costs, and does not take open positions into account. Percentage of trades that were losers. Average loss per losing trade, expressed as a percentage. Includes effect of trading costs, and does not take open positions into account. Largest peak to valley decline in the equity curve, on a closing price basis, expressed as a percentage of open equity. Gross Profit divided by Gross Loss. (Desirable systems should display over 2 for this ratio). Absolute value of Net Profit divided by Max Drawdown. (Desirable system must display over 1 for this ratio). Absolute value of average profit per trade divided by average loss per trade. (Desirable system must display over 2 for this ratio). Sharpe Ratio measures risk adjusted return. Specifically, the ratio indicates the historic average differential return per unit of historic variability of the differential return. Sharpe [17] provides a detailed discussion of
the limitations and uses of the Sharpe Ratio. It is calculated by obtaining the average percentage return of the trades generated, as well as the standard deviation of returns. The average return and average standard deviation are annualized by using the average number of days held per trade as a baseline. The annualized average return is then divided by the annualized standard deviation of returns. Ulcer Index Ulcer Index measures overall volatility of a portfolio. It is the square root of the sum of the squared drawdowns. Luck Coefficient Shows how the largest (by profit) trade compares to the average trade. Pessimistic Rate of A statistical adjustment of the Return wins to losses ratio for the purpose of estimating the worst expected return based on previous results. Pessimistic Rate of Return is calculated by decreasing the number of winning trades by the square root of the total winners, and increasing the number of losing trades by the square root of the number of losers. The result is then computed by multiplying the new number of winners by the average amount won, and dividing this by the new number of losers multiplied by the average amount lost. Equity Drop Ratio Potential for loss expressed as a probability by computing the standard deviation of all drops in the equity curve measured from each equity low to the previous equity high and dividing the result into the annualized return. Only equity drops greater than 2% are considered. The equity drop ratio favors higher profits, favors short term fluctuations in the equity curve, and does not penalize a system for large gains (as only equity drops are used to measure risk). Table 1 Trading System Metrics Further, when benchmarking a trading system, it is appropriate to perform a students t-test to determine the
likelihood that the observed profitability is due to chance. This is the method recommended by Katz [18], Katz and McCormick [19], Chande [3], Stakelum [20], and Kaufman [8]. The means of the strategies developed are tested against the mean of the distribution curve that a random trading strategy would produce, which is assumed to be zero under the null hypothesis of no excess returns. The hypotheses for the t-tests will be: H0: µprofit = 0, H1: µprofit > 0 The use of the t-test relies on assumptions of normality and independence. Essentially, these assumptions are constraints upon the usefulness of the t-test in evaluating trading systems. Typically, the assumption of normality is dealt with by reference to the Central Limit Theorem, which indicates that as the number of cases in the sample increases, the distribution of the sample mean approaches normal. Consequently, as long as the sample size is adequate (generally stated as at least 30 samples), the statistic can be applied with reasonable assurance. The constraint of independence presents a more difficult issue when testing trading systems. Essentially, the violation is potentially one of serial dependence, which occurs when cases constituting a sample are not statistically independent of one another. One method of dealing with this issue is to perform a runs test, as described by Vince [10]. The runs test shows whether the sequence of wins and losses in the sample trades contains more or less streaks than would ordinarily be expected in a truly random sequence, which has no dependence between trials. Although a runs test does not prove or disprove dependency, it can be used to determine an acceptable confidence limit in order to accept or reject a hypothesis of dependency. Vince demonstrates the runs test is essentially a matter of obtaining the Z scores for the win and loss streaks of systems trades, as follows:
( N*( R − 0.5)) − X Z Score = ( X * ( X − N )) ( N − 1)
where
N = total number of trades, X = 2 * total number of wins * total number of losses R = total number of runs in a sequence Equation 1 Computing the Z-Score for a Runs test
3.
METHODOLOGY
The approach taken in this paper is to generate two different strategies based on the previously developed ANN. The trading rules for the two strategies are: Strategy 1 Buy: when the output of the ANN is at signal strength 45 or above Sell: hold till end of period
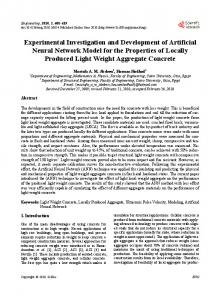
Strategy 2 Buy: when the output signal of the ANN increases Sell: when the output signal of the ANN decreases Table 2 Buy/Sell rules for strategies The main purpose of strategy 1 is to enable the ANN to be assessed as a stock selector. The only difference between strategy 1 and the buy-and-hold strategy, is that the buyand-hold strategy immediately buys all stocks, whilst strategy 1 waits until the ANN signal value is greater than 45. The in-sample performance of the ANN (1994 – 2001) is shown in Figure 1. It shows a breakdown of the output values of the ANN (scaled from 0 to 100) versus the average percentage returns for each network output value. The percentage returns are related to the number of days that the security is held, and these are shown as the lines on the graph. The ANN was designed to select stocks with a 100% (or greater) predicted appreciation. The value 45 (for output signal strength) is chosen as this is where the ANN signal strength crosses the 100% threshold (see arrow on diagram below). This value of 45 is then tested out of sample in this paper.
Figure 1 In-sample performance of the ANN The second strategy is designed to test the robustness of the ANN. The ANN is designed to yield a high strength signal when the stock price (actually, stock return) is expected to appreciate and a lower strength signal when the stock price (actually, stock return) is expected to fall. This second strategy avoids all reliance on any fixed value parameters. It simply buys a stock when there is an increase in the signal strength output by the ANN, and sells it when there is a reduction in signal strength output by the ANN. In this way, we can test whether the ANN has correctly predicted the direction of likely increases or decreases, regardless of the actual value of the ANN output. The trading parameters used in this study are: Parameter Value Starting Capital 100,000 Money Management % 2% Transaction Costs $20 each way Table 3 Trading Parameters
The study uses data from All Ordinary shares traded in the Australian stockmarket from the beginning of the trading year in 2002, until the end of the trading year in 2003, thus covering two trading years. It includes data for stocks delisted during this period. This is the out of sample period for the ANN previously developed. Both strategy 1 and strategy 2 are long strategies, and are executed with day +1 market orders. The starting capital value of $100,000 is selected as it represents the value of direct investment of the equal-largest proportion of direct share owners in Australia (20%), as reported by the Australian Stock Exchange [21]. The transaction cost model used is $20 each way. This amount is similar (actual $19.95 on 01/01/2005) to that available from CommSec (Commonwealth Bank online brokerage) [22]. The money management value of 2% has been previously discussed in section 2.3 above.
4.
RESULTS
Table 4 summarizes the results in terms of the previously described benchmarks for both strategy 1 and strategy 2. It also displays the relevant values for the naïve buy-and-hold strategy for easy comparison. Metric Strategy 1 Strategy 2 Net Profit $80,308.08 $43,640.73 Annualized 34.42 % 19.92 % Gain (%) Number of 50 86 Trades Exposure (%) 79.05 % 82.78 % Winning 58.00 % 59.30 % Trades (%) Average 159.82 % 63.59 % Profit (%) Losing 42.00 % 40.70 % Trades (%) Average Loss 28.28 % 26.59 % (%) Max. 27.61 % 18.34 % Drawdown (%) Profit Factor 7.69 3.40 Recovery 2.58 2.27 Factor Payoff Ratio 5.65 2.39 Sharpe ratio 1.03 1.16 Ulcer Index 14.42 7.23 Luck 6.88 7.55 Coefficient Pessimistic 5.22 2.56 Rate of Return Equity Drop 0.20 0.15 Ratio Table 4 Traders Metrics for Strategies
Buy&Hold $15,179.35 7.35 % 1365 100 % 39.05 % 120.22 % 60.95 % 52.49 % 35.86 % 1.48 0.42 2.29 0.96 24.75 8.92 1.36 0.71
Table 5 shows the results of the students t-test for each of the strategies, to determine whether the performance obtained could have been due to chance alone, if the population had an average profit of zero or less. The confidence level is set at 99%. Metric
Strategy 1
Strategy 2
50
86
Sample Mean
1601.16
507.45
Sample Standard Deviation (SD)
4087.13
1786.02
Standard Error of the Mean
578.00
192.59
2.779
2.635
49
85
t-statistic (1%,df) 1-tailed
2.404
2.371
Significance (1-tailed)
0.004
0.005
Lower 99% confidence interval of the Mean
444.61
-0.01
Upper 99% confidence level of the Mean
2767.71
1014.91
Sample size
t-statistic (P/L > 0) Degrees of freedom (df)
Table 5 Statistical Analysis of mean profit/loss Table 6 shows the results of performing the runs test against each of the two strategies. Metric
Strategy 1
Strategy 2
Total Cases
50
Number of Runs Z score
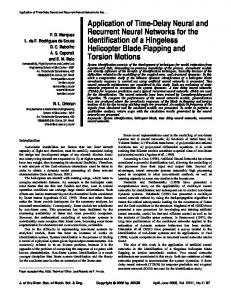
From a trading perspective, it is important to have an expectation regarding the distribution of monthly returns. Figure 2 shows the distribution of monthly returns for Strategy 1, and Table 7 summarizes these figures.
Figure 2 Distribution of Monthly Returns: Strategy 1 Metric Average Monthly return (%) Standard Deviation of Returns
Value 2.87 % 9.42
Best Monthly Return
28.54 %
Worst Monthly Return
- 8.45 %
Total Periods
24
Profitable Periods
14
Maximum Consecutive Profitable
6
86
Maximum Consecutive Unprofitable
5
20
42
Table 7 Summary of Monthly Returns for Strategy 1
-1.426
-0.003
Table 6 Runs test results
5.
In summary, then, both strategies have been robustly tested out-of-sample, and both have been found to be robust, and reliable.
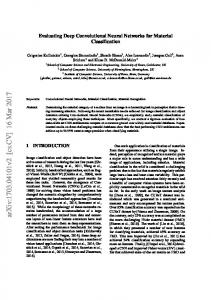
Figure 3 shows the distribution of monthly returns for Strategy 2, and Table 8 summarizes these figures.
CONCLUSIONS
The t-statistic for both Strategy 1 and Strategy 2 allows us to reject the null hypothesis (at 99% confidence), and conclude that the mean profit of both strategies is significantly greater than zero. Specifically, for Strategy 1, t(49) = +2.779, p < 0.01, one tailed. For Strategy 2, t(85) = +2.635, p < 0.01, one tailed. In the Runs Test, the Z-score is simply the number of standard deviations the data is from the mean of the Normal Probability Distribution. Vince recommends exceeding a confidence limit of 95.45% (2 standard deviations) to accept that there is dependency involved. As both Strategy 1 and Strategy 2 have an absolute Z-Score less than 2, it cannot be accepted that dependency is involved, and we must conclude that the trades are independent.
Figure 3 Distribution of Monthly Returns: Strategy 2 Metric Average Monthly return (%) Standard Deviation of Returns Best Monthly Return
Value 1.64 % 5.04 13.38 %
Worst Monthly Return
-7.97 %
Total Periods
24
Profitable Periods
15
Maximum Consecutive Profitable
6
Maximum Consecutive Unprofitable
3
Table 8 Summary of Monthly Returns for Strategy 2
6.
FUTURE RESEARCH
The neural network tested in this paper has only been trained using fundamental company data, and has had no access to the price change data generated every day on the stock exchange. To fully exploit the available data, a neural network needs to be developed which can take advantage of the timing opportunities afforded by daily price changes. The network tested in this paper gives a good indication of the likely prospects of a companies share price within the next year, but it gives no indication of when the likely outcome can be expected. Therefore, the next steps are to train a neural network to take advantage of the timing opportunities afforded by the stock market, and to site both of the neural networks in a valid trading context, including risk control and money management. This is the future direction of this research.
REFERENCES 1. 2.
3. 4.
5. 6. 7. 8.
Azoff, M.E., Neural Network Time Series Forecasting of Financial Markets (Chichester: Wiley, 1994). Vanstone, B., G. Finnie, and C.N.W. Tan, Applying Fundamental Analysis and Neural Networks in the Australian Stockmarket. International Conference on Artificial Intelligence in Science and Technology (AISAT 2004), Hobart, Tasmania, 2004. Chande, T.S., Beyond Technical Analysis: how to develop and implement a winning trading system (New York: Wiley, 1997). Overholser, R., Designing a Money Management Strategy: Using Volatility-Based Stops and the Kelly Criterion, Technical Analysis of Stocks and Commodities, 18(5), 2000, 38-. Kase, C.A., Trading with the odds: using the power of probability to profit in the futures market (Chicago: Irwin Professional Publishing, 1996). Kase, C.A., The Kase Dev-Stop(sm) - Accounting for Volatility, Variance and Skew in Managing Trade Risk. Tharp, V.K., Trade your way to Financial Freedom (NY: McGraw-Hill, 1998). Kaufman, P.J., Trading Systems and Methods. Wiley Trading Advantage (New York: Wiley, 1998).
9. 10.
11. 12. 13. 14. 15. 16. 17. 18. 19. 20. 21. 22.
Balsara, N.J., Money management strategies for futures traders. Wiley finance editions (New York: Wiley, 1992). Vince, R., Portfolio Management Formulas: mathematical trading methods for the futures, options and stock markets (NY: John Wiley & Sons, 1990). Elder, A., Trading for a Living: John Wiley & Sons, 1993). Pring, M.J., Martin Pring's Introduction to Technical Analysis (Singapore: McGraw-Hill, 1999). Babcock Jr., B., The Dow Jones-Irwin Guide to Trading Systems (Homewood, Illinois: Dow JonesIrwin, 1989). Ruggiero, M., Cybernetic Trading Strategies: developing a profitable trading system with stateof-the-art technologies (New York: Wiley, 1997). Pardo, R., Design, testing, and optimization of trading systems. Wiley Traders Advantage Series (New York: Wiley, 1992). Refenes, A.-P.N., ed. Neural Networks in the Capital Markets. 1995, Wiley: Chichester. Sharpe, W.F., The Sharpe Ratio, The Journal of Portfolio Management, 21(1), 1994, 49-58. Katz, J.O. and D.L. McCormick, The encyclopedia of trading strategies. Irwin trader's edge series (New York: McGraw-Hill, 2000). Katz, J.O. and D.L. McCormick, Using Statistics with Trading Systems, Technical Analysis of Stocks and Commodities, 15, 1997, 347-352. Stakelum, J., Designing a Personal Neural Net Trading System, Technical Analysis of Stocks and Commodities, 13, 1995, 31-36. 2003 Australian Share Ownership Study,2004,http://www.asx.com.au/pdf/2003_Aust ralian_Share_Ownership_Study.pdf Commsec Financial Services Guide,2004,http://images.comsec.com.au/pdf/FSR A/FSRA2003.pdf