Evaluation, usability, screen, design, layout, complexity. INTRODUCTION ... measure for design preference [2] in Windows
Southern Cross University
ePublications@SCU Southern Cross Business School
1995
Evaluating usability of screen designs with layout complexity Tim Comber Southern Cross University
John R. Maltby Southern Cross University
Publication details Comber, T & Maltby, JR 1995, 'Evaluating usability of screen designs with layout complexity', in H Hasan & C Nicastri (eds) , Proceedings of HCI, a light into the future : OZCHI '95 , CHISIG Australia, Downer, ACT.
ePublications@SCU is an electronic repository administered by Southern Cross University Library. Its goal is to capture and preserve the intellectual output of Southern Cross University authors and researchers, and to increase visibility and impact through open access to researchers around the world. For further information please contact
[email protected].
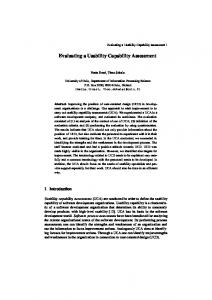
EVALUATING USABILITY OF SCREEN DESIGNS WITH LAYOUT COMPLEXITY T. Comber and J. R. Maltby Centre for Computing and Mathematics Southern Cross University Lismore New South Wales 2480 Australia E-mail: {tcomber, jmaltby}@scu.edu.au ABSTRACT
This paper presents work-in-progress in assessing the usefulness of the layout complexity metric in evaluating the usability of different screen designs. An application "Launcher" was developed in Visual Basic that calculated complexity and collected usability data. Seven subjects provided some evidence that complexity could be of benefit to the screen designer. However, though Launcher proved useful in collecting data, some problems needed to be overcome, namely more concise data collection and a better method for building screens, before more data can be collected. KEYWORDS
of the experiment and also collected user preferences for different designs by means of a questionnaire at the end. The data collected does seem to indicate that complexity could be used to evaluate screen designs but due to the limited number of subjects, tasks and screens, the results need to be treated with caution. It is intended to update "Launcher" to improve its ability to generate different layouts and to pre-analyse data to improve analysis. Hypothesis
A layout has a minimum complexity where all objects are the same size and are aligned as neatly as possible to a grid. Maximum complexity occurs when every object has a different size and no two objects are aligned (Figure 1).
Evaluation, usability, screen, design, layout, complexity INTRODUCTION
There are many different methods for evaluating user interfaces [4] but whatever method is chosen the ideal time to evaluate usability is at the design stage [5]. It stands to reason that any measure that can aid the designer will be of benefit to any software project. This paper looks at a pilot study using one such possible measure, layout complexity, in evaluating the usability of a graphical user interface at the design stage. Layout complexity is a quantitative method for determining the relative order and disorder of objects. It has been used as a design metric for printed text [1] and for text displayed on computer screens [7-10]. It has also been shown to be a measure for design preference [2] in Windows applications. For layout complexity to be a useful metric it needs to be shown that it effects some or all aspects of usability. Usability has been defined as consisting of effectiveness, learnability, flexibility, and attitude [5]. An experiment was chosen as the best method to gain data for each dimension of usability. The experiment consists of a simple application, Launcher, running under Microsoft Windows that calculates layout complexity for each design iteration. Visual Basic (VB) was chosen to build the application and collect data as it could provide the necessary information about the dimensions and positions of most objects. It also could be used to track the user’s progress with a task, keeping a record of each event and time taken. Launcher collected data about the user with a survey form at the start
Minimum Complexity
Maximum Complexity
Figure 1: Examples of the two extremes of complexity
Tullis and Bonsiepe [1, 7, 8] both imply that reducing complexity increases usability. However in a previous study, we found that users do not like "simple" screens [2]. We feel that a screen with minimal complexity is boring to look at and has difficulties in using size and position cues to indicate the function of objects. On the other hand a screen with maximum complexity is also not desirable as it can be visually confusing and less productive to use [10]. Formally we suggest that there is a trade off between usability (U) and complexity (C) with a relationship of the form U = f(C) where U is a maximum for some intermediate value of C (Figure 2).
Optimum Complexity
extreme as the interface approaches maximum complexity, it looks artificially irregular. More importantly it becomes impossible for the designer to group objects with similar functions on the basis of size or position.
Usability
METHOD Launcher
Com plexity Figure 2: Relationship between complexity and usability
Given a curve of the above shape, the optimum complexity will occur at the point dU/dC = 0 ie midway between the two extremes of complexity. It would be expected that for this optimum complexity an application would be easier to learn, quicker to use, have less user errors and have the highest level of user satisfaction. As the complexity figure becomes smaller, it becomes more difficult to distinguish different interface objects and the interface takes on an artificial regularity. At the other
The application Launcher (Figure 3) was used as the vehicle to test the usefulness of layout complexity as a usability metric. Launcher was designed as an example application for a Visual Basic tutorial and provides an alternative to the Window’s "Program Manager" by allowing the user to: 1. select a program 2. give it a descriptive name 3. click on the name to run the program It also gives visual feedback as to the type of file selected by displaying: • part of a graphic file, • part of a text file, • or garbage characters if an executable file. The user can also delete files from within launcher.
Figure 3: The application, "Launcher", used in this experiment
Screen Layouts
Four different screen layouts were designed, each with a different complexity score. The screen with the lowest score
consisted of objects arranged in a neat grid with almost uniform sizes. The next two screens consisted of almost normal layouts and the final screen had every object with a different size and position. Table 1 shows the complexity ratings for each of the four screens used in the experiment. The theoretical minimum was not achievable in VB, when
using different objects, as some objects could not be resized to match other objects ie objects in VB have a fixed size relationship to other objects.
C %
Theory min. 71 0%
Time to Complete Task Per Screen
Complexity Scores for 17 Objects Scr. 1 Scr. 2 Scr. 3 Scr. 4 156 42%
170 49%
186 57%
Both these problems may in part be caused by the uniformity of the screen layout but for the full experiment a better cue will be provided for the file to be selected and the order of the screens will need to be varied.
Theory max. 272 100%
228 78%
Table 1: Complexity scores for 17 objects
PROCEDURE
Seven experienced computer users volunteered to take part in the pilot study. Each subject was asked to read an ethics disclaimer and answer some basic questions about computer usage and experience. They were then requested to select a file, add it to a list, change its name and quit for each screen. At the completion of the first stage they were asked to indicate their preferences for the different screens. They were given the choice of looking at printed copies of the screens or selecting images of the screens. The application was designed to record the time it took users to complete each step in a task and to record any errors. The subjects were then asked to run through the experiment again thus giving a second set of data for the same task and screen. It was expected that any improvement in performance for the second run would indicate an interface that was more learnable and memorable.
The total time spent on each screen is presented in Table 3. It can be seen that there was an overall improvement in task completion time from the first run to the second run. Screen 1 and Screen 4 were slower to complete. The times for Screen 1 were possibly affected by the same problems as mentioned in the previous section.
Total Time Spent Run
Scr. 1
Scr. 2
Scr. 3
Scr. 4
Total
First Second
221 133
165 125
147 129
145 148
678 535
Total
354
290
276
293
Table 3: Time spent completing the task for each screen and run
Satisfaction
The subjects were asked to select which screen was: 1. the most attractive, 2. the best design, 3. the easiest to use, 4. most needed to be re-designed.
RESULTS AND DISCUSSION Errors
Each subject scored 1 if the screen was completed correctly and 0 if any mistake was made. This provided a simple measure of error rates. Table 2 shows the percentage correct for each screen design and for each run of the experiment.
If the subject felt that a screen did not meet the condition then none could be selected. The votes for each screen are shown in Table 4. The votes for re-design are shown as minus figures to highlight the negative nature of the statement. Some subjects changed their minds on the second run. The reasons for this were not explored.
User Preferences Scr. 1
Scr. 2
Scr. 3
Scr. 4
None
Attractive BestDesign EasyToUse ReDesign
4 2 5 -7
3 4 0 0
3 7 7 -1
4 1 1 -6
0 0 1 0
Rating
4
7
16
0
1
Percentage error-free screens Run
Screen1
Screen2
Screen3
Screen4
First Second
29% 43%
71% 86%
100% 71%
71% 71%
Mean
36%
79%
86%
71%
Table 2: Percentage of screens that were completed without errors
There were no errors for Screen 3 in the first run and in the second run Screen 2 had the least errors. The two screens at either end of the complexity scale exhibited more errors, however the results for Screen 1 were confounded by 2 problems: 1. Confusion about the task. It was clear that even though the subjects had the opportunity to practise the task before commencing the experiment they still seemed confused about how to achieve the task. 2. Confusion about which object to choose. There were no cues as to which box held the file to be selected as a file was already displayed in a text box.
Table 4: Users evaluation of the different screen designs
It is clear that both the least and most complex screens were rated poorly even though more users found them attractive. It is also interesting, that even though it was a small homogenous group, there was still quite a divergence of preferences for the screen. Summary
Table 5 summarises the results. It is clear that the screens with a mid-range complexity, screens 2 and 3, rate better overall than the screens at either end of the complexity scale.
However these results do need to be treated cautiously because of the small number of subjects and the limited number of screens. Summary Usability
Scr. 1
Scr. 2
Scr. 3
Scr. 4
Complexity Error-free Time Rating
156 36% 354 4
170 79% 290 7
186 86% 276 16
228 71% 293 0
Table 5: Summary of usability
CONCLUSIONS The Visual Basic Application
VB did prove a useful tool for calculating complexity though there were some problems especially with building a generalisable method for getting information about the objects in the interface. It was also useful for collecting data about the user’s interaction with the application. However one shortcoming in this pilot was using different forms for each screen. It should be possible to dynamically position objects on the interface thus requiring only one form. Some minor bugs were corrected but the biggest problem was analysing the data collected. Improvements need to be made to the structure of the data files. The application will be modified to improve the data collection. The full experiment will involve more subjects from a wider cross-section of users and will provide a greater variety of tasks and screen designs. Future work will also look at any benefits to be achieved by having information about the interface available at design time. Complexity
The results from this pilot showed differences in usability between screens differing in complexity. Graphic design manuals [3] stress the importance of using a grid to layout objects. Complexity theory offers a means for determining if objects have indeed been laid out in a grid but is a perfect grid pattern the best way to layout a screen? The least complex screen, which most followed an exact grid, was not the most usable though the limited number of subjects, tasks and screens do suggest treating the results with caution. A complexity metric has the potential to address screen design problems early in the SDLC and to provide guidance to the inexperienced or casual programmer. It is not envisaged that it be the only or even the most important metric for evaluating screen design but given the expense and difficulty of most usability testing methods and the ease with which it can be calculated by the interface programming environment it promises to provide a simple and effective evaluation technique. Summary
1. 2. 3. 4.
Assess Visual Basic’s suitability as a program vehicle for calculating complexity and collecting data about the user. Reveal any "bugs" in the application and in the data collecting. Develop an application that was "real-life". Gather some preliminary usability data.
These goals have been met. The application will be extended to present more screens and more tasks and a wider crosssection of users will be involved in the next iteration. Extra metrics will also be added including "layout appropriateness" [6], percentage white space and sampling of mouse pointer position to determine whether the user has "wandered" looking for the correct button. We intend to make the application available from our web page1 in order to collect data from a wide sample of subjects. It is hoped that the next experiment will show that complexity theory can be applied to GUI layout thus providing a useful design metric. REFERENCES
[1] Bonsiepe, G. A. (1968). A method of quantifying order in typographic design. Journal of Typographic Research, 2, 203-220. [2] Comber, T., & Maltby, J. R. (1994). Screen complexity and user design preference in windows applications. In S. Howard & Y. K. Leung (Ed.), OZCHI’94, (pp. 133-137). Melbourne, Australia: CHISIG. [3] Galitz, W. O. (1993). User-Interface Screen Design. Inc., P. O. Box 812070, Wellesley, MA 02181: Q. E. D. Information Sciences. [4] Holyer, A. (1993). Methods for evaluating user interfaces (Cognitive Science Research Paper No. No. 301). University of Sussex at Brighton. [5] Lindgaard, G. (1994). Usability Testing and System Evaluation. London: Chapman & Hall. [6] Sears, A. (1993). Layout appropriateness: A meteric for evaluating user interface widget layout. IEEE Transactions on Software Engineering, 19(7), 707-718. [7] Tullis, T. S. (1981). An evaluation of alphanumeric, graphic, and color information displays. Human Factors, 23(5), 541-550. [8] Tullis, T. S. (1983). The formatting of alphanumeric displays: a review and analysis. Human Factors, 25(6), 557-582. [9] Tullis, T. S. (1988a). Screen design. In M. Helander (Eds.), Handbook of Human-Computer Interaction Elsevier Science Publishers B.V. (NorthHolland).
This pilot had four main goals: 1http://www.scu.edu.au/buscomp/compmaths/tcomber.html
[10] Tullis, T. S. (1988b). A system for evaluating screen formats: Research and application.
Advances in Human-Computer Interaction, 214-286.