Evaluation model of the global performance of a management simulation for the academic environment Modelo de avaliação do desempenho global em uma simulação gerencial no contexto acadêmico
Ricardo Rodrigo Stark Bernard Universidade Federal de Santa Catarina - UFSC - Brasil Moisés Pacheco de Souza Faculdades Barddal - Brasil Maurício Vasconcellos Leão Lyrio Instituto de Ensino Superior da Grande Florianópolis – IES/GF – Brasil
Resumo Este artigo propõe e testa um modelo de avaliação de desempenho em uma simulação gerencial, no contexto acadêmico, levando em consideração os indicadores identificados pelos envolvidos no processo: professor e estudantes. Para a construção do modelo, foi utilizada a metodologia multicritério de apoio à decisão construtivista, em uma disciplina de simulação gerencial. Dezessete (17) critérios foram identificados para serem usados na avaliação do desempenho da simulação. A metodologia demonstrou o que poderia ser considerado em cada critério e sua relativa importância. O modelo de avaliação foi testado na mesma turma em que foi concebido. Como resultado, a aplicação do exercício de simulação gerencial apontou para um desempenho global de 88 pontos. O número 100 foi considerado pelo professor como uma boa pontuação. Neste modelo foram envolvidos não apenas critérios de avaliação tradicionais de estudantes e equipes, mas também foram envolvidas características do professor, dos estudantes, do simulador e do ambiente simulado. Palavras-chave: Simulação Gerencial, Avaliação de Desempenho, Metodologia Multicritério de Apoio à Decisão Construtivista, MCDA-C. Abstract This paper proposes and tests a model of performance evaluation in an exercise of management simulation in the academic environment taking into account the indicators identified by the ones involved in the process, i.e., professor and students. For the construction of the model the Multiple Criteria Decision Aid Constructivist (MCDA-C) method was used in a management simulation course. Seventeen (17) criteria were identified in order to be used for performance evaluation in the simulation. The methodology demonstrated what would be considered in such criteria and their relative importance. The evaluation model was created and tested in the same class that conceived it. As a result, the application of the exercise of management simulation pointed to a global performance of 88 points out of 100, a number considered as a good score by the professor. In the model, not only traditional evaluation criteria of students and teams was involved, but also the characteristics of the professor, the students, the simulator and the simulated environment. Key words: Management Simulation, Performance Evaluation, Multiple Criteria Decision Aid Constructivist, MCDA-C.
R evista C ontemporânea de C ontabilidade
ISSN 1807-1821, UFSC, Florianópolis, ano 05, v.1, n°9, p. 153-173, Jan./Jun., 2008
153
Ricardo Rodrigo Stark Bernard, Moisés Pacheco de Souza e Maurício Vasconcellos Leão Lyrio
1 Introduction The main goal of utilizing the management simulation in the academic environment is to develop students’ awareness and learning as regards the dynamic business environment as well as the improvement of the skills and attitudes of those participating in the process. As defined by Keys & Wolfe (1990, p.1), “management games are used to create experimental environments within which learning and behavioral changes can occur and in which managerial behavior can be observed”. Many perspectives have been studied to evaluate the performance in exercises of management simulation. This paper proposes a new perspective of performance evaluation focusing on the global performance of a class in the management simulation exercise. Such a way of evaluation reveals both the strong and weak points of an exercise of management simulation. In order to obtain the global performance, the authors developed a model of performance evaluation of a class in the management simulation exercise by making use of the Multiple Criteria Decision Aid Constructivist (MCDA-C) methodology as the instrument of intervention. Such a model comprises both the perceptions of students and the professor in identifying the criteria to be evaluated. This methodology attempts to consider the perceptions and values of those involved in the process so as to identify the elements to be considered for the evaluation by developing an adequate model for the specific situation under analysis. The aim of this paper is therefore to report the construction and testing of an evaluation model of performance of a class in an exercise of management simulation which involves the perceptions of both the students and the professor, thus allowing a more adequate way of performance evaluation as regards the criteria they consider important.
2 Evaluation in Management Simulation The evaluation of an exercise of management simulation can be carried out under several views. One of the most investigated views is the learning that the management simulation provides to its participants. At the beginning, the learning was assumed to be positively related to simulated company performance (TEACH, 2007). But, this assumption was not supported in many studies (ANDERSON & LAWTON, 1990; ANDERSON & LAWTON, 1997; TEACH, 1990; WASHBUSH & GOSEN, 2001). However, many rigorous studies have proved that management simulation does provide some learning, as reviewed by Gosenpud (1990). What is in discussion, as stressed by Faria (2001) is ‘What is learned?’, ‘What type of learning occurs?’ and ‘How does learning occur?’ As a result of one overview of 154
ISSN 1807-1821, UFSC, Florianópolis, ano 05, v.1, n°9, p. 153-173, Jan./Jun., 2008
R evista C ontemporânea de C ontabilidade
Evaluation model of the global performance of a management simulation for the academic environment
pieces of research on learning of business simulation until the late nineties, the author categorized six periods, as follows (FARIA, 2001, p.105): (a) Many studies identifying specific issues learned through business games (1974 to 1976); (b) Extension of basic learning studies from students to business executives and simulation administrators (late 1970s and early 1980s); (c) Overviews of learning studies (mid-1980s); (d) Agreement that some form of learning takes place with the use of business simulation/games (late 1980s); (e) A shift in research from what is learned to how learning takes place (early 1990s); and (f) Attempts to design studies that will prove cognitive and behavioral learning occur through the use of business games (late 1990s). In a complementary view, Schumann et al. (2001) suggest a framework for evaluating simulations as educational tools. For them, learning is just one aspect to be evaluated (level 2). Other aspects would include the reactions the participants show towards the experience (level 1), the level of change of behavior (level 3), and finally, the benefits they may provide later to their workplaces (level 4). The evaluations of the reactions towards the experience are generally measured through variables such as satisfaction and motivation, two factors that have been investigated by many authors. The assumption behind many of such investigations is that these factors may be considered as variables that precede learning. Yet the levels of change of behavior and later benefits, although deemed easy to be analyzed, are difficult to be measured as they normally require more complex designs and involve longitudinal studies; in addition, the variables under observation are susceptible to have the influence of several exogenous factors. More recently, research is being conducted to verify if the way participants react to the simulated performance can affect their learning. For example, if students with a learning orientation react more favorably to a negative outcome in simulation games than students with a performance orientation. Preliminary findings have presented inconclusive results (GENTRY et al., 2007). It should be also pointed out that the role played by the professor must also be taken into consideration as, according to Keys & Wolfe (1990, p.314), the way he/she manages a simulation is probably the most important factor for the success of an application. In spite of such evidence, research on the impact of the professor’s variables upon the performance of a simulation exercise has not been found in the literature. This paper is based on the level 1 of the framework presented by Schumann et al. (2001) for the evaluation of a management simulation, involving not only R evista C ontemporânea de C ontabilidade
ISSN 1807-1821, UFSC, Florianópolis, ano 05, v.1, n°9, p. 153-173, Jan./Jun., 2008
155
Ricardo Rodrigo Stark Bernard, Moisés Pacheco de Souza e Maurício Vasconcellos Leão Lyrio
traditional evaluation criteria of students and teams, but also the characteristics of the professor, the students, the simulator and the simulated environment. It must be highlighted that the variables chosen for the evaluation of an exercise of management simulation were one of the results of the research, according to the perception of those involved in the process.
3 Multiple Criteria Decision Aid Constructivist (MCDA-C) Methodology The Multiple Criteria Decision Aid Constructivist (MCDA-C) is one of the segments of the multicriteria methodologies, a research area which is considered an evolution of the Operational Research. The multicriteria approach may be considered as having two main segments: on the one side, the MCDM proposes to develop a mathematical model which allows the discovery of “that” optimum solution which is believed to be pre-existent, notwithstanding the individuals involved. On the other side, the MCDA attempts to help modeling the decision context departing from the consideration of convictions and values of the individuals involved by seeking to construct a model which is founded on the decisions that favor what is believed to be most adequate (ROY, 1990). The position related to the decision situation – while the MCDM seeks an optimum solution, the MCDA seeks an adequate solution – may be considered the main difference between these two currents of thought. The process of support to decision developed by the MCDA-C is permeated by Piaget’s constructivist view, according to which knowledge is the result of some kind of interaction between the subjective and the objective elements, i.e., interaction between an active individual looking for an adaptation to an object – an engagement which results in a representation that is objectively valid and subjectively significant (LANDRY, 1995, p.326).
4 Construction of the Model The group chosen for the construction of the model was a class of 32 undergraduate students who were taking “Business Game II”, a course of the last period of Accountancy at the Universidade Federal de Santa Catarina – UFSC [Federal University of Santa Catarina, Brazil]. The criterion for the selection of the group was intentional, i.e., the class had already taken the course “Business Game I” and the students had already had, therefore, a previous experience with management simulations as well as with a system of method evaluation. Thus, students were expected to provide more criteria to be taken into account by the model. A random selection was performed to choose one student of each team. As a result, 8 students were chosen to help in the construction of the model. As 156
ISSN 1807-1821, UFSC, Florianópolis, ano 05, v.1, n°9, p. 153-173, Jan./Jun., 2008
R evista C ontemporânea de C ontabilidade
Evaluation model of the global performance of a management simulation for the academic environment
soon as the model was devised, all the 32 students have also received a questionnaire by e-mail to provide the necessary information to test the model. The questionnaire had a 25% response rate. Detailed information about the entire construction of the model is provided next. For the construction of the model the MCDA-C methodology was employed in three stages, as suggested by Ensslin (2002). Stage I – Structuring: consisting of understanding and ordering the decision context (creation of the decision tree and attributes). Stage II – Evaluation: consisting of developing local cardinal scales for the attributes created and identifying the substitution rates by informing the relative importance of each attribute for the global result of the model. In this stage the application of the model is also carried out. Stage III – Making Recommendations: consisting of suggesting potential actions with the goal of improving students’ performance in the exercise of management simulation. Stage I – Structuring: The structuring stage was divided into two phases: (a) identifying the actors involved in the decision context and (b) structuring such a context. (a) The actors were divided into two categories: • Those acted upon (students that were not interviewed) – with no power of decision. They simply undergo the consequences of the decision established by the interveners. • Interveners – these have the power of decision as they directly act in the decisions taken. The interveners are divided into decision-maker (the professor), demanders (students who were interviewed and who represent the teams), and facilitators (responsible for the creation, data gathering and testing of the model). The facilitators are not totally active. However, they provide support to the decision and suggest recommendations. (b) The structuring of the decision process was divided into four steps: • Step 1: Definition of the label of the problem. • Step 2: Survey of the Primary Evaluation Elements (PEEs). • Step 3: Construction of the point-of-view arbor. • Step 4: Construction of the attributes. Step 1 – Definition of the label of the problem: The label is the statement of the problem. It must carry the focus of the work, the goal to be achieved and not to leave any traces of doubt. In this paper, the label of the model was defined as Construction of an Evaluation Model of Performance for a Management Simulation Class. Step 2 – Survey of the PEEs: After defining the decision context and the label of the problem, the structuring of the model itself is started. To this end, R evista C ontemporânea de C ontabilidade
ISSN 1807-1821, UFSC, Florianópolis, ano 05, v.1, n°9, p. 153-173, Jan./Jun., 2008
157
Ricardo Rodrigo Stark Bernard, Moisés Pacheco de Souza e Maurício Vasconcellos Leão Lyrio
initially the PEEs must be surveyed, as they are the first concerns that come to the decision-maker’s mind as regards the decision situation. The PEEs are surveyed by means of the brainstorm technique in which the decision-maker is invited to discuss about the situation by surveying the concerns that come to his/her mind as regards the problem, without any kind of limitation. After this interaction, sorting is carried out not considering the redundant PEEs or the ones that are considered irrelevant. For this specific paper, the PEEs were surveyed by means of 8 (eight) semistructured interviews representing one student for each simulated company and the professor of the management simulation course. The questions raised were the starting point for the discussion instead of a script strictly followed so as to avoid the heading of the answers given by the decision-makers. By means of such interviews 99 PEEs related to the performance in a management simulation exercise were obtained, broken down as follows: 59 PEEs were extracted from the interview with the professor, whereas 40 were extracted from the interviews with the students. The 99 PEEs surveyed from the interviews were grouped according to the affinity of ideas, as described by Eden (1988), which resulted in 26 PEEs. Table 1 and Table 2 present all the PEEs obtained through the interviews with the professor and with the students respectively, while Table 3 shows the final PEEs.
158
ISSN 1807-1821, UFSC, Florianópolis, ano 05, v.1, n°9, p. 153-173, Jan./Jun., 2008
R evista C ontemporânea de C ontabilidade
Evaluation model of the global performance of a management simulation for the academic environment
Table 1: Primary Evaluation Elements (PEEs) from the professor’s point of view PROFESSOR Code
PEE
Code
PEE
01
Access to the website
31
Evolution
02
Team members affinity
32
Experience
03
Competitor analyses
33
Market experience
04
Analyses of the simulated results
34
Familiarity with the simulation model
05
Learning
35
Feedback
06
Simulation learning
36
Presence
07
Class attendance
37
Managerial indicator
08
Delays
38
Integration of the functional decisions
09
Managerial capabilities
39
Interaction
10
Scenario
40
Autocratic leader
11
Complexity
41
Democratic leader
12
Specific managerial concepts
42
Motivation
13
Concepts of the company’s functions
43
Practical level
14
Managerial concept
44
Theoretical level
15
Academic concepts
45
Simulation objectives
16
Competition
46
Participation
17
Strong competition
47
Experience with the simulation model
18
Knowledge
48
Presence in the classroom
19
Company knowledge
49
Affinity problems with the professor
20
Managerial knowledge
50
Personal problems
21
Knowledge consolidation
51
Professor’s desired characteristics to use the method
22
Context of the simulation
52
Students’ interest in checking the simulated results
23
Academic performance
53
Professor-students relationship
24
Managerial performance
54
Managerial results
25
Demotivation
55
Theory
26
Knowledge initiation
56
Teamwork
27
Didactic
57
Macroeconomic variables
28
Team assignments
58
Market vision
29
Teaching
59
Practical experience
30
Understanding of the simulator
Source: Elaborated for the authors.
R evista C ontemporânea de C ontabilidade
ISSN 1807-1821, UFSC, Florianópolis, ano 05, v.1, n°9, p. 153-173, Jan./Jun., 2008
159
Ricardo Rodrigo Stark Bernard, Moisés Pacheco de Souza e Maurício Vasconcellos Leão Lyrio
Table 2: Primary Evaluation Elements (PEEs) from the students’ point of view STUDENTS Code
PEE
Code
PEE
60
Market environment
80
Justification of the decisions
61
Learning
81
Leadership
62
Discussion
82
Earning
63
Goal achievements
83
Motivation
64
Autocratic leader
84
Economic concepts
65
Market characteristics
85
Objectives
66
Coherence
86
Divergence of ideas
67
Competition
87
Planning
68
Added knowledge
88
Professor behavior
69
Initial knowledge
89
Consequences of the decisions
70
Stock market value
90
Mathematic formulas of the model
71
Erroneous decisions
91
Respect to the student’s viewpoint
72
Defense of opinions
92
Respect to the team member
73
Defense of ideas
93
Theory
74
Understanding
94
Work in teams
75
Market understanding
95
Teamwork
76
Strategy
96
Strategy
77
Experience
97
Professional life
78
Class attendance
98
Market vision
79
Basic information
99
Systemic vision
Source: Elaborated for the authors.
160
ISSN 1807-1821, UFSC, Florianópolis, ano 05, v.1, n°9, p. 153-173, Jan./Jun., 2008
R evista C ontemporânea de C ontabilidade
Evaluation model of the global performance of a management simulation for the academic environment
Table 3: Final Primary Evaluation Elements (PEEs) Final PEEs Academic performance (23)
Motivation (25, 42, 46, 52 83)
Access to the website (1)
Professor***
Background/Education (12, 14, 15, 18, 21, 27, 29, 44, 55, 84)
Professor’s management experience (13, 19, 20, 32, 33, 43, 58 59)
Class attendance (7, 8, 36, 48, 78)
Professor-student relationship (49, 50, 53, 88)
Company indicators (70, 82)
Simulated company**
Competition (3, 16, 17, 67)
Simulated environment (10, 22, 60, 65)
Complexity (11)
Simulation objectives (5, 6, 26, 31, 45, 61, 68, 69, 74, 85)
Decision quality (35, 43, 63, 66, 71, 76, 80, 87, 89, 90, 96)
Student*
Experience with the model (30, 34, 47, 51)
Students’ management experience (77, 97, 98, 99)
Leadership (40, 41, 64, 81, 86) Macroeconomic indices (57, 75)
Student-student relationship (28, 39, 56, 62, 72, 73, 91, 92, 94, 95)
Managerial performance (9, 24, 54)
Team**** Written works (94, 95)
* Including the PEEs Written works, Motivation, Class attendance, Access to the website and Student´s management experience. ** Including the PEEs Decision quality and Company indicators. *** Including the PEEs Professor´s management experience, Experience with the simulator, Background/Education and Simulation objectives. **** Including the PEEs Professor-student relationship, Student-student relationship, and Leadership.
Source: Elaborated for the authors.
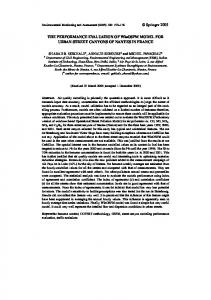
Step 3 - Construction of the point-of-view tree: The models based on the MCDA-C are normally organized in the form of an arborescent structure or decision tree: the label of the problem is placed at the highest level, then the areas of interest come right below it, followed by the Fundamental Points of View (FPVs), and finally, if necessary, the Elementary Points of View (EPVs) are displayed. The EPVs are unfolded until they come to a susceptible level of measurement. The 24 PEEs were reorganized in a hierarchical way so as to facilitate the understanding, as presented in Figure 1.
R evista C ontemporânea de C ontabilidade
ISSN 1807-1821, UFSC, Florianópolis, ano 05, v.1, n°9, p. 153-173, Jan./Jun., 2008
161
1 Academic performance
2 Managerial Performance
50%
20%
70%
30%
1.1 Professor
30%
2.1 Simulated environment
1.2 Student
2.2 Simulated Company
2.3 Team
7% 20%
1.1.1 Simulation objectives
3%
1.1.2 Experience with the method
1.1.3 Experience with the model
40%
1.1.4 Professor´s management experience
30% 1.1.5 Background / Education
50%
40%
1.2.1 Written works
1.2.2 Motivation
50% 1.2.2.1 Class attendance
To evaluate the objectives of the simulation exercise
To evaluate the professor’s experience with the method
To evaluate the professor’s experience with the model used in the simulation exercise
To evaluate the professor’s years of experience in company management.
To evaluate the professor’s background/education
To evaluate students’ average grades in written works
To evaluate students’ average attendance
10% 1.2.3 Student´s management experience
20%
2.1.1 Complexity
50%
2.1.2 Macro-economic indices
30%
2.1.3 Competition
50%
2.2.1 Decision quality
50%
2.2.2 Company Indicators
20%
2.3.1 Professor/student relationship
40% 2.3.2 Student-student relationship
40%
2.3.3 Leadership
50% 1.2.2.2 Access to the website
To evaluate student’s average window time between the posted results and the access to the website
To evaluate students’ average experience in company management
To evaluate the number of decision variables existent in the simulation model
To evaluate the combination of macroeconomic indices used in the simulation by To evaluate the taking into account: high inflation rate; low market share of economic growth; high the simulated firms participation of imported products; high readjustment of suppliers; high interest rates
To evaluate the number of companies that rationally made use of the information with the support of calculators, spreadsheets and/or material not required by the professor.
To evaluate the average growth of the net profit of the companies in the simulation exercise in comparison to the initial value
To evaluate the number of teams that had relationship problems with the professor of the discipline
To evaluate the number of teams that had relationship problems inside the team
To evaluate the number of teams with an authoritarian leader or without a leader
Ricardo Rodrigo Stark Bernard, Moisés Pacheco de Souza e Maurício Vasconcellos Leão Lyrio
40%
60%
R evista C ontemporânea de C ontabilidade
Figure 1: Constructed model of global performance of a management simulation
ISSN 1807-1821, UFSC, Florianópolis, ano 05, v.1, n°9, p. 153-173, Jan./Jun., 2008
Source: Elaborated for the authors.
162
Performance Evaluation in a Management Simulation
Evaluation model of the global performance of a management simulation for the academic environment
Step 4 – Construction of the attributes: Once the decision tree has been constructed, the next step of the structuring stage consists of the construction of the attributes, which are the tools used for measuring and evaluating the performance of the potential actions (in the case, the potential action will be the performance of the class in exercising the management simulation). Table 4 presents some attributes created for the model with their respective value functions. The attribute, according to Kenney & Raiffa (1993, p.32) “provides a scale for measuring the degree to which its respective objective is met”. Once the phase of attributes’ construction is finished, the stage of the model’s structuring is concluded.
R evista C ontemporânea de C ontabilidade
ISSN 1807-1821, UFSC, Florianópolis, ano 05, v.1, n°9, p. 153-173, Jan./Jun., 2008
163
Ricardo Rodrigo Stark Bernard, Moisés Pacheco de Souza e Maurício Vasconcellos Leão Lyrio
Table 4: Example of attributes and value functions for all the Elementary Points of View (EPV) Attribute 1.1.1: Simulation objectives Objective: To evaluate the objectives of the simulation exercise. Impact Reference Levels Levels L5 L4 L3
GOOD
Description
Value Function
The management simulation course had specific pedagogical goals. The professor was clear about these goals. The goals were achieved. Goals not initially defined were also achieved.
150
The management simulation course had specific pedagogical goals. The professor was clear about these goals. The goals were achieved.
100
The management simulation course had specific pedagogical goals. The NEUTRAL professor was clear about these goals. However, the goals were not achieved.
0
L2
The management simulation course had specific pedagogical goals. However, the professor was not clear about these goals and the students did not achieve them.
-150
L1
The management simulation course had not specific pedagogical goals. The professor only run the simulation and the students were focused only in achieving the best simulated performance results.
-175
Attribute 1.1.2: Experience with the method Objective: To evaluate the professor’s experience with the method. Impact Reference Levels Levels L5
Description
Value Function
More than 2 administrations
127
2 administrations
100
L3
1 administration
55
L2
NEUTRAL Only experience as participant
L4
GOOD
L1
Without experience
0 -55
Attribute 1.1.3: Experience with the model Objective: To evaluate the professor’s experience with the model used in the simulation exercise. Impact Reference Levels Levels
Description
Value Function
L5
More than 4 administrations
200
L4
3 a 4 administrations
175
2 administrations
100
L3 L2
GOOD
NEUTRAL 1 administration
L1
0
Without experience
-125
Attribute 1.1.4: Professor´s management experience Objective: To evaluate the professor’s years of experience in company management. Impact Reference Levels Levels
Description
Value Function
L5
More than 10 years of experience
160
L4
5 to 10 years of experience
140
1 to 5 years of experience
100
L3 L2 L1
GOOD
NEUTRAL Up to 1 year of experience Without experience
0 -120
Source: Elaborated for the authors. 164
ISSN 1807-1821, UFSC, Florianópolis, ano 05, v.1, n°9, p. 153-173, Jan./Jun., 2008
R evista C ontemporânea de C ontabilidade
Evaluation model of the global performance of a management simulation for the academic environment
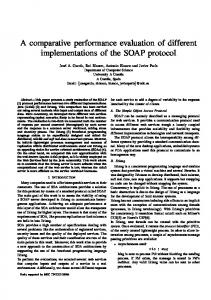
Stage II – Evaluation: The evaluation stage starts with the construction of local cardinal scales for the attributes’ levels. This process makes use of the Macbeth-Scores software (BANA e COSTA, VANSNICK, 1997), in which the levels of anchorage for the attributes are defined (Neutral Level and Good Level). The area above the superior limit is considered the level of excellence that is aimed at, whereas the area below the inferior limit is considered inadequate, thus being penalized by the model. Once the anchorage takes place, it is time to establish the differences of attractiveness between the attributes’ levels. For such, it is necessary to create a value function for each attribute by making use of the semantic judgement method through one-by-one comparisons (BANA e COSTA, STEWART, VANSNICK, 1995), as shown in Figure 2. Figure 2: Example of one value function generated by the Macbeth-Scores software
Source: Elaborated for the authors.
The next phase of the evaluation consists of identifying the substitution rates that inform the relative importance of each criterion of the model. Upon obtaining the substitution rates of each one of the criteria, it is possible to turn the evaluation value of each criterion into values of a global evaluation. There are several methods for such, as the Trade-off (BODILY, 1985; VON WINTERFELDT, EDWARDS, 1986; WATSON & BUEDE, 1987; KEENEY, 1992; BEINAT, 1995), the Swing Weights (BODILY, 1985; VON WINTERFELDT, EDWARDS, 1986; GOODWIN & WRIGHT, 1991; KEENEY, 1992; BEINAT, 1995), and the Oneto-one comparison (BEINAT, 1995; LARICHEV & MOSHKOVICH, 1997). R evista C ontemporânea de C ontabilidade
ISSN 1807-1821, UFSC, Florianópolis, ano 05, v.1, n°9, p. 153-173, Jan./Jun., 2008
165
Ricardo Rodrigo Stark Bernard, Moisés Pacheco de Souza e Maurício Vasconcellos Leão Lyrio
For this paper the substitution rates were obtained by means of the Swing Weights method, which consists of requesting the decision-maker (the professor) to choose, as of a fictitious action with performance at the Neutral level of impact in all criteria, a criterion in which the action performance improves until it reaches the Good level. Such a leap forward is worth 100 points. Next, the decision-maker is requested to define, among the remaining criteria, which one he/she would like to have a leap from the Neutral level to the Good level, and how much this leap would be worth in relation to the first one; this step is repeated for all other criteria of the model (ENSSLIN et al., 2001, p.224-225). As an example, take the establishment of the substitution rates for the sub-EPVs 2.1.1 – Complexity, 2.1.2 – Macroeconomic indices and 2.1.3 – Competition, in relation to the EPV 2.1 – Simulated environment. The decision-maker deemed the first leap should have taken place at the sub-EPV 2.1.2, thus assigning 100 points to it. Next, 60 points were assigned to the sub-EPV 2.1.3 and 40 points to the sub-EPV 2.1.1. At last, it is necessary to equalize such values so that they total 1 by dividing the points related to each criterion by the total of points. This way, the substitution rates are: 2.1.1 – Complexity 2.1.2 – Macro-economic indices 2.1.3 – Competition
w1 = 40/200 = 0.20 or 20% w2 = 100/200 = 0.50 or 50% w3 = 60/200 = 0.30 or 30%
Once the substitution rates have been replaced, the evaluation model is concluded and has already reached its largest goal – to generate understanding about the decision context – which is taken as important for the performance evaluation of a class in an exercise of management simulation. Nevertheless, it is also an objective to know the global performance of the class in the exercise of management simulation and this leads to the aggregation of the local evaluations (evaluation of the EPVs/criteria). The global evaluation of an action/alternative is calculated by means of the following mathematical equation of additive aggregation: V(a) = W1*V1(a) + W2* V2(a) + W3* V3(a) + … Wn* Vn(a) where: V(a) = global value V1(a), V2(a), …,Vn(a) = partial value of the criteria 1, 2, 3, …, n. W1, W2, …, Wn = substitution rates of the criteria 1, 2, 3, …, n. n = number of criteria in the model. 166
ISSN 1807-1821, UFSC, Florianópolis, ano 05, v.1, n°9, p. 153-173, Jan./Jun., 2008
R evista C ontemporânea de C ontabilidade
Evaluation model of the global performance of a management simulation for the academic environment
Stage III – Making Recommendations: In this stage potential actions to improve the performance are suggested. The process of making the recommendation actions is carried out based on the attributes whose performances did not meet the decision-makers’ expectations.
5 Analysis and application of the model Based on the application of the proposed methodology, it was possible to construct a model of performance evaluation founded on the perceptions of the ones involved (professor and students that were interviewed) in a course of management simulation. Departing from the process of the model’s construction, it was possible to identify 17 (seventeen) criteria that should make up the model to be used for evaluating the performance of a management simulation class, as follows: 1.1 – Professor, subdivided into 1.1.1 – Simulation objectives, 1.1.2 – Experience with the method, 1.1.3 – Experience with the simulator, 1.1.4 – Professor’s management experience, and 1.1.5 – Background/education; 1.2 – Student, subdivided into 1.2.1 – Written works; 1.2.2 – Motivation (explained by 1.2.2.1 – class attendance and 1.2.2.2 – Access to the website), and 1.2.3 – Students’ management experience; 2.1 – Simulated environment, subdivided into 2.1.1 – Complexity, 2.1.2 – Macroeconomic indices and 2.1.3 – Competition; 2.2 – Simulated company, subdivided into 2.2.1 – Decision quality, and 2.2.2 – Company indicators; and, finally, 2.3 – Team, subdivided into 2.3.1 – Professor-student relationship, 2.3.2 – Student-student relationship, and 2.3.3 – Leadership. Figure 1 presents the model constructed in this paper, which shows the 17 (seventeen) criteria as well as the simulated performance profile of the class under investigation. The performance of each criterion was obtained by means of information regarding the simulated environment (simulator’s data), the professor (personal and group’s data), and the students (when the information could not be obtained by the professor). The information collected directly with students was received by means of a questionnaire sent by e-mail (25% of return rate). The questions were concerned with ‘years of managerial experience in real-world companies’, ‘the use of calculators, spreadsheet software and bibliographical references to support the decision making process’, ‘the existence of student-professor relationship problems’, ‘the existence relationship problems inside the team’, and ‘the leadership style of the team-member leader’. Once the information was collected, the global evaluation could take place by means of the additive aggregation method: R evista C ontemporânea de C ontabilidade
ISSN 1807-1821, UFSC, Florianópolis, ano 05, v.1, n°9, p. 153-173, Jan./Jun., 2008
167
Ricardo Rodrigo Stark Bernard, Moisés Pacheco de Souza e Maurício Vasconcellos Leão Lyrio
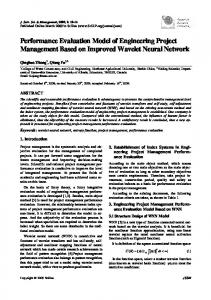
V(a) = {0.60 * [0.30 * (0.20 * 100 + 0.07 * 127 + 0.03 * 200 + 0.4 * 160 + 0.3* 100)] + [0.70 * ((0.40 * 50 + 0.50 * (0.50 * 75 + 0.50 * 100)) + 0.10 * 67)]} + {0.40* [0.50 * (0.20 * 50 + 0.50 * 100 + 0.30 * 50)] + [0.30 * (0.50 * 100 + 0.50 * 0)] + [0.20 * (0.20 * 200 + 0.40 * 150 + 0.40 * 200)]} = 88 The positive punctuation of 88 was obtained as the result provided by the performance evaluation of a class of management simulation, in a scale from “0” (Neutral Level or Minimum Acceptable) to “100” (Good Level), which characterizes a performance near to the level which is considered to be good by the decision-maker (the professor). However, sheer identification of such a performance profile is not enough to aid the improvement process of students’ performance. Thus, the graphic representation of the performance profile is elucidating in the sense that it allows the visualization of those Elementary Points of View – EPVs (or criteria) responsible for the inadequacy of the performance of the class under investigation. As shown in Figure 3, criteria 1.2.1 – written works, 1.2.2 – attendance, 1.2.3 – students’ management experience, 2.1.1 – complexity, and 2.1.3 – competition are the weak points of the class’s performance. By identifying the criteria that jeopardize the global performance of the class it is then possible to propose the actions for improvement. As guided during the recommendations stage, the generation process of actions of improvement is carried out based on the attributes. An important aspect of the model is the possibility it offers to verify the specific performances by means of the analysis of the ramifications of the decision tree. After the application of the model, it was possible to verify that the professor, for having experience with the method of management simulation and with the simulator, as well as for having good academic background knowledge and experience in management of real companies, had an excellent performance. His punctuation reached 129 points, which is considered an excellent performance. Yet students got 70 points, mainly because of the criteria “written works”, “attendance” and “students’ management experience”. This analysis allowed to verify that the professor’s performance was above the “good” level (100 points), while students’ performance was below the level considered “good” for the decision-maker (the professor). The global performance of the simulation exercise, on its turn, underwent greater influence of the students’ criteria because they had a heavier weight in the decision tree.
168
ISSN 1807-1821, UFSC, Florianópolis, ano 05, v.1, n°9, p. 153-173, Jan./Jun., 2008
R evista C ontemporânea de C ontabilidade
Evaluation model of the global performance of a management simulation for the academic environment
6 Conclusion In this paper a new approach to performance evaluation of an exercise of management simulation was developed and applied, which was founded on the perceptions and values of those involved in the process, i.e., the professor of the course and his/her students, and showed, in an objective and clear way, the performance of the class under analysis. As some perceptions provided by the students could be influenced by the professor’s knowledge of such information, the students were advised that all information would be only disclosed after the course was finished and anonymously. Thus, the students were free to provide sensitive information without having their grades compromised by the professor’s judgment. Another result obtained was the possibility to compare the different views – of both professor and students – in regard to the evaluation system, as presented in Table 4. The model constructed allows the evaluation not only of the global performance of the class but also the performance of the professor, the students, the simulated environment, the simulated company or the teams, as well as the analysis of the distinct ramifications of the decision tree. The application of the model constructed take place in two different lines: (i) to improve the understanding about the criteria considered important in the evaluation of a class in a management simulation exercise, both from the perspective of the professor and the students involved in the process, and (ii) to measure the performance of a class on the basis of objective criteria, minimizing the ambiguity of the evaluation process and providing the implementation of improvement actions on the grounds of the criteria in which the class is not on adequate levels. However, the evaluation criteria of the applied model cannot be generalized because it was devised considering the perceptions and values of a specific class. Given such a situation, the model must be calibrated in each future application, taking into account the different perceptions of the professor (decision-maker) and the students (demanders) as regards the criteria to be chosen to evaluate a management simulation course and their relative importance. For example, in the evaluation model suggested, the complexity of the simulator was considered by the decision-maker (the professor) as a positive criterion. At a first glance, this choice contradicts the theory that learning may occur with both simple and complex simulators (KEYS & WOLFE, 1990; FEINSTEIN & CANNON, 2002). However, in this particular application, the use of a more complex simulator was important because the goal of the simulation was to give a holistic view of a company’s operation and such a view might not have been obtained if had a simpler simulator been used. This is one of the reasons that ratify the importance of stating that the model suggested is idiosyncratic for R evista C ontemporânea de C ontabilidade
ISSN 1807-1821, UFSC, Florianópolis, ano 05, v.1, n°9, p. 153-173, Jan./Jun., 2008
169
Ricardo Rodrigo Stark Bernard, Moisés Pacheco de Souza e Maurício Vasconcellos Leão Lyrio
a given class. The maximum that may be utilized is the methodology and a suggestion of the criteria employed. As a final comment, it is important to highlight that the proposed evaluation model is an academic exercise. Practical applications must be preceded by more academic evaluations of its effective validity, the user’s familiarity with de MCDA’s methodology and a cost-benefit analysis because the proposed evaluation model is time consuming and resource intensive.
References ANDERSON, P. H.; LAWTON, L. “The Relationship Between Financial Performance and Other Measures of Learning on a Simulation Exercise.” Developments in Business Simulation and Experimental Learning, Vol. 17, 6-10. Reprinted in the Bernie Keys Library, 8th edition [Available from http:// ABSEL.org], 1990. ANDERSON, P. H.; LAWTON, L. “Designing Instruments for Assigning the Effectiveness of Simulations”. Developments in Business Simulation and Experimental Learning, Vol. 24, 300-301. Reprinted in the Bernie Keys Library, 8th edition [Available from http://ABSEL.org]. 1997. BANA e COSTA, C.A., STEWART, T.J., VANSNICK, J.C. “Multicriteria decision analysis: some troughs based on the tutorial and discussion sessions of the ESIGMA meetings”. Euro XIV Conference, pp. 261-272, Jerusalem, July 3-6, 1995. BANA e COSTA, C.A., VANSNICK, J.C. “Applications of the MACBETH Approach in the Framework of an Additive Aggregation Model”. Journal of Multicriteria Decision Analysis. Vol. 6, 2, 107-114, 1997. BEINAT, E. Multiattribute Value Functions For Environmental Management. Amsterdam: Timbergen Institute Research Series, 1995. BODILY, S. E. Modern Decision Making: A Guide to Modeling with Decision Support Systems. New York: McGraw-Hill. 1985. EDEN, C. “Cognitive Mapping”. European Journal of Operational Research . N. 36, p. 1-13. 1988. ENSSLIN, S. R. “A incorporação da perspectiva sistêmico-sinergética na metodologia MCDA-construtivista: uma ilustração de implementação”. Tese de 170
ISSN 1807-1821, UFSC, Florianópolis, ano 05, v.1, n°9, p. 153-173, Jan./Jun., 2008
R evista C ontemporânea de C ontabilidade
Evaluation model of the global performance of a management simulation for the academic environment
doutorado – Programa de Pós-Graduação em Engenharia de Produção. Universidade Federal de Santa Catarina, Florianópolis, 2002. ENSSLIN, L; MONTIBELLER, G. N.; NORONHA, S. M. D. Apoio à Decisão: metodologias para estruturação de problemas e avaliação multicritério de alternativas. Florianópolis: Insular, 2001. FARIA, A. J. “The changing nature of business simulation / gaming research: A brief history”. Simulation & Gaming ,Vol. 32, 1, 97-110, 2001. FEINSTEIN, A. H.; CANNON, H. M. “Constructs of Simulation Evaluation.” Simulations & Gaming, Vol. 33, 4, 425-440, 2002. GENTRY, J. W.; DICKINSON, J. R.; BURNS, A. C.; MCGINNIS, L.; PARK, J. “The Role of Learning versus Performance Orientations when Reacting to Negative Outcomes in Simulation Games: Further Insights.” Developments in Business Simulation and Experimental Learning, Vol. 34, 4-10. Reprinted in the Bernie Keys Library, 8th edition [Available from http://ABSEL.org], 2007. GOSENPUD. J. “Evaluation of experiential learning. In James W. Gentry (Ed.). Guide to Business Simulation and Experimental Learning. (pp. 301-329). East Brunswick, NJ: Nichols/GP. Reprinted in the Bernie Keys Library, 8th edition [Available from http://ABSEL.org], 1990. GOODWIN, P.; WRIGHT, G. Decision analysis for Management Judgement. Chichester: John Wiley & Sons, 1991. KEENEY, R. L. Value-Focused Thinking: A Path to Creative Decision making. Cambridge: Harvard Univ. Press, 1992. KEENEY, R. L., RAIFFA, H. Decisions with Multiple Objectives - Preferences and Values Tradeoffs. Cambridge: Harvard Univ. Press. 569 pages, 1993. KEYS, B., WOLFE, J. “The Role of Management Games and Simulations in Education and Research”. Journal of Management, Vol. 16, 2, 307-336, 1990. LANDRY, M. A. “Note on the Concept of ‘Problem’”. Organization Studies, Vol. 16, 2, 315-343 – EGOS 0170-8406/95 – 0016-0012, 1995. LARICHEV, O. I.; MOSHKOVICH, H. M. Verbal Decision Analysis for Unstructured Problems. Amsterdam: Kluwer Academic Publishers, 1997. R evista C ontemporânea de C ontabilidade
ISSN 1807-1821, UFSC, Florianópolis, ano 05, v.1, n°9, p. 153-173, Jan./Jun., 2008
171
Ricardo Rodrigo Stark Bernard, Moisés Pacheco de Souza e Maurício Vasconcellos Leão Lyrio
ROY, B. “Decision-aid and decision making”. in: Bana e Costa (ed.) Readings in Multiple Criteria Decision Aid, Berlin: Springer, 17-35, 1990. SCHUMANN, P. L., ANDERSON, P. H., SCOTT, T. W., LAWTON, L. “Framework for Evaluating Simulations as Educational Tools.” Developments in Business Simulation and Experimental Learning, Vol. 28, 215-220. Reprinted in the Bernie Keys Library, 8th edition [Available from http://ABSEL.org], 2001. TEACH, R. “Profits: the false prophet in business gaming”. Simulation & Gaming, Vol. 21, 12-25, 1990. TEACH, R. “Assessing Learning in a Business Simulation.” Developments in Business Simulation and Experimental Learning, Vol. 34, 76-8. Reprinted in the Bernie Keys Library, 8th edition [Available from http://ABSEL.org], 2007. VON WINTERFELDT, D.; EDWARDS, W. Decision Analysis and Behavioral Research. Cambridge: Cambridge University Press, 1986. WASHBUSH, J., GOSEN, J. “An Exploration of Game-derived Learning in Total Enterprise Simulations”. Simulation & Gaming ,Vol. 32, 3, 281-296, 2001. WATSON, S. R., BUEDE, D. M. Decision Synthesis. Cambridge: Cambridge Univ. Press, 1987.
Artigo recebido em: Junho de 2008 e Artigo aprovado para publicação em: Novembro de 2008.
Endereço dos autores
Ricardo Rodrigo Stark Bernard
[email protected] Rod. Haroldo Soares Glavan, 3950 – casa 107 Florianópolis, SC - Brasil 88.050-005 172
ISSN 1807-1821, UFSC, Florianópolis, ano 05, v.1, n°9, p. 153-173, Jan./Jun., 2008
R evista C ontemporânea de C ontabilidade
Evaluation model of the global performance of a management simulation for the academic environment
Moisés Pacheco de Souza
[email protected] Rua Juvenal Francisco Pereira, 212 – Kobrasol São José, SC - Brasil 88.102.140
Maurício Vasconcellos Leão Lyrio
[email protected] Rua Lauro Linhares, 970 apto. 203 / Bloco B2 – Trindade Florianópolis, SC - Brasil CEP: 88.036-001
R evista C ontemporânea de C ontabilidade
ISSN 1807-1821, UFSC, Florianópolis, ano 05, v.1, n°9, p. 153-173, Jan./Jun., 2008
173