Evaluation of Image Fusion Performance with Visible Differences Vladimir Petrović1 and Costas Xydeas2 1
Imaging Science Biomedical Engineering, University of Manchester Oxford Road, Manchester, M13 9PT, UK
[email protected] 2 Dept. Communication Systems, University of Lancaster, Bailrigg, Lancaster, LA1 4YR, UK
[email protected]
Abstract. Multisensor signal-level image fusion has attracted considerable research attention recently. Whereas it is relatively straightforward to obtain a fused image, e.g. a simple but crude method is to average the input signals, assessing the performance of fusion algorithms is much harder in practice. This is particularly true in widespread “fusion for display” applications where multisensor images are fused and the resulting image is presented to a human operator. As recent studies have shown, the most direct and reliable image fusion evaluation method, subjective tests with a representative sample of potential users are expensive in terms of both time/effort and equipment required. This paper presents an investigation into the application of the Visible signal Differences Prediction modelling, to the objective evaluation of the performance of fusion algorithms. Thus given a pair of input images and a resulting fused image, the Visual Difference Prediction process evaluates the probability that a signal difference between each of the inputs and the fused image can be detected by the human visual system. The resulting probability maps are used to form objective fusion performance metrics and are also integrated with more complex fusion performance measures. Experimental results indicate that the inclusion of visible differences information in fusion assessment yields metrics whose accuracy, with reference to subjective results, is superior to that obtained from the state of the art objective fusion performance measures.
1 Introduction Multisensor imaging arrays have become reliable sources of information in a growing range of applications. However, in order to fully exploit additional information in scene representations of different sensors, considerable processing effort is required. Furthermore, displaying multiple image modalities to a human operator simultaneously leads to confusion and overload, while integrating information across a group of users is almost impossible [6]. Signal-level image fusion deals with this problem by reducing the physical amount of multisensor (image) data while preserving its information content value [1-5]. Whereas it is relatively straightforward to obtain a fused image, e.g. simply average the inputs, assessing the performance of fusion
algorithms, particularly those intended to produce a visual display is much harder in practice. The most reliable and direct method of evaluating fusion for display are subjective tests in which audiences of intended users evaluate fused images under tightly controlled conditions either by comparing them to each other or by performing specific visually oriented tasks. Subject responses or task performance are logged and need to be processed further to obtain a meaningful performance evaluation making the whole process expensive both in terms of time, effort and equipment required [58]. Alternatively objective fusion evaluation metrics require no display equipment or complex organisation of an audience and their advantage is obvious in terms of effort and time expended on the evaluation process. Implementation of such algorithms in computer code and simulation experiments reduces the assessment time from days or weeks to often a few minutes. A significant advantage is also the ability to use objective metrics within the process of fusion system development. Hence a fully computational evaluation metric is able to provide irreplaceable performance change information and thus drive, for example, the process of fusion system parameter optimization in a way that is impossible to achieve using human subjects and complex visual testing procedures. So far, only a limited number of relatively application dependent objective image fusion performance metrics has been published in the literature [3,4,9,10,12]. Target signature consistency as an evaluation criterion for detection/recognition applications is proposed in [10]. The idea of comparing the fused image to an “ideally” fused image and estimating performance from their difference was used in [3,4]. In both cases images with different focus points were fused manually (cut and paste) to produce the ideal fusion reference. In general however, this method is not generally applicable as in the majority of fusion applications the ideal fused image is “ill” defined and cannot be obtained manually [3,4]. Meanwhile, [2,12] proposed metrics based on mutual information for image sequence and still image fusion performance, respectively. This paper addresses the issue of objectively predicting the results of subjective image fusion performance tests using Visible Differences (VD). VD is a concept widely used in image fidelity assessment that determines the probability of an observer noticing a difference between the appearances of two signals [14]. In the context of objective fusion assessment VD probability maps are derived from input and fused images and used to form several image fusion metrics. Importantly, VD information is also used to gauge the behaviour and the internal processes involved in subjective fusion evaluation. In the following, detailed description of the approach is provided as well as experimental results of the proposed metrics compared with data obtained from real subjective fusion evaluation tests that demonstrate its subjective relevance and relative advantage compared to the current state of the art.
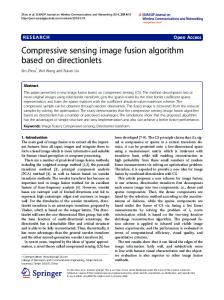
2 Visible Differences Predictor The Visual Difference Predictor (VDP) used in the proposed metrics is based on a scheme by Daly [14] that describes the visibility near the visual threshold of the differences between two versions A and B of an image. Figure 1 shows a block diagram
of the VDP system that employs a model of the human visual system (HVS) and operates the input images A and B. The output of the VDP is a 2-dimensional map P, whose elements 0 ≤ Pm,n ≤ 1 indicate the probability of detecting visual differences between the two images at every pixel location (m,n). Pm,n=1 indicates that differences are suprathreshold and completely detectable whereas Pm,n=0 indicates that the difference between the two images at this location can not be detected. Notice that the VDP output map does not discriminate between different suprathreshold visual distortions, which can be “fully” detected. According to [14], VDP has been successfully tested for many types of image distortion including compression artefacts, blurring, noise, banding, blocking, etc.
Fig. 1. Structure of the VDP
The HVS model accounts for three main visual sensitivity variations. These are modelled by the three sequentially cascaded components shown in Fig. 1, i.e. the amplitude nonlinearity, the contrast sensitivity function (CSF) and the detection mechanisms. These variations are functions of light intensity, spatial frequency and image content respectively. The sensitivity variation with respect to light intensity is primarily due to the light adaptive properties of the retina, and it is referred as the amplitude nonlinearity of the HVS. The variation in sensitivity with respect to spatial frequency is due to the combined effect of the eye optics and neural circuitry, and is referred as the contrast sensitivity function (CSF). Finally, the variation in sensitivity with image content is due to the post-receptor neural circuitry. This effect is referred as masking and is modelled by the detection mechanisms. A detailed description of an efficient implementation of the VDP system can be found in [13,14].
3. VD Image Fusion Performance Evaluation The theoretic goal of signal-level image fusion process is to represent all the visual information from a number of images of a scene taken by disparate sensors into a single fused image without distortion or loss of information. In practice however,
displaying all the information in one image is almost impossible and most algorithms concentrate on faithfully representing only the most important input information. In fusion for display [1-9] systems, this is perceptually important information and the fused image should therefore contain all, important input information detectable by an observer. Additionally, the fusion must not result in distortions or other "false" information appearing in the fused image. The concept of visible differences can be used effectively in fusion performance evaluation through: i) detection of changes in the appearance of visual information transferred (fused) from the input into the fused image and ii) detection of fusion artefacts appearing in the fused image but not being present in the inputs. In this context, VD relationships are defined between each of the input images and the output fused image (differences that exist between inputs are caused by the physical processes of image acquisition and not by the fusion process). Fig. 2 illustrates these relationships on a real image fusion example where two multisensor images (A and B) are fused to produce image F. Probability of visible differences maps between A and B, and F: PAF and PBF (middle column) show white where the probability of a difference being detected is high. They clearly highlight the effects of the information fusion process: areas taken from A are light in PAF and dark in PBF and vice versa. 3.1. Visible Difference Fusion Performance Measures The VDP-maps PAF and PBF can be used directly to evaluate fusion. A simple measure of fusion performance is the average probability of noticing a difference between the inputs and the fused image. If the fusion process is successful, input image information will be faithfully represented in the fused image resulting in a small probability that observers will notice differences. Fusion systems that produce BF low PmAF ,n and Pm ,n values therefore perform well. Thus a VD fusion metric VDF∈[0,1] with 1 being ideal fusion and 0 being the “worst” possible fusion performance is defined for an M×N image in equation (1):
VDF = 1 −
1 PmAF,n + PmBF,n . ∑∑ 2MN m n
(1)
Now, image fusion is a data reduction process and lossless overlay of visual information is almost impossible in practice. In recognition of this fact many fusion algorithms rely on some form of spatial feature selection to resolve the problem of superposition by choosing to faithfully represent, at every location only one of the input images. In terms of visible differences, one would expect that at any one location a successfully fused image is similar to at least one of the inputs, resulting in one of the BF PmAF ,n , Pm ,n values being small. Accordingly, a VDmin∈[0,1] metric is formulated as:
VD min = 1 −
1 ∑∑ min(PmAF,n , PmBF,n ) . MN m n
(2)
Fig. 2. Visible differences between two input images and the fused image
Finally, if one is to consider the fact that during subjective fusion evaluation trials the observers’ attention is captured by only the most significant differences between the input and fused images, there is a rationale to restrict the measurement to such areas BF only. Applying a visual detection threshold Td to PmAF ,n and Pm ,n simulates such behaviour and a Visible Differences Area (VDA) metric can be defined which employs only those input image locations that exhibit significant changes between the input and fused images, equation (3). Td effectively determines the probability level at which image differences are likely to be noticed and thus effect perceived fusion performance. Again, VDA∈[0,1], while all three metric scores for the fusion example in Fig.2 are VF= 0.12, VDmin= 0.23 and VDA= 0.31.
VDA = 1 −
1 ∑∑ (PmAF,n + PmBF,n ) AF,BF . 2MN m n ∀m , n , Pm , n >Td
(3)
3.2. VD Information in Edge Based Fusion Assessment In addition to the above metrics, the concept of visible differences can be applied to enrich an existing fusion performance evaluation framework. The QAB/F metric [15] evaluates fusion performance by measuring success in preserving input image gradient information in the fused image (see Appendix A). The rationale for combining the VD and QAB/F evaluation approaches lies in the disparate nature of their approaches promising a more comprehensive assessment. Visual differences information is combined with QAB/F in two useful ways: i) VDP maps are used within the QAB/F frame-
work in a hybrid QVD metric and ii) both types of metric are independently evaluated and combined a-posteriori. VDP takes into account a whole host of factors that influence attention distribution and the HVS and is introduced into a hybrid QVD metric by defining the relative importance of each pixel in the input images as PAFwA and PBFwB instead of simply wA and wB, equation (8). In this manner more importance is assigned to locations that are generally salient (high wA) and exhibit significant changes between the fused and input images (high PAF). Consequently fusion performance at these locations has more influence on the final fusion performance score. The other, more ad hoc, alternative is a simple linear combination (VD+Q) of independently evaluated VD and QAB/F metrics through a weighted sum, equation (4) MVD∈{VDF, VDmin, VDA}. Coefficient b∈[0,1] determines the relative emphasis of the two metrics on the final score. A higher value of b indicates that gradient information (QAB/F) dominates the visual information fusion assessment process.
Q = bQ AB / F + (1 − b)M VD .
(4)
4. Results The aim of the proposed objective fusion performance metrics is subjective relevance, the highest possible level of correspondence with subjective performance scores. This is examined using results of eight different subjective fusion assessment tests [5,15]. In the tests, groups of images (two inputs and two different fused images), Fig. 3, were shown to test participants (observers) who scrutinised them and decided which of the two fused images, if any, better represents the input scene. Subject votes were aggregated and a preference score∈{0,1} evaluated for each of the fused images (or equal preference). In all, subjective preferences for 120 different fused image pairs of various scenes (Figs 2,3 and 6), fused using 9 different schemes were recorded. Audiences of both expert and non-expert viewers performed the tests in controlled standard conditions [6,7-11,16]. A perceptually (subjectively) relevant fusion performance metric should be able to predict, with reasonable accuracy, the subjects’ preference.
Fig. 3. Input images, a and b, and two different fused images c and d
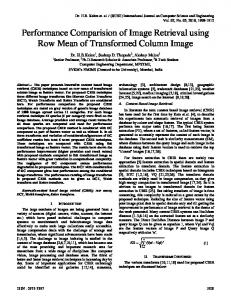
4.1 Subjective-Objective Correspondence Evaluation In order to measure the subjective relevance of the proposed metrics, fusion performance was evaluated for each fused image used in the tests with each metric. An objective preference was then recorded for the fused image with the higher score in each pair or, if the scores were within 1.5% of each other, an equal preference was recorded. Although similarity of 1.5% seems small, it was found to be sufficient due to the limited practical range of the values produced by the metrics [15]. From subjective and objective preference scores two distinct correspondence measures can be evaluated. The Correct Ranking (CR) measure is the proportion of all image pairs in which the subjective and objective ranking of offered fused images correspond. A value close to 1 (or 100%) is desirable while the minimum is the random guess rate for 3 options of 33%. The relevance measure (r) takes into account the relative certainty of the subjective scores. When the subjects are unanimous in their choice, subjective preference is 1 and so is the certainty. Alternatively, when each option receives an equal number of votes, the subjective preferences and certainty are 0.33. Relevance r is thus, the sum of subjective preferences of all the images with a higher objective metric score in each pair. The sum is further normalised to a range [0,1] between the smallest and largest possible relevance scores given by the subjective test results. An r of 1 therefore means that the metric predicted the subject’s preferred choice in all image pairs. Globally, compared to CR, relevance r places more emphasis on cases where subjects are more unanimous. 4.2 Objective Metric Optimisation Prior to testing, the VDA and VD+Q metrics were optimised with respect to the visual detection threshold Td and the linear combination factor b respectively. The disparity of the types of images (120 input pairs) used further ensure that the optimisation process does not reach a local minima fit for a particular image type or content but a truly global optimum that is applicable to any type of input data. This optimisation process, besides determining an optimal operating point for each metric, provides a useful insight into the nature and robustness of the proposed metrics but also the behaviour and criteria used by subjects during fusion evaluation trials. The performance of VDA (in terms of r and CR) for various values of Td is illustrated on Figure 4a. There is a clear trend in performance that improves as the detection threshold increases. For Td>0.9, performance is relatively robust while overall r>0.73 and CR>0.61. For higher values of Td the metric considers progressively smaller areas and at Td=0.95 approximately 43% of the image area is affected by visible changes considered in the evaluation. Practically, this means that subjects form their decisions by considering relatively small proportions of the displayed images. These areas are illustrated on the fusion example from Fig. 3 in Fig. 5. The input images 3a and 3b provide two views of an outdoor scene through a visible and an infrared range sensor and are fused into two further different versions of the scene 3c and 3d. Image 3c suffers from reduced contrast and significant fusion artifacts while image 3d provides a much clearer view of the scene. Appropriately, image 3d results in fewer visible
differences (white pixels) compared to both inputs (Fig.5c and d). A high level of relevance (r) for this value of Td (0.95) also indicates that the highlighted areas correspond to the areas of importance when subjects evaluate fusion.
Fig. 4. Optimisation performance VDA a) and Q+VD metrics b)
Fig. 5. VDPs between images 3a, 3b and 3c (a and b) and 3a, 3b and 3d (c and d)
Optimisation of the linear combination metrics, VDF+Q, VDmin+Q and VDA+Q, with respect to coefficient b is illustrated in Fig. 4b. All three metrics have a peak in performance at b ≈ 0.7. This indicates a greater influence of the QAB/F metric and thus the appearance of gradient information in the fused image makes over general differences in the signal values they may detect. 4.3 Objective Metric Results The proposed objective metrics, as well as reference metrics QAB/F [15] and mutual information metric (QZY) of Qu et. al. [12] were tested/compared against the described set of subjective test results and yield results quoted in Table 1. The VDF and VDmin metrics achieve respectable levels of success with r of 0.74 and 0.736 and CR of 61.6% and 60.8% respectively, on a par with the QZY mutual information metric. The VDA metric on the other hand performs better (r=0.795 and CR=66.7%) proving the hypothesis that the subjects consider only sections, and not the whole of the displayed images (as in VDF and VDmin) in deciding which of the offered fused images represents better the input information.
From Table 1 it is also obvious that a purely VD evaluation approach in these three metrics gives no improvement over the gradient based QAB/F method. At best (VDA) VD metrics correctly rank in 80 out of the 120 fused image pairs (CR=66.7%) while QAB/F achieves 87. Performance is improved however, when the two approaches are combined. The hybrid QVD metric performs significantly better then the purely VD metrics and as well as QAB/F (r=0.829, CR=72.5%). The best performance however, is achieved using a linear combination of the two evaluation approaches. All three linearly combined metrics, VDF+Q, VDmin+Q and VDA+Q, improve on the QAB/F and QVD. VDF+Q is the best, correctly ranking 91 of the 120 pairs (CR=75.8%) and achieving a relevance of r=0.869. Table 1. Subjective correspondence of different image fusion performance metrics Metric r
VDP
VDmin
VDA
0.740
0.736
0.795
CR 61.6%
60.8%
66.7%
QVD 0.829 72.5%
VDmin + Q VDP+ Q VDA+ Q QAB/F
QZY
0.855
0.869
0.868
0.833
0.742
75.0%
75.8%
75.8%
72.5%
62.5%
Example metric scores of the fusion example in Fig.3 are given in Table 2. Individual metric scores for the two fused images are given in Table 2. For this particular image pair, 27 out of the 28 subjects that took part in the tests opted for the image 3d. All the VD and combined metrics successfully predict this result by scoring higher for the image 3d. The exception is the QZY metric [12], based on a mutual information approach that considers histograms rather than actual image features and scores higher for image 3c. Another example, showing the case where fused images do not differ so significantly is in Figure 6. Subjects opted 9 to 4 for the fused image 6c as opposed to 6d with 2 indicating equal preference. The reason is fusion artefacts that appear as shadowing effects in image 6d and generally lower contrast compared to 6c. These effects are especially noticeable in the channel between the island and the peninsula. While VDPs between the fused images and input 6b, 6g and 6h, lend no useful information to differentiate between them, the effects of fusion artifacts are clearly visible on the VDP image between the fused image 6d and input 6a, see 6f, as white blotches indicating areas where differences are visible. In comparison the VDPs between fused image 6c and input 6a see 6e, exhibit no such effects. In terms of the numerical fusion performance scores all the metrics agree with the subjects in this case, see Table 2. Table 2. Fusion performance with different metrics for fused images in Figs 3 and 6 VDmin+ Q VDF+Q VDA+Q
Fused Image
VDF
VDmin
VDA
QVD
3c 3d
0.16 0.31
0.27 0.50
0.40 0.64
0.53 0.68
0.42 0.57
0.39 0.51
6c 6d
0.43 0.36
0.82 0.68
0.57 0.48
0.77 0.73
0.78 0.71
0.66 0.61
QZY
QAB/F
0.49 0.63
1.03 0.76
0.49 0.60
0.69 0.65
1.79 1.27
0.76 0.72
Fig. 6. Input images a and b, fused images c and d, and visible differences between c, d and a: e and f; c, d and b: g and f
The results shown in Table 1 and Table 2 indicate that the VD approach to image fusion assessment has validity. Although the accuracy of the VD metrics is only reasonable, good scores of the hybrid QVD metric prove the usefulness of the VD information in highlighting the areas of interest to subjects during fusion assessment. The success of its compound importance evaluation algorithm indicates that subjects’ attention distribution is guided by saliency in the displayed signal as well as the perceived differences in visual features that should be identical (in input and fused images). Equally, the improved performance of QVD with respect to the purely VD metrics indicates that absolute probabilities of detection of visible differences present a poorer measure of perceived information loss to the gradient approach used in QAB/F and QVD. Further justification for this view is the optimal operating point of the linearly combined metrics at b≈0.7, which indicates that the underlying QAB/F framework still provides for the majority of discrimination. At the same time, the VD information provides an essential ingredient to making the overall fusion evaluation more accurate. Furthermore, linear combination measures are more robust than the individual VD or QAB/F metrics in terms of the sensitivity to parameter values and input data types.
5. Conclusions This paper presented an investigation into the use of Visible Differences information in the objective assessment of image fusion performance. A Visible Differences Predictor was employed, on a pixel-by-pixel basis, to determine the probability that a human observer would notice a difference between the fused and each of the input images. Such probability maps were then integrated into an existing fusion evaluation framework or were used to form independent fusion performance metrics. Finally, the
proposed metrics were tested against results obtained from real subjective fusion evaluation trials. It was found that pure VD metrics achieve respectable performance but do not improve on the best existing fusion evaluation algorithm. Hybrid measures that use both the VD and gradient evaluation approaches simultaneously however outperform all existing metrics. Such results clearly warrant further development of this ‘hybrid’ evaluation technology not only in the field of image fusion evaluation but also the more general field of image quality assessment. In the context of image fusion, the proven usefulness and dispersed nature of the VD information provides an exciting opportunity for exploration of the next step of fusion evaluation, which would itself provide a much deeper insight into different aspects of the image information fusion process, that of fusion performance characterisation.
References 1. Z Zhang, R Blum, “A Categorization of Multiscale-Decomposition-Based Image Fusion Schemes with a Performance Study for a Digital Camera Application”, Proceedings of the IEEE, Vol. 87(8), 1999, pp1315-1326 2. O Rockinger, T Fechner, "Pixel-Level Image Fusion: The Case of Image Sequences", Proc. SPIE, Vol. 3374, 1998, pp 378-388 3. H Li, B Munjanath, S Mitra, "Multisensor Image Fusion Using the Wavelet Transform", Graphical Models and Image Proc., Vol. 57(3), 1995, pp 235-245 4. Y Chibani, A Houacine, "Multiscale versus Multiresolution Analysis for Multisensor Image Fusion", Proc. Eusipco98, Rhodes, 1998 5. V Petrović, C Xydeas, “Computationally Efficient Pixel-level Image Fusion”, Proceedings of Eurofusion99, Stratford-upon-Avon, October 1999, pp 177-184 6. A Toet, N Schoumans, J Ijspeert, “Perceptual Evaluation of Different Nighttime Imaging Modalities”, Proc. Fusion2000, Paris, 2000, pp TuD3-17 – TuD3-23 7. A Toet, JK Ijspeert, “Perceptual evaluation of different image fusion schemes”, Proc. SPIE, 2001, pp 436-441 8. P Steele, P Perconti, "Part task investigation of multispectral image fusion using gray scale and synthetic color night vision sensor imagery for helicopter pilotage", Proc. SPIE, Vol. 3062, 1997, pp 88-100 9. R Sims, M Phillips, "Target signature consistency of image data fusion alternatives", Optical Engineering, Vol. 36(3), 1997, pp 743-754 10.M Ulug, C McCullough, “A quantitative metric for comparison of night vision fusion algorithms”, Proc. SPIE, Vol. 4051, 2000, pp 80-88 11.W Handee, P Wells, “The Perception of Visual Information”, Springer, New York, 1997 12.G Qu, D Zhang, P Yan, “Information measure for performance of image fusion”, Electronic Letters, Vol. 38(7), pp 313-315 13.F Chin, “Objective Image Quality Assessment and Spatial Adaptive JPEG Image Coding”, MPhil thesis, University of Lancaster, April, 2002 14.S Daly, “The visible differences predictor: an algorithm for the assessment of image fidelity”, in Digital images and human vision, MIT Press, Cambridge, MA, 1993 15.C Xydeas, V Petrović, “Objective Image Fusion Performance Measure”, Electronics Letters, Vol. 36, No.4, February 2000, pp 308-309 16.ITU-R BT.500-10: “Methodology for the subjective assessment of the quality of
television pictures”, 1974-2000, ITU Radiocommunication Assembly
Appendix: Gradient Based Fusion Performance Objective image fusion performance metric QAB/F [15] associates important visual information with gradient information and assesses fusion by evaluating the success of gradient information transfer from the inputs to the fused image. Fusion algorithms that transfer more input gradient information into the fused image more accurately are said to perform better. Specifically, assuming two input images A and B and a resulting fused image F, a Sobel edge operator is applied to yield the strength g(n,m) and orientation α(n,m) (∈[0,π]) information for each input and fused image pixel. Using these parameters, relative strength and orientation “change” factors G and A, between each input and the fused image, are derived, e.g.:
G AF m ,n
g F ( m, n ) g ( m, n ) , = A g A ( m, n ) , g F (m, n )
A mAF,n =
g A ( m, n ) > g F ( m, n ) . otherwise
if
α A ( m, n ) − α F ( m, n ) − π / 2 π /2
(5)
(6)
.
These factors are the basis of the edge information preservation measure QAF obtained by sigmoidal mapping of strength and orientation change factors. This quantity models the perceptual loss of input information in the fused image and constants Γg, κg, σ g and Γα, κα, σα determine the exact shape of the sigmoid mappings:
Q AF m ,n =
Γg Γα (1 + e
κ g ( G AF −σ g )
)(1 + e
(7) κ g ( G AF −σ g )
)
.
Total fusion performance QAB/F is evaluated as a weighted sum of edge information preservation values for both input images QAF and QBF where the weights factors wA and wB represent perceptual importance of each input image pixel. The range is 0 ≤ QAB/F ≤ 1, where 0 means complete loss of input information has occurred and QAB/F=1 indicates “ideal fusion” with no loss of input information. In their simplest form, the perceptual weights wA and wB take the values of the corresponding gradient strength parameters gA and gB.
∑ ∑ Q = ∑ ∑ M
Q
AB / F
m =1
N
n =1 M m =1
AF m ,n
B w Am ,n + Q AF m ,n w m ,n
N
w mA ,n + w Bm ,n
n =1
(8) .