This article appeared in a journal published by Elsevier. The attached copy is furnished to the author for internal non-commercial research and education use, including for instruction at the authors institution and sharing with colleagues. Other uses, including reproduction and distribution, or selling or licensing copies, or posting to personal, institutional or third party websites are prohibited. In most cases authors are permitted to post their version of the article (e.g. in Word or Tex form) to their personal website or institutional repository. Authors requiring further information regarding Elsevier’s archiving and manuscript policies are encouraged to visit: http://www.elsevier.com/copyright
Author's personal copy Remote Sensing of Environment 112 (2008) 2999–3011
Contents lists available at ScienceDirect
Remote Sensing of Environment j o u r n a l h o m e p a g e : w w w. e l s e v i e r. c o m / l o c a t e / r s e
Evaluation of Random Forest and Adaboost tree-based ensemble classification and spectral band selection for ecotope mapping using airborne hyperspectral imagery Jonathan Cheung-Wai Chan a,⁎, Desiré Paelinckx b a b
Geography Department, Vrije Universiteit Brussel, Pleinlaan 2, 1050 Brussels, Belgium Research Institute for Nature and Forest (INBO), Kliniekstraat 25, 1070 Brussels, Belgium
a r t i c l e
i n f o
Article history: Received 1 March 2007 Received in revised form 14 February 2008 Accepted 17 February 2008 Keywords: Ecotope mapping Ensemble classification Adaboost Random Forest Airborne hyperspectral Band selection
a b s t r a c t Detailed land use/land cover classification at ecotope level is important for environmental evaluation. In this study, we investigate the possibility of using airborne hyperspectral imagery for the classification of ecotopes. In particular, we assess two tree-based ensemble classification algorithms: Adaboost and Random Forest, based on standard classification accuracy, training time and classification stability. Our results show that Adaboost and Random Forest attain almost the same overall accuracy (close to 70%) with less than 1% difference, and both outperform a neural network classifier (63.7%). Random Forest, however, is faster in training and more stable. Both ensemble classifiers are considered effective in dealing with hyperspectral data. Furthermore, two feature selection methods, the out-of-bag strategy and a wrapper approach feature subset selection using the best-first search method are applied. A majority of bands chosen by both methods concentrate between 1.4 and 1.8 μm at the early shortwave infrared region. Our band subset analyses also include the 22 optimal bands between 0.4 and 2.5 μm suggested in Thenkabail et al. [Thenkabail, P.S., Enclona, E.A., Ashton, M.S., and Van Der Meer, B. (2004). Accuracy assessments of hyperspectral waveband performance for vegetation analysis applications. Remote Sensing of Environment, 91, 354–376.] due to similarity of the target classes. All of the three band subsets considered in this study work well with both classifiers as in most cases the overall accuracy dropped only by less than 1%. A subset of 53 bands is created by combining all feature subsets and comparing to using the entire set the overall accuracy is the same with Adaboost, and with Random Forest, a 0.2% improvement. The strategy to use a basket of band selection methods works better. Ecotopes belonging to the tree classes are in general classified better than the grass classes. Small adaptations of the classification scheme are recommended to improve the applicability of remote sensing method for detailed ecotope mapping. © 2008 Elsevier Inc. All rights reserved.
1. Introduction Land use/land cover classification is a generic tool for environmental monitoring. To measure subtle changes in the ecosystem, a land use/land cover classification at ecotope level with definitive biological and ecological characteristics is needed. Ecotopes are distinct ecological landscape features that provide information concerning biodiversity and environmental quality. In order to have adequate reference to the large variety of ecological conditions, the classification scheme of ecotopes is usually detailed and elaborate. While for decades remote sensing imagery has been used to generate land use/land cover maps, it will be a challenge to map ecotopes using conventional broadband multi-spectral data with coarse spatial resolution (Ellis et al., 2006). A better option will be hyperspectral images which provide a fuller spectral description with up to hundreds of narrow bands. Hyperspectral data are reportedly ⁎ Corresponding author. Tel.: +32 2629 3556; fax: +32 2629 3378. E-mail addresses:
[email protected],
[email protected] (J.C.-W. Chan). 0034-4257/$ – see front matter © 2008 Elsevier Inc. All rights reserved. doi:10.1016/j.rse.2008.02.011
competent in achieving substantially higher classification accuracies in the recognition of vegetation and agricultural crops (Bork et al., 1999, Thenkabail et al., 2004), and might have the potential to separate vegetation into taxonomic levels (Ustin et al., 2004). To classify ecotopes using hyperspectral data, however, we are faced with a classical problem of high dimensional inputs (hundred of bands) and outputs (many classes). For this complex problem, we need powerful algorithms for the classification and band selection methods that can reduce input dimension. Recent studies on difficult classification problems using multi-source and hyperspectral data have pointed to the superiority of Random Forest, a type of ensemble classification that uses decision tree as the base classifier (Crawford et al., 2003; Gislason et al., 2006; Ham et al., 2005, Lawrence et al., 2006). Ensemble classification represents a new approach that uses not one, but many classifiers. Hundreds of classifiers are built and their decisions combined usually by plurality vote. The premise is that combining ensemble classifiers is often more accurate than any one from the ensemble. Ensemble classifications can be categorized into those based on several different learning algorithms and those based on just one. In the former case, several classifiers can be
Author's personal copy 3000
J.C.-W. Chan, D. Paelinckx / Remote Sensing of Environment 112 (2008) 2999–3011
generated using the same training set, each from a different learning algorithm and their decisions are combined by simple voting, or more sophisticated methods like consensus theory (Benediktsson & Swain, 1992) and stacking (Džeroski & Ženko, 2004). The drawback of this ensemble method is to have to handle different learning algorithms and that increases the complexity of processing. Combining methods can sometimes be complicated too. Finally, its effectiveness relies very much on the combining technique and an ensemble does not always give a more accurate classification (Foody et al., 2007). Another form of ensemble classification based on only one learning algorithm and the ensemble is created by changing the training set. Bagging (Breiman,1996), or bootstrap aggregating, and Adaboost (Freund & Schapire, 1996), or adaptive reweighting boosting, are two popular methods to generate new training sets. Both methods have been thoroughly studied (Bauer & Kohavi, 1998; Dietterich, 2000) and have been assessed with remote sensing data (Chan et al., 2001; DeFries & Chan, 2000; Pal & Mather, 2003). While theoretically Adaboost and bagging can be applied to any learning algorithms, they are originally designed to boost the accuracy of “weak” learners such as decision trees (Breiman, 2001). Implementations of Adaboost using decision trees as the base classifier showed that the results are comparable to support vector machines (Chan et al., 2001) and a neural network (Pal & Mather, 2003). Comparisons between bagging and Adaboost showed that Adaboost had higher accuracies but bagging was more stable (Chan et al., 2001; DeFries & Chan, 2000). But Adaboost was also described as susceptible to noise and more costly in processing time (Briem et al., 2002). Random Forest is a tree-based ensemble classifier that uses the bagging technique to create new training sets. It includes two important methods: random feature subspace and out-of-bag estimates. The former enables a much faster construction of trees and the latter the possibility of evaluating the relative importance of each input feature. Breiman (2001) ran Random Forest on 20 data sets from different data domains, and his results showed that the performance of Random Forest is superior to other learning algorithms. When compared with Adaboost, he concluded that Random Forest is “favorably” comparable, only that Random Forest is cheaper in terms of computing time. Ensemble classifications that build numerous classifiers are not an intuitive choice for analyses of hyperspectral data since they naturally add more computational burden to a procedure already complicated by high dimensional inputs. However, since decision trees are extremely fast to build, the costs of training hundreds of them will still be cheaper than training one artificial neural network, as demonstrated in Pal and Mather (2003). While Random Forest, a tree-based ensemble classifier, has been shown effective when applied to classification of hyperspectral data (Crawford et al., 2003; Ham et al., 2005; Lawrence et al., 2006), there has not been adequate discussion on Adaboost. Hence, it is natural to explore more about the potential of these two powerful algorithms in our specific application. While hyperspectral data provides more spectral information, it also brings new challenges such as the curse of dimensionality. Since neighboring hyperspectral channels carry highly correlated information, some spectral bands are redundant and some contain possible noise. The importance of feature (band) selection is not only to reduce input dimensionality which will subsequently alleviate processing burden, but also to deepen our understanding of which spectral ranges are most suitable for ecotope mapping. This knowledge of the best wavebands might also aid future sensor designs dedicated for specific applications. Many methods have been proposed for band selection (Chang et al., 1999; Guo et al., 2006; Jia & Richards, 1994; Kaewpijit et al., 2003, Lee & Landgrebe, 1997; Melgani & Bruzzone, 2004) but some suggested using a basket of different methods instead of using one method. In Bajcsy and Groves (2004), seven techniques for band ranking were included in their regression model for soil electrical conductivity. In Thenkabail et al. (2004), four assessment techniques namely principal component analysis, lambda–lambda R2 models, stepwise discriminant analysis, and derivative greenness vegetation
indices were employed to find the optimal wavebands for the classification of vegetation. The reason for using a basket of methods is attributed to the no-free-lunch theorem which argues against the possibility of a universally superior algorithm for all problems. This echoes with a machine learning concept that for any specific problems, as many techniques and algorithms should be investigated as manageably possible because there is no one method which has been demonstrated to be superior for all problems (Kohavi et al., 1996). In this paper, we assess two benchmark tree-based ensemble classification algorithms: Adaboost and Random Forest, using the criteria of standard classification accuracy, computing time and stability (DeFries & Chan, 2000). Two band selection algorithms are tested: the out-of-bag method (Breiman, 2001) and a wrapper approach feature subset selection (Kohavi & John, 1997) using the best-first search method (Ginsberg, 1993). In Thenkabail et al. (2004), hyperspectral data were gathered for shrubs, grasses, weeds, and agricultural crop species from four ecoregions of African savannas; after rigorous investigation with four assessment methods, they recommended 22 optimal bands. Due to the similarities of the target classes and the studied spectral range (0.4–2.5 μm) between Thenkabail et al.'s (2004) study and ours, we think there are reference values to investigate the optimal bands suggested in their article. Following the no-free-lunch theorem, we combine Thenkabail's selection with the outcomes from the other two band selection methods. All band subset selections are tested using both Adaboost and Random Forest. 2. Study area and data For this study, we have used the ecotope classification in Belgium, locally known as the Biological Valuation Map (BVM), as a case study (see www.inbo.be/bvm). Under the BVM, the entire land surface is divided into 162 detailed classes according to soil conditions or agricultural practices. The BVM is produced by field surveys. Experts including biologists, agronomists and forest ecologists are sent to the field and visually identify features that are ecologically distinct. The map produced by the experts is treated as the groundtruth without further accuracy assessment. Using four criteria namely rarity, vulnerability, naturalness, and replaceability, each BVM class is assigned a qualitative biological value: very high biotic value, high biotic value and little biotic value (De Blust et al., 1994). This information is important to assess the state of the environment. Our study area is situated east of the town Geraardsbergen in the province of EastFlanders within the so called “South Flemish loamy hill district” of Belgium (Fig. 1). The valley of the river Dender crosses the northern part. Species rich improved grasslands dominate this valley, but also semi-natural grasslands (called Calthion-grasslands), poplar plantations, alluvial and oak forests are present. The central and southern parts are also crossed by some other small valleys of rivulets and wet depressions dominated by the same type of vegetation. The forests area in the central part (the Moerbeke forests area) consists mostly of oak forests, and the rest belongs to those of beech forests and woodland of alluvial soils. The interfluves mostly consist of arable land, with a few of species poor to species rich improved grasslands. The area is particularly suitable for our study because of a recent and detailed survey done by only one field researcher. This leads to a high level of uniformity of the mapping. An adapted classification scheme with thirty-two classes was used (Wils et al., 2004). To allow a more realistic assessment of the classification on vegetation types, water surface and built-up areas (houses and roads) which are known to be spectrally distinct from vegetation were masked out in our experiments. Sixteen classes were found to be present in our study area (Table 1). The tree classes include scrubs, orchard and woods. The grassland classes represent different degrees of species richness. Higher biological values are attached to grassland types that are comparatively richer in species. From high to
Author's personal copy J.C.-W. Chan, D. Paelinckx / Remote Sensing of Environment 112 (2008) 2999–3011
3001
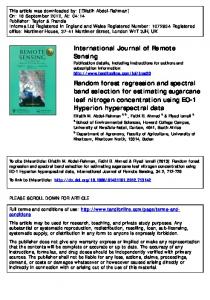
Fig. 1. Study area. The background is an abstracted draft Biological Valuation Map covering the entire Flanders in Belgium. Ecotopes are assigned different degrees of biological values. Locations of medium to high biological values are in green. White color represents less biological values and red areas are important for rare animal species (this layer is still under construction). The zoom shows the coverage of the airborne HyMap image.
low biological values, the grassland classes rank in the following order: semi-natural grasslands (hpgh), species rich improved grassland (hpgs), grasslands with patches hp and either patches hpgs or hpgh (hpv), species poor improved grassland (hp) and grass monocultures (hx). Airborne HyMap data was acquired on 8th June, 2004. Pixel size is 4 × 4 m with 126 bands distributed between 0.4 and 2.5 μm. A level 2 product was generated after radiometric correction, geometric correction (ortho-rectified using bilinear resampling), atmospheric correction and calibration. The image is geo-referenced in UTM with WGS-84 Geodetic datum. Fig. 2 shows the overlay of the ecotope classes over the airborne HyMap data. The dimension of the two mosaic strips is 953 × 2330 pixels covering an area of approximately 35.5 km2. Field works were carried out during the day of the overpass and the day after. A spectroradiometer ASD Fieldspec Pro FR (350 nm– 2500 nm) was used for ground measurements. Those measurements were gathered to calibrate the airborne data as well as to assess the data quality. To prepare the training and validation samples, the groundtruth vector layer was first filtered by excluding the following land covers: fallowed land, built-up area and water surface. Then, samples were extracted manually and randomly divided into two equal halves for training and validation (Table 2). The mean spectrum of the grassland and the tree classes are presented in Fig. 3a and b, respectively. The spectral profiles are artificially linked at the absorption regions around 1.35–1.4 μm and 1.8–1.95 μm, hence the strange shapes. 3. Methods In this section, we recapture some important properties of the ensemble classification algorithms and band selection methods. But first we will briefly describe the basic attributes of a decision tree classifier. By applying certain statistical measures, a decision tree
recursively partitions the training data into more homogenous subsets. A decision tree is composed of nodes at different levels: a root node, a set of internal nodes (splits) and a set of terminal nodes (leaves) (Fig. 4). The root node is formed from all of the training samples. After a selected statistical measure is applied, the training samples are split into two descendent nodes. The same procedure is
Table 1 Description of the ecotope classes ID
Category
Class code
Definitions
1 2
grassland grassland
b hp
3 4
grassland grassland
hpgh hpgs
5
grassland
hpv
6
grassland
hx
7 8
tree/tall_veg tree/tall_veg
f gml
9 10 11 12 13
tree/tall_veg tree/tall_veg tree/tall_veg tree/tall_veg tree/tall_veg
kj kl lh p q
14
tree/tall_veg
sc
15 16
tree/tall_veg tree/tall_veg
sp v
Arable land Species poor improved grassland (normally more homogenous for the whole parcel) Semi-natural grassland Species rich improved grassland (between hpgh and hp) Grassland with patches hp and either patches hpgs or hpgh Grass monocultures (equal to arable land sown with grasses of one or more years) Deciduous forest, dominated by beech (Fagus sp.) Plantation of deciduous tree species other than beech, oak, alder and poplar Tall tree orchard Low tree orchard Poplar plantation Conifer plantation Deciduous forest, dominated by oak trees (Quercus sp.) Scrubs of clearings and scrubs on abandoned land Thorn ticket Woodland of alluvial soil, fens and bogs (mostly dominated by alder = Alnus sp.)
Author's personal copy 3002
J.C.-W. Chan, D. Paelinckx / Remote Sensing of Environment 112 (2008) 2999–3011
sifier is also non-parametric, so there is no requirement on data distribution. The structure of the tree provides information about which of the input bands have been used for classification. This helps us to understand which bands are more important for our applications. However, decision trees are considered as ‘weak’ learners meaning it is not the most accurate classification algorithm. Next we introduce the two benchmark ensemble algorithms that are used for boosting the accuracy of decision trees. 3.1. Random Forest and Adaboost
Fig. 2. Overlay of the recently updated Biological Valuation Map on top of the HyMap image at the area of Dender.
then applied to the descendent nodes. This sequential applications of the measure will form a tree-structured decision space with the terminal nodes representing the assignment of classes. An unknown pixel can be labeled by following the decision framework and is assigned to the class the same as the leaf node which it finally falls into. Different approaches can be used for tree construction. The more frequently used measures include the gini index (Breiman et al., 1984), the information gain ratio (Quinlan, 1993) and the chi-square measure (Mingers, 1989a). These measures dictate how the data is split at each node and also find the best thresholds for the splits. Furthermore, at each node, the split can be based on either several bands or just only one band. The tree is multivariate if each split is based on several bands, or univariate if each split uses only one band. Multivariate trees can have better performance when decision boundaries are better described by a combination of features (bands), but they also introduce complexity in calculations (Friedl & Brodley, 1997). In this study, a univariate decision tree is used. Finally, a key element in tree construction is to correct overfitting by pruning back the tree. Since the tree is grown in a way such that all the training data are correctly classified, if there are errors in the training set, an overfitting tree will lead to poor performance in classifying data not used in the training. Pruning can be done according to certain cost-complexity measures which allow a split only if the contribution to accuracy improvement has reached a predefined threshold. Some common pruning methods are discussed in Quinlan (1987) and Mingers (1989b). As this paper focuses more on ensemble classification, we refer the reader who is interested in more detailed explanation about the construction of decision trees to Pal and Mather (2003), Friedl and Brodley (1997), or Quinlan (1993). Decision tree classifiers have many advantages. Unlike most of the conventional classifiers which derive a complex membership decision using all the input bands at once, decision trees modulate a classification problem into a hierarchy of simple decisions with each decision based on only one or several of the input bands. This strategy makes the computing burden particularly light. A decision tree clas-
In Random Forest, the method to build an ensemble of classifiers is to change the training set using the same strategy as bagging (Breiman, 1996). Bagging creates new training sets by resampling from the original data set n times, n being the number of samples in the original training set, randomly with replacement. This means the sample just being chosen will not be removed from the data set in the next draw. Hence, some of the training samples will be chosen more than once while some others will not be chosen at all in a new set. Bagging helps classification accuracy by decreasing the variance of the classification errors. In another words, it taps on the instability of a classifier. ‘Instability’ of a classifier means that a small change in the training samples will result in comparatively big changes in accuracy. The classifiers are combined by a majority vote and the vote of each classifier carries the same weight. In the case of a tie, the decision can be made randomly or by prescribed rules. Random Forest creates multiple trees using the impurity gini index (Breiman et al., 1984). However, when constructing a tree, Random Forest searches for only a random subset of the input features (bands) at each splitting node and the tree is allowed to grow fully without pruning. Since only a portion of the input features is used and no pruning, the computational load of Random Forest is comparatively pffiffiffiffi ffi light. The computing time is in the order of T MNlogðN Þ where T is the number of trees, M is the number of bands used in each split, and N is the number of training samples (Breiman, 2001). In addition, in case a separate test set is not available, an out-of-bag method can be used. For each new training set that is generated, one-third of the samples are randomly left out, called the out-of-bag (OOB) samples. The remaining (in-the-bag) samples are used for building a tree. For accuracy estimation, votes for each sample are counted every time when it belongs to OOB samples. A majority vote will determine the final label. Only approximately one-third of the trees built will vote for each case. These OOB error estimates are unbiased in many tests (Breiman, 2001). The number of features for each split has to be defined by the user, but it is insensitive to the algorithm. Majority vote is used to combine the
Table 2 Number of samples in training and testing ID
Classes
1 2 3 4 5 6 7 8 9 10 11 12 13 14 15 16
b hp hpgh hpgs hpv hx f gml kj kl lh p q sc sp v Total
Number of training
Number of testing
3712 928 939 6277 910 286 1663 852 369 607 2802 320 4907 675 361 1259 26,867
3711 928 939 6277 909 285 1662 851 369 607 2802 319 4906 675 360 1259 26,859
Author's personal copy J.C.-W. Chan, D. Paelinckx / Remote Sensing of Environment 112 (2008) 2999–3011
3003
Fig. 3. Mean spectrum of the (a) six grassland classes and (b) ten tree classes.
decisions of the ensemble classifiers. For a full detail of Random Forest, the reader is referred to the manual (http://oz.berkeley.edu/~breiman/ RandomForests/cc_home.htm) or Breiman (2001). A very good summary can also be found in Gislason et al. (2006). Adaboost (Freund & Schapire, 1996) changes the distribution of the original training set in a different manner. If εt is the misclassification rate at trial t, then the weights of misclassified samples in the training set will be changed by the factor βt = (1 − εt) / εt. The total sum of the adjusted weights is normalized to 1. The classifiers C1,…,Ct are combined according to the weighted voting where Ct is weighted by log(βt). The trials will be terminated if εt N 0.5 (which means the classifier's accuracy is worst than a random guess) and trial T is altered to t − 1. If ɛt = 0 (i.e.100% accuracy), then trial T becomes t. In so doing, Adaboost forces the newly constructed ensemble classifiers to focus on ‘harder’ cases. The voting for the final labels is weighted by the accuracy of each classifier. In this study, Adaboost is implemented using C5.0 where the trees are constructed using the information gain ratio (Quinlan, 1993).
3.2. Band selection methods The first method is the OOB method implemented in Random Forest (Breiman, 2001). Though the structure of a decision tree provides information concerning important features, such interpretation is rather impossible for hundreds of trees in an ensemble. One additional feature of Random Forest is its ability to evaluate the importance of each input feature by the internal OOB estimates. To evaluate the importance of each feature (band), the values of the m feature (band) of the OOB samples would be allowed to permute. The perturbed OOB samples will run down on each tree again. The differences in accuracy between the original and the perturbed OOB samples over all the trees grown in the Random Forest are averaged. This number will become the importance score of the m feature (band) and is used as a ranking index. We will use the 25 highest ranking bands from the OOB method. The second band selection method we used is a wrapper method using the best-first search as the search algorithm (Kohavi & John, 1997).
Author's personal copy 3004
J.C.-W. Chan, D. Paelinckx / Remote Sensing of Environment 112 (2008) 2999–3011
Fig. 4. A hypothetical decision tree classifier with three input bands (b1, b2 and b3). At each of the root and internal nodes (splits), a statistical measure is applied. The values a, b, c and d are thresholds for splitting. A data set is subdivided into smaller groups until the terminal nodes (leaves) which contain the class labels (A, B and C). This figure is adapted from Fig. 1 in Friedl and Brodley (1997).
Current feature selection techniques can be classified as either filter approaches or wrapper approaches. A filter approach defines relevancy of features based on the training data alone, and the feature subsets are chosen independently of the learning algorithm. It is like a preprocessing step. Wrapper approaches, however, search for the best feature subset using the learning algorithm as part of the evaluation function. The feature subset with the highest accuracy is selected. Wrapper approaches are reportedly producing superior results than filter approaches (Kohavi & John, 1997). While wrapper approaches are producing better accuracy, it is computationally heavy because it has to call on the learning algorithm for the evaluation of each subset. Hence, a faster search engine is needed. Conventional methods that exhaustively search the entire search space (all feature combinations) are impractical unless the number of feature is small. The best-first search is a method that avoids searching the entire search space (Ginsberg, 1993). The idea of best-first search is to jump to the most promising band subset which is defined as the subset with the highest accuracy. Fig. 5 illustrates the paths of the best-first search algorithm using a scenario with four bands. Each bit within the square brackets shows the presence (1) or absence (0) of a band. For example, [0, 1, 0, 1] represents a subset with the second and the fourth bands. The number next to each bracket is the accuracy of that subset evaluated by the learning algorithm. The search starts with no feature, hence [0, 0, 0, 0]. Then, it proceeds to turn on consecutively each of the four bands. Since the first band attained the highest accuracy (65%), the search continues to expand on its children which represent new subsets that always have the first band present. The same logic applied to the next expansion where adding the fourth band to the first gives the highest accuracy. The search stops when the highest attainable accuracy was achieved. Since it is not always possible to achieve 100% accuracy in reality, the search is stopped when the estimated accuracy no longer improves, and the feature subset at that search state represents the optimal subset. This method has been tested on 18 real-world datasets from the U.C. Irvine machine learning repository in Kohavi and Sommerfield (1995), and 14 datasets in Kohavi and John (1997). Their results showed that for most data sets, the feature subsets increased accuracy. In rare cases, the feature subsets would lower accuracy. When applied in remote sensing data, the method generated a substantially smaller subset but the accuracies were comparable with the entire feature set (Chan et al., 2000). We applied this method using the Feature Subset Selection
routine within the Machine Learning Library in C++ (Kohavi et al., 1996). The search is terminated if the last 5 expansions see no increase of accuracy that is more than 0.001%. 4. Experiments and results We implemented the same procedures for Adaboost and Random Forest. A hundred trees were built and the accuracy snapshots of each additional ten trees were shown. Adaboost was run using C5.0 with a default pruning of 25%. The only parameter with Random Forest is the number of features (bands) used for each split. Following the suggestion in the manual, this parameter was tried from 1 to 12 (square root of the number of input features) to build 10 and 20 trees. The number that has the highest accuracy with the test set is chosen (Table 3). In the case of using all 126 bands, this number is twelve. The accuracy of Adaboost after 99 trials is 69.5%, a 9% increase compared to a single C5.0 tree (60.2%). However, accuracy already reached 69% at 29 trials (Fig. 6). In the case of Random Forest, one tree produced an accuracy of 57.1%, 3% lower than a C5.0 tree. Generating 70 or 90 trees increased the accuracy to 68.6% which is comparable to Adaboost. The accuracies of Random Forest and Adaboost are both higher than conventional classifiers. With the same training and test samples, a
Fig. 5. An example showing the paths of the best-first search in a case with four bands. Zeros and ones within the square brackets represent the absence and the presence, respectively, of each band. Instead of exhaustively looking into all possible combinations, the best-first search jumps to the most promising subset – the subset that has achieved the highest accuracy so far, and expands on their children nodes.
Author's personal copy J.C.-W. Chan, D. Paelinckx / Remote Sensing of Environment 112 (2008) 2999–3011
3005
Table 3 Accuracies for the out-of-bag estimates and the test set with five different band subsets ALL
First-Best
Trees 10
20
Split
Outof-bag acc. (%)
Test set acc. (%)
Outof-bag acc. (%)
1 2 3 4 5 6 7 8 9 10 11 12
72.40 74.40 75.21 76.07 76.44 76.57 76.70 77.19 77.00 77.50 77.20 76.99
65.52 65.72 65.62 65.89 66.43 66.03 66.64 66.62 66.27 66.44 66.53 66.65
77.20 79.01 79.78 80.35 80.70 80.74 81.11 81.55 81.33 81.41 81.30 81.46
10 Test set acc. (%) 67.05 67.38 67.01 67.06 67.57 67.65 67.58 67.71 67.39 67.67 67.63 67.71
Thenkabail 20
10
RF_25 20
Combine_53
10
20
10
20
Outof-bag acc. (%)
Test set acc. (%)
Outof-bag acc. (%)
Test set acc. (%)
Outof-bag acc. (%)
Test set acc. (%)
Outof-bag acc. (%)
Test set acc. (%)
Outof-bag acc. (%)
Test set acc. (%)
Outof-bag acc. (%)
Test set acc. (%)
Outof-bag acc. (%)
Test set acc. (%)
Outof-bag acc. (%)
Test set acc. (%)
74.02 76.07 76.20 76.99 76.85 77.24 77.07 77.13 77.26 77.79 77.73 77.66
63.73 65.64 65.30 65.65 65.87 65.71 65.62 65.38 65.78 65.60 65.63 65.79
78.78 80.22 80.34 80.85 80.93 81.19 81.32 81.42 81.36 81.75 81.62 81.51
65.76 66.85 66.44 66.83 67.29 66.72 66.62 66.46 66.73 66.63 66.43 66.23
73.18 75.16 76.11 76.41 76.66 76.78 77.23 77.06 77.50 77.38 77.63 77.79
66.01 65.76 66.42 66.27 66.27 66.72 66.79 66.93 66.94 66.62 66.75 66.21
78.10 79.65 80.33 80.78 80.88 81.08 67.69 81.39 81.26 81.26 81.45 81.71
67.12 67.07 67.60 67.30 67.64 67.69 67.57 67.87 68.05 68.05 67.82 67.38
71.29 73.15 74.07 74.08 74.45 74.41 74.68 74.79 74.85 74.79 74.68 74.62
65.72 65.39 65.56 65.42 65.62 64.93 64.85 64.70 64.99 64.94 64.60 64.84
76.43 77.84 78.38 78.61 78.96 78.62 78.81 79.19 79.08 79.32 78.77 78.96
67.02 66.73 66.57 66.57 66.71 66.04 66.12 65.80 66.00 66.17 66.01 65.91
73.79 75.50 76.22 76.71 76.85 77.21 77.27 77.37 77.94 77.46 77.62 77.81
65.75 66.53 66.98 66.62 66.51 66.83 66.93 66.46 66.68 67.02 67.01 67.25
78.32 80.08 80.68 81.06 81.42 81.45 81.46 81.49 81.88 81.79 81.80 81.80
67.59 68.03 67.75 67.71 67.44 67.95 68.02 67.86 67.94 68.14 67.82 68.46
The numbers for the splitting is tried from 1 to 12 and 10 and 20 trees are built.
multi-layer perceptron produced 63.7% accuracy and a Spectral Angle Mapper is even lower, under 30%. The selections from the OOB method under the Random Forest, and the wrapper approach with the best-first search algorithm (hereafter we use ‘best-first’ to represent this method) are listed in Table 4. In order to have a comparison of the band distribution of different selection methods, the OOB, the best-first, and the Thenkabail's subsets are plotted in Fig. 7. The waveband regions are named following the convention in Thenkabail et al. (2004): VIS = visible (0.450–0.750 μm); NIR = near infrared (0.751–1.050 μm); FNIR = far near-infrared (1.051– 1.300 μm); ESWIR = early short-wave infrared (1.301–1.900 μm); FSWIR = far short-wave infrared (1.901–2.500 μm). The best-first method selected 21 out of 126 bands. The OOB method in Random Forest has ranked each feature according to their importance in accuracy. The first 25 bands are used and their scores are plotted in Fig. 7. The bands selected by the best-first and the OOB methods have two similarities in terms of the waveband regions. First, both have skipped almost the entire spectral region at 0.8–1.2 μm which belongs to the NIR and the FNIR. Second, both methods have a large number of bands located within the SWIR, in particular the ESWIR. The best-first and the OOB methods have selected respectively thirteen and seventeen bands from
the SWIR. A clear concentration is found in the ESWIR with nine of the 25 OOB bands and eight of the 21 best-first bands. Some clear differences can be found between the band distributions of the OOB and the best-first subsets and that of the Thenkabail's subset. Thenkabail's bands are more evenly distributed and have higher concentrations in the VIS, the NIR and the FNIR (0.4 to 1.3 μm). The OOB and the best-first subsets, however, focus more on the ESWIR and the FSWIR, especially between 1.3 and 1.9 μm. Previous studies have shown that the SWIR has high correlation with water thickness and plant moisture content (Hardisky et al., 1983; Yilmaz et al., 2008). The importance of the SWIR for vegetation and cropland is wellknown (Thenkabail et al., 1994) and actually it was also the goal in Thenkabail et al.'s (2004) study to explore the potential role of the SWIR. Their results showed that FNIR bands were more effective than SWIR bands in increasing accuracies. The importance of SWIR in our study area is more apparent as illustrated by the results of the band selection algorithms. It should be noted that climatic conditions in the African savanna ecoregions are quite different from our study area due to the latitudinal and geographical differences. For example, precipitation contrast between dry and wet seasons is high in African savanna. Comparatively, precipitation in our study area of Belgium is
Fig. 6. Snapshots of overall accuracies at 10 trees interval for Adaboost and Random Forest using different band subsets. Their results are compared to using all the bands (Adaboostall and RF-all). The accuracies with only one tree are not shown in order to have a better visualization of different input scenarios.
Author's personal copy 3006
J.C.-W. Chan, D. Paelinckx / Remote Sensing of Environment 112 (2008) 2999–3011
Table 4 Selected bands from different methods
Number of bands 1 2 3 4 5 6 7 8 9 10 11 12 13 14 15 16 17 18 19 20 21 22 23 24 25
Table 5 Overall accuracy of using different band subsets
Best-first search (21 features)
Thenkabail (2004) (22 features)
Out-of-bag (25 features)
Band ID
Band centers
Band ID
Band centers
Band ID
Band centers
5 7 9 14 15 18 19 55 66 67 70 74 77 78 89 94 100 108 112 118 119
0.497 0.528 0.558 0.635 0.650 0.695 0.711 1.244 1.448 1.462 1.504 1.558 1.597 1.610 1.747 1.806 2.047 2.188 2.257 2.356 2.372
5 9 15 17 19 21 31 33 38 44 47 53 55 57 66 84 87 97 99 111 113 116
0.497 0.558 0.650 0.680 0.711 0.740 0.879 0.912 0.991 1.084 1.129 1.216 1.244 1.273 1.448 1.685 1.722 1.991 2.028 2.24 2.274 2.323
2 4 19 20 21 22 24 25 63 64 65 66 67 71 74 82 87 96 97 109 110 112 113 124 126
0.452 0.482 0.711 0.725 0.740 0.756 0.786 0.801 1.405 1.420 1.434 1.448 1.462 1.517 1.558 1.661 1.722 1.972 1.991 2.205 2.223 2.257 2.274 2.451 2.467
μm
μm
μm
constant and remains high throughout the year. These differences will bring different phenologies and could contribute to the differences in band selections. We applied Adaboost and Random Forest using different feature subsets. In the case of Random Forest, the number of features (bands) for each split for the best-first subset and the Thenkabail's subset are 5 and 9, respectively (Table 3). For the OOB subset, there was a disagreement between the results from 10 and 20 trees. An average was taken and the
All bands Thenkabail Best-first Out-of-bag Combine all subsets
Number of bands
Adaboost
Random Forest
126 22 21 25 53
69.5% 68.5% 68.6% 66.9% 69.5%
68.6% 68.6% 67.8% 68.5% 68.8%
number with the highest average accuracy rate from the test set was chosen. The number for the split is one. The accuracies of Adaboost and Random Forest on all different subsets are very comparable at around 68.5% (Table 5). The two worst cases are found to be Adaboost with the OOB subset where the accuracy is 2.6% lower and Random Forest with the best-first search subset, the accuracy is 0.8% lower. Comparatively, Random Forest is slightly more robust than Adaboost with different inputs because its accuracy almost does not change. Apparently, all feature subset selection methods produce rather good results even though the selected bands have rather different distributions. The OOB is a data-driven method. It is like a leave-one-out method, where each band is left out consecutively to check its influence on accuracy, cleverly implemented in an ensemble scenario. It is much faster than the best-first method which is heuristic and does not search the entire search state, or all the combinations. The result of the best-first is not considered optimal, or unique. However, it has a better average accuracy over the two classifiers (Table 5). A last experiment was performed combining all feature subsets. A combined subset was formed with 53 bands (see its distribution in Fig. 7). The number of split for Random Forest is found to be 12 (see Table 3). The accuracies of Random Forest and Adaboost are 68.8% and 69.5%, respectively. Comparing to the entire set, the combined set has attained the same accuracy with Adaboost and even a little higher accuracy (+0.2%) with Random Forest. Figs. 8 and 9 show the accuracy performance of different inputs at class level for Random Forest and Adaboost. Random Forest has higher accuracies with v, hpgh and hpgs, while Adaboost does better with hx, kj, kl, lh, q and sc. In terms of input subsets, there is no evidence that any feature subsets has absolute advantage over any individual classes.
Fig. 7. The distributions of selected bands from the best-first method (Best_First_21), the out-of-bag method (OOB_25) and the optimal wavebands from Thenkabail et al. (2004) (Thenkabail_22). The scores of the 25 highest ranked features using OOB estimates are also shown.
Author's personal copy J.C.-W. Chan, D. Paelinckx / Remote Sensing of Environment 112 (2008) 2999–3011
3007
Fig. 8. Class accuracies from Random Forest using different band subsets. RF-all represents the accuracies with all the 126 bands.
As mentioned above, Random Forest uses only a portion of the input features for each split which makes it computationally lighter. Fig. 10 shows the differences in time between these two algorithms. It is based on a Pentium IV machine at 3.4 GHz. For Adaboost, 100 trees (or with 99 boosting trials) with 126 bands takes a bit more than 35 minutes, compared to 5 minutes with Random Forest. Using 22 bands to build a hundred trees, Random Forest will take one and a half minutes compared to almost 5 minutes with Adaboost. This difference in computational time will grow significantly larger with higher number of bands. Naturally, this will become important only when the classification has to be finished in a very short period of time, as in an emergency situation, or it has to be repeated hundreds and thousands of times. For the application in this study, the difference in elapsed time of the two classifiers is insignificant. Another important criterion in the operational context, other than accuracy and computing time, is stability. An algorithm gives stable results implies that it is not over-sensitive to variability in reflectances
caused by bidirectional effects, solar zenith angle, or other factors unrelated to a change of land covers (DeFries & Chan, 2000). A minor change in the training data does not alter greatly the classification result. We assess the stability of the two ensemble classifications using the K-error diagram (Margineantu & Dietterich, 1997) which has been applied in classification algorithms using remotely sensed data (Chan et al., 2001, DeFries & Chan, 2000). This diagram helps to visualize the relationship between stability and accuracy of an algorithm. The original training set was randomly sampled 10% ten times, creating 10 new training sets. This resampling approximates a minor change in the training set. A degree-of-agreement statistic K is calculated for each pair of classifications generated from each of the 10 training sets. A scatter plot can then be created with each point representing a pair of classifiers. The x coordinates is the stability value (K) and the y coordinates is the average accuracy of the pair of classifiers. When K =0, the agreement of the two classifications is entirely by chance; when K = 1, the pair agree on every sample. For a stable algorithm, the plot will produce a compact
Fig. 9. Class accuracies from Adaboost using different band subsets. Adaboost-all represents the accuracies with all the 126 bands.
Author's personal copy 3008
J.C.-W. Chan, D. Paelinckx / Remote Sensing of Environment 112 (2008) 2999–3011
Fig. 10. A comparison of computing burden between Adaboost and Random Forest using 126 and 22 bands.
cloud with similar values close to 1. If on a contrary the values of K are spread out and farther away from the value 1, the algorithm is considered less stable. Since the formula of the K statistic is quite well-known within the remote sensing communities, we do not repeat here. Instead the reader is referred to Margineantu and Dietterich (1997) or DeFries and Chan (2000). Only to note that the conventional use of the kappa values in accuracy assessment is to compare the classification result with the groundtruth labels. For the purpose of stability assessment, it compares the results from each pair of the classifiers. From 10 training sets, a total of 10C2 = 45 pair values are created. We have plotted the K-error diagram for each of the five input scenarios for both Random Forest and Adaboost (Fig. 11). In all input scenarios, the K values (internal agreements) of Random Forest are higher than those of Adaboost. This shows that the former is a more stable algorithm. The coefficient of variation (c.v.) is given for each plot to measure the degree of variation for each spread. In all scenarios except the best-first subset, Adaboost has a higher c.v. value than Random Forest, though the differences are small. In terms of stability, Random Forest has outperformed Adaboost. In summary, both Adaboost and Random Forest are powerful learning algorithms. Though Adaboost has marginally higher accuracy (b1%) when using all the bands, it is slightly less robust to different
feature subsets as compared to Random Forest. The latter is also more stable and cheaper in terms of running time. All of the subsets worked well. Comparable accuracies are obtained using roughly 17% (21 bands) to 20% (25 bands) of the original feature set. Selections from the two band selection methods, the OOB and the best-first, agree on the importance of the SWIR, especially the ESWIR. The combination of different subset selection results has produced the best accuracies. However, it should be noted that, like bagging, Adaboost is only an algorithm to change the training set. It is not equipped with the features used in Random Forest such as the random feature subset for splitting and the OOB estimates. Both features in theory can also be implemented with Adaboost. Hence, a direct comparison between Adaboost and Random Forest should be handled with care. 5. Applicability of hyperspectral data for ecotope mapping To date, most ecotope mapping tasks are done manually. This survey-driven approach is labor-intensive and time-consuming. If the task can be partially replaced by automated procedure using remote sensing methods, it will save a lot of resources. A classification of the Biological Valuation Map based on the Adaboost classifier is shown in
Fig. 11. K-error diagram for all different input subsets with Adaboost and Random Forest (RF). Coefficient of variation (c.v.) for each band subset is shown in the legend.
Author's personal copy J.C.-W. Chan, D. Paelinckx / Remote Sensing of Environment 112 (2008) 2999–3011
Fig. 12. In this section, we discuss the possibility of utilizing hyperspectral data for ecotope mapping by analyzing the confusion matrix. We will focus on the confusion matrix of Adaboost using all the bands (Table 6) which gives the highest overall accuracy at 69.5%. 5.1. Grasslands and arable land Even though some classes are poorly separated, it is observed that some regrouping or merging of classes will immediately improve the applicability of the method. It is clear that arable land (b) and grass monocultures (hx) can be distinguished at high accuracies and that both differ clearly from the permanent grasslands group (hp–hpv–hpgs– hpgh). Though there are special interests in separating the permanent grasslands group into more specific subgroups, our results suggest that this will be rather difficult even with hyperspectral data. The major confusions within the group can be attributed to the class descriptions that are by definition rather mixed. For example, a lot of the semi-natural grassland (hpgh) pixels are assigned to species rich improved grasslands (hpgs) which is actually a transitional class between species poor improved grassland (hp) and hpgh. A land parcel labeled as hpgs can in fact consist of different proportion of hpgs, hpgh and hp. Furthermore, hpv are grasslands with scattered nature values and within the study area most of these grasslands are in fact a mosaic of hp and hpgs. Apparently, they can not be separated. However, it would be already a valuable application if we could produce maps representing three classes: arable land (b), grass monocultures (hx) and permanent grassland (hp–hpv– hpgs–hpgh). This is important for environmental policies as there are some legislation rules concerning permanent grasslands (Wils & Paelinckx, 2004). The remote sensing techniques can be used to reduce the amount of field work to search and map these grasslands.
3009
5.2. Tree classes The results for deciduous forests (f and q class, respectively dominated by beech and oak) and for poplar and conifer plantations are promising (Table 6). Also the accuracy for plantations of other deciduous trees (gml) is not bad. In all cases it is possible that the degree of accuracy is even higher because: – Within the class of deciduous forests dominated by beech (f), most “misclassifications” are assigned to the class of deciduous forests dominated by oak (q) and vice versa. In fact the BVM legends f and q reflect the dominant tree species, so it is possible that beech occurs in an oak forests and vice versa. – In the case of the class poplar plantation (lh), there is a high commission error of lh to q. In reality, oak trees (q) can occur in poplar plantation (lh). In such cases, this is not an error. – For the class of plantations of deciduous tree species other than beech, oak, alder and poplar (gml), there is a large amount of misclassification to poplar plantation (lh) indicating real misclassifications. However, the misclassification of gml to oak trees (q) might in fact be oak trees within gml. The reached accuracy to distinguish scrubs (sc) from other ecotopes, and even to distinguish them from thorn tickets (sp) is promising. The accuracies for orchards kj and kl are good. Interestingly, almost all “misclassifications” for the tall tree orchard (kj) are within the class species rich improved grasslands (hpgs). This could be explained by the fact that the legend unit kj of the BVM represents a tree coverage ranging from 20% to 100% and within the study area many of these orchards have a hpgs vegetation underneath the trees.
Fig. 12. On the left is the ground truth image of the Biological Valuation Map. On the right is the Biological Valuation Map classification based on airborne hyperspectral data using 99 trials of Adaboost with 21 bands selected by the best-first search method. The black areas represent unclassified land covers that have been masked out.
Author's personal copy 3010
J.C.-W. Chan, D. Paelinckx / Remote Sensing of Environment 112 (2008) 2999–3011
Table 6 The confusion matrix of 99 99 Adaboost Adaboost trials trials
Overall accuracy = 69.5%.
The accuracy of the woodland of alluvial soil, fens and bogs (v) is poor at only 37% with Adaboost, but it is much higher with Random Forest at 60% (compare Figs. 8 and 9). This higher accuracy with Random Forest, though, implies tradeoffs in other classes. The reason for the low accuracy of this class with Adaboost is related to the algorithmic formation of C5.0 rather than the ineffectiveness of the spectral information. More training pixels from more test sites might improve the accuracy of class v. Nevertheless, as most misclassifications of v are placed in the classes of poplar (lh) and oak (q), these can be also due to the fact that the dominant tree species (Alnus) are shadowed by taller poplar and oak trees. The mixed nature of these ecotopes makes them a challenge to classify. 6. Conclusions In this study, we assess the utility of two tree-based ensemble classifiers, Adaboost and Random Forest, for the classification of detailed ecotopes using hyperspectral data. Two feature subset selection algorithms are also examined, together with the optimal wavebands suggested in Thenkabail et al. (2004). Our evaluation criteria include accuracy assessment, training time and also stability. In terms of accuracy performance, Random Forest and Adaboost are almost the same and both have outperformed a neural network classifier. Training time is shorter for Random Forest which is expected because it used only a random subset for each split and applied no pruning. Random Forest generated comparatively more stable results with higher internal agreements as shown by the K-diagram plots. When provided with different feature subsets, Random Forest is more robust than Adaboost, though the differences are considered marginal. The highest overall accuracy, nevertheless, is obtained from Adaboost. Due to relatively few requirements for parameter settings, both algorithms are easy to use and their results are highly reproducible. We note that direct comparison between these two classifiers needs to be careful as some features such as the random feature subset and OOB strategy can also be implemented with Adaboost. This study concludes that both classifiers are efficient in handling hyperspectral data and either of them can be a good choice for our application. Both feature selection routines, the best-first search and the outof-bag ranking index under Random Forest, are successful in identifying substantially smaller band subsets that attained almost the same accuracy as all the bands. Thenkabail's bands worked equally well. The use of a smaller feature set significantly reduces computing time. This is more beneficial to Adaboost since Random Forest has
already rather light computing burden. One interesting finding is the concentration of the selected bands, for both methods, in the early shortwave infrared region (1.3–1.9 μm), and both have excluded presumably important wavebands at the near infrared and far infrared regions between 0.5 and 1.3 μm. These results signal the importance of SWIR for ecotope classification. However, more studies are needed for more conclusive statements. The feature set which combined three individually derived feature subsets with 53 bands have produced the best accuracy. This supports the idea of using a basket of feature selection methods, instead of just one. Though the best overall accuracy of the 16 ecotopes is only 69.5%, individual classes have much higher accuracies. Arable land (b) and grass monocultures (hx) have over 90% accuracies. Five out of the ten tree classes have attained accuracies over 80%. The mixed natural of some grassland classes, however, have made separation impossible. An adaptation of the classification scheme to create a class of “permanent grassland” would enhance the applicability of the remote sensing method. Acknowledgements This work was partly supported by the Belgian Science Policy Office under the framework of the STEREO programme – projects ECOMALT (contract SR/03/046) and HABISTAT (contract SR/00/103). We would like to thank four anonymous reviewers for their helpful comments and suggestions. References Bajcsy, P., & Groves, P. (2004). Methodology for hyperspectral band selection. Photogrammetric Engineering and Remote Sensing, 70, 793−802. Bauer, E., & Kohavi, R. (1998). An empirical comparison of voting classification algorithms: Bagging, boosting, and variants. Machine Learning, 1−38. Benediktsson, J. A., & Swain, P. H. (1992). Consensus theoretic classification methods. IEEE Transactions on Systems, Man Cybernet, 22, 688−704. Bork, E. W., West, N. E., & Price, K. P. (1999). Calibration of broad- and narrow-band spectral variables for rangeland cover component quantification. International Journal of Remote Sensing, 20, 3641−3662. Breiman, L. (1996). Bagging predictors. Machine Learning, 24, 123−140. Breiman, L. (2001). Random forests. Machine Learning, 45, 5−32. Breiman, L., Freidman, J. H., Olshen, R. A., & Stone, C. J. (1984). Classification and Regression Trees. Wadsworth. Briem, G. J., Benediktsson, J. A., & Sveinsson, J. R. (2002). Multiple classifiers applied to multisource remotes sensing data. IEEE Transactions on Geoscience and Remote Sensing, 40, 2291−2299. Chan, J. C. -W., DeFries, R. S., Zhan, X., Huang, C., & Townshend, J. R. G. (2000). Texture features for change detection at 250 m resolution – An application of machine
Author's personal copy J.C.-W. Chan, D. Paelinckx / Remote Sensing of Environment 112 (2008) 2999–3011 learning feature subset selection. Proceedings IGARSS (International Geoscience and Remote Sensing Symposium) 2000, July 24–28, Hawaii, Vol. VII. (pp. 3060−3062). Chan, J. C. -W., Huang, C., & DeFries, R. S. (2001). Enhanced algorithm performance for land cover classification from remotely sensed data using bagging and boosting. IEEE Transactions of Geoscience and Remote Sensing, 39, 693−695. Chang, C. -I., Du, Q., Sun, T. -L., & Althouse, M. L. G. (1999). A joint band prioritization and band-decorrelation approach to band selection for hyperspectral image classification. IEEE Transactions on Geoscience and Remote Sensing, 37, 2631−2641. Crawford, M. M., Ham, J., Chen, Y., & Ghosh, J. (2003). Random forests of binary hierarchical classifiers for analysis of hyperspectral data. IEEE Workshop on Advances in Techniques for Analysis of Remotely Sensed Data, 27–28 Oct. 2003 (pp. 337−345). De Blust, G., Paelinckx, D., & Kuijken, E. (1994). Up-to-date information on nature quality for environmental management in Flanders. In F. Klijn (Ed.), Ecosystem Classification for Environmental Management (pp. 223−249). DeFries, R. S., & Chan, J. C. -W. (2000). Multiple criteria for evaluating machine learning algorithms for land cover classification from satellite data. Remote Sensing of Environment, 74, 503−515. Dietterich, T. G. (2000). An experimental comparison of three methods for constructing ensembles of decision trees: Bagging, boosting, and randomization. Machine Learning, 40, 139−158. Džeroski, S., & Ženko, B. (2004). Is combining classifiers with stacking better than selecting the best one? Machine Learning, 54, 255−273. Ellis, E. C., Wang, H., Xiao, H., Peng, K., Liu, X. P., Li, S. C., Ouyang, H., Cheng, X., & Yang, L. Z. (2006). Measuring long-term ecological changes in densely populated landscapes using current and historical high resolution imagery. Remote Sensing of Environment, 100, 457−473. Foody, G. M., Boyd, D. S., & Sanchez-Hernandez, C. (2007). Mapping a specific class with an ensemble of classifiers. International Journal of Remote Sensing, 28, 1733−1746. Freund, Y., & Schapire, R. E. (1996). Experiments with a new boosting algorithm. Machine Learning: Proceedings of the Thirteenth International Conference (pp. 148−156). Friedl, M. A., & Brodley, C. E. (1997). Decision tree classification of land cover from remotely sensed data. Remote Sensing of Environment, 61, 399−409. Ginsberg, M. L. (1993). Essentials of Artificial Intelligence. Morgan Kaufmann. Gislason, P. O., Benediktsson, J. A., & Sveinsson, J. R. (2006). Random Forests for land cover classification. Pattern Recognition Letters, 27, 294−300. Guo, B., Gunn, S. R., & Damper, R. I. (2006). Band selection for hyperspectral image classification using mutual information. IEEE Transactions on Geoscience and Remote Sensing Letters, 3, 522−526. Ham, J., Chen, Y., Crawford, M. M., & Ghosh, J. (2005). Investigation of the Random Forest framework for classification of hyperspectral data. IEEE Transactions on Geoscience and Remote Sensing, 43, 492−501. Hardisky, M. A., Klemas, V., & Smart, R. M. (1983). The influences of soil salinity, growth form, and leaf moisture on the spectral reflectance of Spartina alterniflora canopies. Photogrammetric Engineering and Remote Sensing, 49, 77−83. Jia, X., & Richards, J. A. (1994). Efficient maximum likelihood classification for imaging spectrometer data sets. IEEE Transactions on Geoscience and Remote Sensing, 32, 274−281. Kaewpijit, J., Moigne, L., & El-Ghazawi, T. (2003). Automatic reduction of hyperspectral imagery using wavelet spectral analysis. IEEE Transactions on Geoscience and Remote Sensing, 41, 863−871.
3011
Kohavi, R., & John, G. H. (1997). Wrappers for feature subset selection. Artificial Intelligence, 97, 273−324. Kohavi, R., & Sommerfield, D. (1995). Feature subset selection using the wrapper model: Overfitting and dynamic search space topology. Proceedings of the First International Conference on Knowledge Discovery and Data Mining (pp. 192−197). Kohavi, R., Sommerfield, D., & Dougherty, J. (1996). Data mining using MLC++: A machine learning library in C++, Tools with Artificial Intelligence. IEEE Computer Society Press 234–245 pp. Lawrence, R. L., Wood, S. D., & Sheley, R. L. (2006). Mapping invasive plants using hyperspectral imagery and Breiman and Cutler classifications (RandomForest). Remote Sensing of Environment, 100, 356−362. Lee, C., & Landgrebe, D. A. (1997). Decision boundary feature extraction for neural networks. IEEE Transactions on Neural Networks, 8, 75−83. Margineantu, D. D., & Dietterich, T. G. (1997). Pruning adaptive boosting. Proceedings of the 14th International Conference on Machine Learning (pp. 211−218). Melgani, F., & Bruzzone, L. (2004). Classification of hyperspectral remote sensing images with support vector machines. IEEE Transactions on Geoscience and Remote Sensing, 42, 1778−1790. Mingers, J. (1989). An empirical comparison of selection measures for decision tree induction. Machine Learning, 3, 319−342. Mingers, J. (1989). An empirical comparison of pruning methods for decision tree induction. Machine Learning, 4, 227−243. Pal, M., & Mather, P. M. (2003). An assessment of the effectiveness of decision tree methods for land cover classification. Remote Sensing of Environment, 86, 554−565. Quinlan, J. R. (1987). Simplifying decision trees. International Journal of Man-Machine Studies, 27, 221−234. Quinlan, J. R. (1993). C4.5: Programs for Machine Learning. San Mateo, CA: Morgan Kaufmann Publishers, Inc. Thenkabail, P. S., Enclona, E. A., Ashton, M. S., & Van Der Meer, B. (2004). Accuracy assessments of hyperspectral waveband performance for vegetation analysis applications. Remote Sensing of Environment, 91, 354−376. Thenkabail, P. S., Ward, A. D., & Lyon, J. G. (1994). Landsat-5 Thematic Mapper models of soybean and corn crop characteristics. International Journal of Remote Sensing, 15, 49−61. Ustin, S. L., Roberts, D. A., Gamon, J. A., Asner, G. P., & Grreen, R. O. (2004). Using imaging spectroscopy to study ecosystem processes and properties. BioScience, 54, 523−534. Wils, C., & Paelinckx, D. (2004). Permanent grasland binnen VEN en binnen habitat- en vogelrichtlijngebied. Testbestand. Verslag en digitaal bestand Instituut voor Natuurbehoud IN. O2004.14 Brussel (pp. 11). (In Dutch). (Title translated in English: Permanent grassland in the Flemish ecological network and in the habitat and bird directive areas. Report and draft GIS databank of the Institute of Nature Conservation.). Wils, C., Paelinckx, D., Adams, Y., Berten, B., Bosch, H., De Knijf, G., et al. (2004). Biologische Waarderingskaart en natuurgerichte bodembedekkingkaart van het Vlaamse Gewest. Rapport en digitaal bestand Instituut voor Natuurbehoud IN. R2004.08 Brussel (pp. 39). (In Dutch). (Title translated in English: Biological Valuation Map and land cover map of Flanders. Report and draft GIS databank of the Institute of Nature Conservation). Yilmaz, M. T., Hunt, E. R., Jr., Goins, L. D., Ustin, S. L., Vanderbilt, V. C., & Jackson, T. J. (2008). Vegetation water content during SMEX04 from ground data and Landsat 5 Thematic Mapper imagery. Remote Sensing of Environment, 112, 350−362.