ENGINEERING FOR RURAL DEVELOPMENT
Jelgava, 23.-25.05.2018.
EVALUATION OF TREE HEIGHT AND NUMBER OF TREES USING LIDAR DATA Janis Ivanovs, Andis Lazdins
Latvian State Forest Research Institute “Silava”, Latvia
[email protected],
[email protected] Abstract. The aim of this study is to detect and to analyse individual trees and their heightin young and mature coniferous forest stands using local maxima method based on LiDAR (Light Detecting and Ranging) data, which are currently being obtained for the territory of Latvia. Empirical data about the tree height and number of trees for this study are obtained from the National forest inventory (NFI) sample plots and additional surveying is not conducted. LiDAR data are obtained from the Latvian Geospatial Information Agency. LiDAR surveying is done separately from NFI measurements. Sample plots are selected so that LiDAR data are obtained within 1 calendar year leeway from field measurements forNFI surveying of sample plots. Step by step instructions on the applied method are included in this paper. Average tree height and number of trees are compared between the remotely obtained and in field measurements based data sets. The best results are achieved in determination of the average tree height in mature forest stands. Remote sensing based data on the height and numberof trees in young forests is less accurate because of insufficient density of LiDAR point cloud and possible spatial offset of study plots in the NFI database.In order to obtain results with higher accuracy, LiDAR data with higher point density are needed. Keywords: DEM, DSM, local maxima, individual tree.
Introduction Height of the tree is one of the most significant indicators in the forest inventory. It is determined in order to predict the growing stock, amount of carbon sequestrated, tree growth conditions, forest productivity and other indicators. The height of the individual trees along with the diameter of their trunks is used to calculate volume of individual trees and whole forest stands, but the age of the forest stand together with the tree height provides an opportunity to calculate the site index [1]. The use of remote sensing data in forest inventory prior LiDAR technology has been limited because of low horizontal and vertical resolution. Therefore, remote sensing data mostly have been used to describe forest stands in general using indirect methods rather than at individual tree level [2]. LiDAR is a surveying method that measures the distance to a target by illuminating the target with pulsed laser light and measuring the reflected pulses with a sensor. The use of LiDAR technologies in the forest inventory has made it possible for forest stands to be measured at a level of individual trees. Even the data obtained at relatively high altitudes are with high spatial resolution. Digital elevation and surface models can be generated from precise laser scanning point clouds, which consist of several points per square meter[3]. LiDAR data, due to their high resolution, can be used to measure the horizontal and vertical structure of a forest stand. It is possible to measure a forest stand describing the parameters such as the tree height, forest floor topography, forest stand biomass, number of trees and circumference of tree crown [4]. For detection of individual trees LiDAR data can be processed in various ways and depending on the density of the points the methodology and obtained results may vary. The most popular methods for individual tree detection from LiDAR data are determination of local maxima, segmentation and clustering of point clouds and determination of watersheds. These methods can be combined and supplemented with other algorithms for more accurate and in-depth results [5]. The method of determining the local maximum is based on the canopy height model (CHM) analysis. CHM is obtained by subtracting digital elevation model (DEM) from the digital surface model (DSM). Depending on the LiDAR point density, it is possible to create a variety of spatial resolution models. Local maximums representing treetops are determined by processing of the CHM model with the sliding window principle [5]. Segmentation and clustering of LiDAR point cloud for individual tree detecting uses DSM and previously made 3-D based ellipsoidal models of the tree crown. Segmentation gives locations and heights of the trees in topmost canopy layer. In clustering stage LiDAR point cloud points are grouped together by known tree crown models, so it is possible to detect dominant, as well as understory trees [6].
DOI: 10.22616/ERDev2018.17.N153
1390
ENGINEERING FOR RURAL DEVELOPMENT
Jelgava, 23.-25.05.2018.
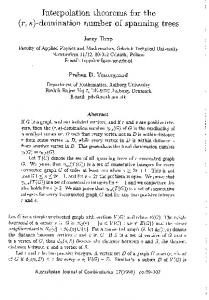
The watershed method is based on CHM analysis. In this case CHM raster is inverted so that its values are negative and tree crowns are like valleys. This raster image can be processed with any of the watershed defining algorithms. Using this method, it is relatively easy to determine the circumference of tree crowns [7]. Materials and methods LiDAR data, which are necessary for DEM, DSM and CHM generation, are obtained from the Latvian Geospatial Information Agency.Average point cloud density in *las format datasets is between 4 and 14 points per square meter. Vertical precision for acquired LiDAR data is at least 12 cm and horizontal precision is at least 36 cm (2 sigma with 95 % confidence level against the national geodetic network). The study area consists of 85 sample plots. Fig. 1 shows the location of the sample plots. Red dots represent young coniferous forest stands with average tree height between 8 and 15 m, blue dots represent mature coniferous forest stands, which are 70 – 100 years old. Since the NFI plots are surveyed once per 5 years, for this study, only sample plots, which are surveyed within 1 calendar year leeway of LiDAR surveying, are selected. There are 42 sample plots representing young forest stands and 43 study plots representing mature forest stands.
Fig. 1. Study area Data processing has been done in Grass GIS 7.2. software. DEM is made in 2x2 m resolution, DSM is made in 0.5x0.5 m resolution. DEM is made in coarser resolution because terrain in Latvia is relatively flat and raster files made in coarser resolution require less space without losing of quality. DSM is made as precise as possible for known density of LiDAR point cloud. Local maxima detection is done by r.neighbors algorithm. CHM are processed by application of moving window principle to detect local maximums, which represent individual treetops. Moving window finds the maximum value in the CHM raster with set window size and replaces the central cell with that value. Moving window size in this case is set as 3 raster cells in diameter. It means that trees should be at least 1.5 meters away from each other to be detected as individual trees. If a tree has more than one top, each top may be counted as a separate tree. In order to detect trees that are closer than 1.5 m to each other, more precise LiDAR point cloud is needed.
1391
ENGINEERING FOR RURAL DEVELOPMENT
Jelgava, 23.-25.05.2018.
Local maxima raster images are further processed in order to obtain information about exact location of peaks in the images. Since all peaks in local maximum raster now are represented as 9 cell squares with equal values, it is possible to locate central cells of those squares. It is done byequation (1) usingr.mapcalc tool in Grass GIS software.Numbers in square brackets are coordinates for neighbouring pixels, operator = = means “logical equal” and operator && means “logical and”.
if (( X [−1,−1] == X [0,0]) & &( X [−1,0] == X [0,0]) & &( X [−1,1] == X [0,0]) & & ( X [0,−1] == X [0,0]) & &( X [0,1] == X [0,0]) & &( X [1,−1] == X [0,0]) & &
(1)
( X [1,0] == X [0,0]) & &( X [1,1] == X [0,0]),1, null ()), where X – raster image of local maxima. CHM raster image should be further processed in order to select only those areas that represent trees and not areas that represent the rest of the landscape. Definition of forest in Latvia determines that forest is an ecosystem in which the tree height can reach at least 5 m [8], so the cells with CHM values below 5 m are filtered out by equation (2).
if ( X > 5,1, null())
(2)
where X – CHM raster image. Next step is to determine local maximum centre cells that represent treetops. This is done by combining the raster image with local maximum centre cell locations with the raster image that represents forested areas. Expression is given in equation (3).
if (( X == 1) & &(Y == 1),1, null())
(3)
where X – raster image of local maxima centres; Y – raster image with forested area. Now it is possible to get raster image that represents individual trees with their height values. Equation (4) takes the raster image which represents treetops and adds height information from CHM to it.
if ( X == 1, Y , null())
(4)
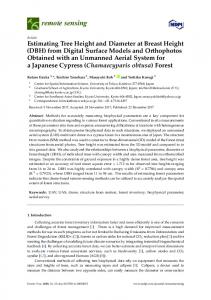
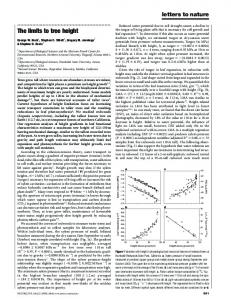
where X – raster image of individual treetops; Y – CHM raster image. After this step final raster image is converted to polygon vector data format. Polygons are further converted to centroids. Now every point represents an individual tree and has the height value. After that v.vect.stats tool is used to intersect the obtained tree data with NFI sample plots and both datasets can be compared. Results The obtained results approve that the applied method can be used for determination of approximate thee height. Average tree height measurements obtained from LiDAR data are 1-2 m smaller than the measurement data from NFI plots and there is significant difference between both datasets for young and mature forest stands. Fig. 2 shows that the determination coefficient is significant (r2 = 0.9274) and the tree height values for mature forest stands obtained from LiDAR data are constantly below the tree height values from NFI data. Underestimation of the tree height in LiDAR data may be associated with the specific character of laser scanning, because the laser signal may miss the treetop and first reflection is coming from a lower place in the tree crown. Such systematic error is found in other studies, too [2; 5]. Correlation between the tree height data obtained from LiDAR data in young forest stands and NFI sample plot measurement data is less certain. According to Fig. 3, the determination coefficient is lower than for mature forest stands (r2 = 0.5342) and data points are more scattered. Smaller determination coefficient in young forest stands can be explained by differences in the structure for both types of the forest stands. Trees in young forest stands are usually located close to each other, 1392
ENGINEERING FOR RURAL DEVELOPMENT
Jelgava, 23.-25.05.2018.
while in mature forest stands the distance between trees increases several times after multiple thinnings and the height of dominant trees is more even, so that they can be better distinguished by the applied method. Density of point cloud is not high enough to determine various dominant tree heights in young forest stands. Points in Fig. 3 are more scattered also because the height increment in young forest stands is bigger and NFI sample plots in this study are selected with 1 calendar year leeway from LiDAR surveying.
Fig. 2. Comparison between datasets for mature forest stands
Fig. 3. Comparison between datasets for young forest stands Determination of the number of trees within the sample plot has been less successful. There is statistically significant difference for both young and mature forest stands between the NFI and LiDAR datasets. Available LiDAR point cloud is not dense enough to precisely determine the correct number of trees in sample plots or there is spatial deviation for NFI sample plots and slightly different areas are analyzed. Additional field work has to be conducted simultaneously with LiDAR surveying to obtain more accurate data for comparison. Future studies are needed to evaluate the applied method on datasets which are gathered simultaneously. Conclusions 1. LiDAR data can be used to determine the height and number of trees, however, the methodology should be improved in order to identify close growing trees and those located below topmost canopy layer. 2. The applied method can be used to elaborate regression equations for determination of the height of dominant trees with high accuracy. 1393
ENGINEERING FOR RURAL DEVELOPMENT
3.
Jelgava, 23.-25.05.2018.
In order to improve the accuracy of the obtained results, it is necessary to use LiDAR data with higher point cloud density, so that CHM raster images can be generated with higher resolution.
Acknowledgements The study is implemented within the scope of the Forest Sector Competence Centre project No. 1.2.1.1/16/A/009. References [1] Andersen H.-E., Reutebuch S.E., Mcgaughey R.J. A rigorous assessment of tree height measurements obtained using airborne lidar and conventional field methods. Can. J. Remote Sens.,vol. 32, 2006, pp. 355-366. [2] Falkowski M.J., Smith A.M.S., Hudak A.T., Gessler P.E., Vierling L.A. Automated estimation of individual conifer treeheight and crown diameter via two-dimensionalspatial wavelet analysis of lidar data. Canadian Journal of Remote Sensing, vol. 32, 2006, pp. 153-161. [3] Brandtberg T., Warner T.A., Landenberger R.E., McGraw J.B. Detection and analysis of individual leaf-off tree crowns in small footprint, high sampling density lidar data from the eastern deciduous forest in North America. Remote Sens. Environ.,vol. 85, 2003, pp. 290-303. [4] Kwak D.-A., Lee W.-K., Lee J.-H., Biging G.S., Gong P. Detection of individual trees and estimation of tree height using LiDAR data. Journal of Forest Research, vol. 12, 2007, pp. 425-434. [5] Eysn L., Hollaus M., Lindberg E., Berger F., Monnet J.M., Dalponte M., Kobal M., Pellegrini M., Lingua E., Mongus D., Pfeifer N. A benchmark of lidar-based single tree detection methods using heterogeneous forest data from the Alpine Space. Forests, vol. 6, 2015, pp. 1721-1747. [6] Lindberg E., Eysn L., Hollaus M., Holmgren J., Pfeifer N. Delineation of tree crowns and tree species classification from full-waveform airborne laser scanning data using 3-d ellipsoidal clustering. IEEE J. Sel. Top. Appl. Earth Obs. Remote Sens., vol. 7, 2017, pp. 3174-3181. [7] Reitberger J., Schnörr C., Krzystek P., Stilla U. 3D segmentation of single trees exploiting full waveform LIDAR data. ISPRS J. Photogramm. Remote Sens., vol. 64, 2009, pp. 561-574. [8] Mežalikums (Forest law). Latvijasrepublikastiesibuakti, 2000. (In Latvian). [online] [15.03.2018]. Available at: https://likumi.lv/doc.php?id = 2825
1394