(islands of coverage). We investigate a mobile user in a Manhattan environment and the considered service is web browsing. Data caching in the use terminal is ...
1
Evaluation of User Perceived Performance in Sparse Infrastructure Wireless Systems Ba¯gs¸en Aktas¸, Aurelian Bria RST/S3 - Royal Institute of Technology (KTH) - Sweden
Abstract— This work tries to evaluate the user perceived performance in a wireless system based on sparse infrastructure (islands of coverage). We investigate a mobile user in a Manhattan environment and the considered service is web browsing. Data caching in the use terminal is employed in order to hide the discontinuities of coverage. We show that for this particular application, the user’s behavior of revisiting pages previously accessed makes caching a way to increase the user perceived coverage. Our results show that at low levels of effective area coverage caching brings a large improvement, while the gain is not significant at high levels. If the sparse coverage network is overlaid over a cellular system the obtained results show potential for significant cost savings.
I. I NTRODUCTION Classical cellular communication systems (such as 2G) has the primary objective of providing voice communication, thus leading to anytime, anywhere access over the service area. Today the scope of mobile communication is broader and data services are becoming more and more important. However, high data rate access in an anytime, anywhere fashion leads to very high costs, mainly due to required infrastructure. To minimize the cost of the network we focus on reducing the number of access points, hence sacrificing the ubiquity of coverage. Due to the discontinuous service availability, such systems with sparse infrastructure will definitely not be suited for real-time services, like voice, unless the user is stationary in the coverage area of an access point (AP). The purpose of each AP is to offer high data rate Internet access to users passing by its vicinity. To compensate for non-covered regions we propose to exploit data caching in the user terminal. Given that the user is characterized by sufficient mobility, every now and then it will pass through a coverage area of an AP where cache memory is refreshed and new web sites are downloaded. Cached information is then made available for later use, even when the user is not connected to the network. Thus, we can take advantage of the the fact that some applications, as web browsing, are of bursty nature and they can tolerate delay. In this paper we will investigate the user perceived performance, in terms of the hit ratio, for the case of a web browsing application. The mobile user moves continuously in a Manhattan environment and requests web pages for viewing. We define the hit ratio as the number of successful requests out of the total number of requests. Through a computer simulation, we evaluate how the hit ration depends on the effective area coverage and cache memory size available in the user terminal, on the hit ratio.
Work on a similar topic was performed in the context of Infostations [1]. While some references propose the user experienced delay as a performance measure for the user perception in general, we believe that in the case of web browsing hit ratio is more relevant. Hit ratio is used, for example, in [2] for location dependent information retrieval together with caching and hoarding of data. Data caching is considered in [3] as enhancer for a map retrieval service. While the above papers identify caching as bringing almost no improvement for their considered services, to us seems evident that if they would have considered a web browsing application there would be a gain. In the Mobiscape project [4], terminals cache visited pages along with a predefined set of URLs that the user has specified to permanently remain in cache. Caching is done both at the mobile unit and at the Support Station (SS) which has been defined as the gateway to the Internet. In our case the Support Station would be the AP. As we notice, the idea of using sparse infrastructure combined with data caching is not new. However, none of the above papers suggest a clear relationship between user perceived coverage and infrastructure design (density of APs, available data rate, etc.) The paper is organized as follows: section II discusses the modelling of the system and section III introduces a simple analytic model for evaluating the hit ratio. The next section IV describes the way that simulation was performed and results are presented in section V. Conclusions and future work are suggested in section VI. II. S YSTEM MODELLING This section outlines the important aspects in modelling sparse infrastructure wireless systems. A. Mobility model We expect that the mobility of the user has a high influence on the user perception of the service quality. For example, when the user requests a web site there are two obvious situations. If it happens to be in a coverage area of an APs then everything works fine and this case always generates a successful hit. If the user is not connected to any AP the conditions for getting a successful hit are: first the requested item must be in cache and second it has to be up to date. We assume that the user is unaware of its connectivity. Thus, we considered it relevant to study two types of mobility: low mobility (pedestrians) and high mobility (mobile users in public transportation or back seat of a car).
2
Most traffic models we have found available today have used web traces for wired Internet browsing, which might not be relevant for wireless environments, especially for pedestrian users. There is a difference in browsing patterns between somebody who sits comfortably in a chair and a pedestrian walking with a small screen device. Still, for the purpose of evaluation we have accepted models from wired Internet. The most important aspects of the traffic model are: page revisitation pattern and the validity interval of the items. In [5] a study on user re-visitation patterns in the World Wide Web is conducted for wired Internet users. It is shown that about 58% of an individuals pages are revisits to previously visited web pages and users continuously adds new items to their collection of visited pages. This result suggest that, simply caching the pages a user visits proves to be beneficial in a our case, since the time that the user is out of coverage will be perceived to be less than the actual area coverage experienced. It is also shown that recently visited pages have higher probability of reoccurring. In a sparse infrastructure system, if the density is not adequate to update the items in cache memory sufficiently often the benefit from caching is low. This is due to the fact that the information which was not updated frequent enough will be inconsistent. Content analysis for wireless users has been carried out in [6]. For example, stock quotes and news are two types of content that would require short update intervals, while information from yellow pages, when cached, is valid for very long time. Hereafter, we assume both short and long update intervals and observe the influence on the hit ratio.
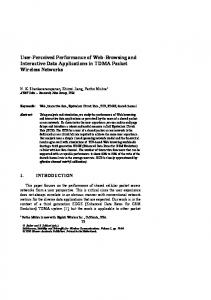
To capture the fact that some items are more popular than others the Zipf distribution is often proposed. However, Zipf distribution it was proven to be a good model in the case of items stored on a server and not on the user terminal. For this reason, we propose a different model and we have chosen for our case a simple distribution model that is consistent with the general behavior of the distribution of reoccurrences suggested in [5]. We approximated the empirical cumulative distribution of requests over the items in the cache presented in [5] to a Pareto Distribution given by equation 1. Figure 1 shows the CDF as a function of the URL distance. The URL distance shows how many items away the requested URL is from the current one in terms of the number of items, when the items are ordered according to their recency of being accessed. As can be seen the recently accessed items dominate in the distribution. 0.7
0.6
0.5
C.D.F of Reoccurance
B. Traffic Model
0.4
0.3
0.2
0.1
0
0
20
40
60
80
100
120
140
160
180
200
Distance of URL from Current One
C. Cache Management and Access Distribution The influence of the cache memory size on performance is one of issues that we want to investigate. Therefore, the cache memory size is a variable parameter in this work and is expressed in number of items (web pages) that can be stored. We also need to assume a type of cache management strategy, in order to remove some of the items to make room for new items. Some typical cache management policies are First In First Out (FIFO), Least Recently Used (LRU), Least Frequently Used (LFU) and SIZE (Items are removed according to items size). Since the consistency of information is an issue, when it is possible to know that the update interval of an item has passed, and it is inconsistent, a priority could be given to remove those items. Removal procedure of inconsistent items is of great importance especially for small cache memory size. An important factor which influences the hit ratio is the distribution of requests on the items in the cache. If the user rarely requests items he/she requested in the past, then caching will not improve the performance. This might be the case in a walk through scenario where the user mostly requests new location specific data. As already mentioned, in [5] it is shown that 58% of a users requests are revisits to previously visited pages. In order to know which of the Web pages a user will request from the cache (if the pages have been cached), we need to have a client-side cache access distribution model.
Fig. 1.
Cumulative Distribution of Access to Previously Visited Items
β F (x) = 1 − ( )α (1) x The parameters β and α are 0.4954 and 0.15 respectively. The random variable x is the distance of the requested URL from the current one. III. A NALYTICAL M ODEL Here we try to identify the potential gain in perceived coverage, by estimating the hit ratio. We use a simple illustrative model. Let us consider a single mobile user moving between two APs with a constant speed v. Each AP has a coverage radius of r and the distance between APs is d. Assume that the time spent in coverage is enough to synchronize all cache memory.
Fig. 2.
Simple model
At the distance x the probability of generating a successful hit is P r{successf ul hit} = P r{request} · (P r{x < r} +
3
P r{item in cache} · P r{xc > x > r}). The second term expresses the gain compared to a situation when caching does not exist. Probability that the requested item is already in cache is considered constant as in [5]. If we consider a certain time limit for the validity of cached items, then xc represents the maximum distance when items is cache are still valid (not expired). It is evident that if xc is large enough the items in cache will always be valid at any moment in time. So, for a certain r the gain is an increasing function of xc until xc = d2 . This simple approach helps us to understand that for low r hit ratio will be mostly affected by the travel time between APs (cache items will not be valid if not renewed in time), while for large r the gain of caching is small due to the fact that real-time connection is available most of the time.
be correlated. We use a temporal correlation shadow fading model as described in [13]. We do not assume any short-term fading. We have used a page-oriented www traffic model as in [14]. The size of Web pages follows a Pareto distribution with a Probability Distribution Function of the following form: ½ −α if 0 ≤ x 1 − ( β+x β ) Fp (x) = (2) 0 other The parameters α and β are equal to 1.7584 and 30458 (bytes) respectively. All the parameters defining the web browsing application are included in the Table I. TABLE I T RAFFIC PARAMETER D ISTRIBUTIONS
IV. S IMULATION To demonstrate the functionality of our proposed sparse infrastructure system we have run a computer simulation. The environment studied is an urban area, which we model by a Manhattan model as described in [9]. The evaluation area is composed of 10 by 10 blocks. The blocks are each 200 meters wide with a street separation of 30 meters each. APs are placed uniformly on the walls of the blocks and considerably lower than the rooftops. The density of the APs used, depends on the required area coverage and is a variable parameter in the simulations. We only consider downlink for the study; uplink is assumed to be always available. We also assume that, during periods of connection, all requested information is already available at the AP, thus we discard the delay or congestion that can appear between AP and the Internet. We consider two mobility models for study. One is a pedestrian model (walk-through) according to an ETSI technical report for UMTS, in which the user is continuously walking outdoors with a speed which is normal distributed with an average of 3 km/h and standard deviation 0.3 km/h as in [9]. We update the users location every second. The other is a drive-through model where we consider that the mobile users have a constant speed of 30 km/h. In both models the user moves in straight lines, changing direction with a certain probability at a street junction. In our experiment, for the sake of simplicity, we will assume Shannon capacity of the radio channel. As in [10] we assume the noise floor kT B = −94 dBm, AP transmission power of 10 mW , antenna gains of 0 dB and a receiver loss of 6 dB. A 100 MHz wide channel is considered in the 5 GHz band. We assume that the APs do not cause co-channel interference to each other. The path loss is calculated by means of a recursive dual slope model used for street path loss calculations in micro-cell environments taken from [11]. The coverage area of an AP is defined by the distance where a minimum SNR can be achieved, according to the minimum data rate of 100 Mb/s. For SNR values higher than the minimum SNR the data rate will be directly given by Shannon’s capacity formula. The highest achievable data rate is assumed to be limited to 1 Gb/s. Shadow fading is modelled as a random variable with a log normal distribution with 0 dB mean and a standard deviation of 10 dB as in [12]. We assume that the shadow fading will
Session Off Time Nr. of Pages per Session
Distribution Exponential Log-normal
Time between Pages
Gamma
Page Size
Pareto
Parameters Mean = 18195s Mean= 25.8 , Std.= 78.7 Mean = 35.3 s, Std.= 147.3 s Mean = 40.1 KB, Std.= 19.5 KB
We choose an LRU policy for removing items to make room for the new ones since in the access distribution model the recently used items dominate. The simulation is based on snapshots and is implemented in MATLAB environment. We chose the duration of one snapshot to be 1 second and we simulated always 20000 snapshots. The figure 3 illustrates the method.
Request
yes Item new? no Count as hit & Add an updated version of the item to the top of the cache
no Data rate==0
Count as hit & Add the new Item to Cache
yes Hit miss
no Data rate==0 yes yes Item updated?
Count as hit & Place the item to the top of the cache
no Hit miss
Fig. 3. ratio
Description of the simulation methodology for computing the hit
Update of the cache memory is carried out each time the user passes through coverage. The process of updating the cache memory begins with the last item referenced in the cache towards the items referenced older in the cache. If the duration in coverage is not sufficient enough then all items might not be able to be cached. We will use the term refresh rate to denote the time intervals in which items should be synchronized in order to keep them up-to-date. In the simulations there is an initial transient phase starting from when the cache is empty until the cache is filled. This period is discarded from the analysis.
4
0.45
V. R ESULTS
Walk Through (refreshrate=900s) Drive Through (refreshrate=900s) 0.4
0.35
Gain in Hit Ratio
Figure 4 presents the hit ratio values for a simulation when the validity period of the items in cache is limited to 1800 seconds. The time spent in the coverage area of an AP combined with high available data rates suggests that cache is fully updated at every passage, even for the case when its size is 2000 items (approx. 80 MB). The difference between the curve without caching and the others is maximum for an effective coverage area of 20 to 30% and then we notice a linear behaviour. This is consistent with our simple analytical model and it can be easily checked if xc is larger than d/2. That is, when the effective coverage approaches 30% of the total area the travel time from one AP to another is less than the validity period of the cache, hence cached items are always updated. As the present user activity becomes less dependent from past activity, caching a huge amount of items will not increase the hit ratio significantly.
0.3
0.25
0.2
0.15
0.1
0.05 0
10
20
30
40
50
60
70
80
90
Area Coverage (%)
Fig. 5. Difference in the gain in the hit ratio between the walk-through and drive-through scenarios for a cache size of 50 items and refresh rate of 900s 0.45
1
refresh rate = 900s refresh rate = 1800s refresh rate = 3600s
0.4
0.9 0.35
0.8
Gain in Hit Ratio
0.3
0.7
Hit Ratio
0.6 0.5
0.25
0.2
0.15
0.4 0.1
0.3
Without Caching Finite Cache (2000 Items) Finite Cache (1000 Items) Finite Cache (50 Items)
0.2 0.1 0 0
0.05
0 0
10
20
30
40
50
60
70
80
90
Area Coverage (%) 10
20
30
40
50
60
70
80
90
Area Coverage (%)
Fig. 4. Hit ratio as a function of the area coverage and different cache sizes. Refresh rate is 1800 s.
The difference between walk-through and drive-through scenarios is shown in figure 5. We plotted the gain in the hit ratio due to caching, in other words the difference in the hit ratio with and without caching. It can be noticed that for the drive-through scenario there is almost no practical limitation introduced by the validity period of the cached items, while for walk-through an effective area coverage of 30% is already enough for ensuring an always updated cache memory. We also simulated three different refresh rates for a walk through scenario in which the user’s mobile device can cache up to 50 items. The obtained results show the same effect in the case of increasing cache size as in the case of increasing the speed of the mobile terminal. VI. C ONCLUSIONS AND F UTURE W ORK We have shown that for a mobile user running a web browsing application caching visited web pages in the user terminal helps hiding some of the coverage discontinuities specific to a sparse infrastructure wireless system. An interesting result is that for a 30% effective area coverage the perceived user coverage, namely the hit ratio, approaches 65 to 80%, depending on the assumed values for cache size
Fig. 6. The Gain in the Hit Ratio for different Refresh Rates for a Cache Size of 50 Items in the Walk-Through Scenario
and refresh rates. This suggest the possibility for providing a very good service, if the unsuccessful hits were served by an overlaid cellular like system designed for low capacity, but full coverage. As we increase the density of APs the required capacity of the cellular becomes lower, so as its cost. If we assume that the network of APs is low cost, similar to today’s WLAN, there should exist a minimal cost solution for a hybrid hotspot-cellular system. R EFERENCES [1] A.L. Iacono, “Mine, mine, mine: Information Theory, Infostation Networks, and Resource Sharing ”, in Proceedings of the Wireless Communications and Networking Conference, WCNC, 2000. Vol.3, Pages:1541-1546. [2] U. Kubach,K. Rothermal, “Exploiting Location Information for Infostation-Based Hoarding”, In Proceedings of the 7th Annual Internation Conference on Mobile Computing and Networking, 2001. Pages:15-27. [3] T. Ye, H.A. Jacobsen, R. Katz, “Mobile Awareness in a Wide Area Wireless Network of Infostations”, in Proceeding of the 4th Annual ACM/IEEE Internation Conference on Mobile Computing and Networking, 1998. Pages:109-120. [4] C. Baquero, “MobiScape: WWW Browsing under Disconnected and Semi-connected Operation”, In Proceedings of the First Portuguese WWW National Conference, Portugal, 1995.
5
[5] L. Tauscher, S. Greenberg, “Revisitation Patterns in World Wide Web Navigation”,in Proceedings on the SIGCHI Conference on Human Factors in Computing Systems, 1997. Pages:399-406. [6] A. Adya, P. Bahl, L. Qiu, “Application Level Performance: Analyzing the Browse Patterns of Mobile Clients”,In Proceedings of the First ACM SIGCOMM Workshop on Internet Measurement, 2001. Pages:189-194. [7] N.K. Shankaranarayanan, Z. Jiang and P. Mishra, “User Perceived Performance of Web-Browsing and Interactive Data in HFC Cable Access Networks”,ICC 2001, IEEE Internation Conference. Vol.4, Pages:1264-1268. [8] L. Breslau, P. Cao, L. Fan, G. Philips, S. Shenker, “ Web Caching and Zipf-like Distributions: Evidence and Implications”, Eigthteenth Annual Joint Conference of the IEEE Computer and Communications Societies, Proceedings, 1999. Vol.1, Pages:126-134. [9] ETSI, Universal Mobile Telecommunication System (UMTS), “Selection Procedures for the Choice of Radio Transmission Technologies of the UMTS”,Technical Report TR 101 112 v3.2.0 (1998). [10] R.D. Yates, N.B. Mandayam, “Challenges in Low-Cost Wireless Data Transmission”,Signal Processing Magazine, IEEE, May 2000. Vol.17, Pages:93-102. [11] J.E. Berg, “A Recursive Model for Street Microcell Path Loss Calculations”, Proceedings of PIMRC’95. Vol.3, Pages:140-143. [12] M. Berg, “Radio Resource Management in Bunched Personal Communication Systems”,Doctorate Thesis, TRITA-S3-RST-0201, Royal Institute of Technology, Stockholm, Sweden, March 2002. [13] M. Gudmundson, “Correlation Model for Shadow Fading in Mobile Radio Systems”,Electronics Letters,1991, Vol.27, No:23, Pages:21452146. [14] A. Reyes-Iacono,E. Gonzalez-Parada, E. Casilari, J.C. Casasola, A. Diaz-Estrella, “A Page-Oriented WWW Traffic Model for Wireless Systems Simulations”, In Proceedings of the 16th International Teletraffic Congress (ITC’16), Edinburgh, United Kingdom, 1999.