first is the rather well known Moodle environment (http://moodle.org). The second is ... E. Tomadaki and P. Scott (Eds.): EC-TEL 2006 Workshops, pp. 362-368 ...
Evaluation of Virtual Learning Environments Using Logs and Social Networks Vlad Posea1, Dan Mihaila1, Stefan Trausan-Matu1,2, Valentin Cristea1, and Alexandru Gartner1, 1
“Politehnica" University of Bucharest, Computer Science Department 313, Splaiul Independentei Bucharest, Romania {vposea, dan.mihaila, trausan, valentin}@cs.pub.ro 2 Romanian Academy Research Institute for Artificial Intelligence 13, Calea 13 Septembrie Bucharest, Romania
Abstract. The paper presents an evaluation method for e-learning platforms, based on different types of measurements collected in logs of interactions during learning sessions, and on the analysis of collaborative learning activities performed using social networks visualization of the relations established among users during the experiments. The evaluation was used to highlight the ease of access to different platforms' resources in two case studies: Sintec and Moodle. Problems encountered during the evaluation and possible solutions to be considered in future work (in the FP6 Cooper project) are also presented.
1 Introduction In order to evaluate the environments to be used for e-learning, a number of criteria have been defined (e.g. [9]). Two major approaches may be identified: evaluate the platform's capabilities [4], [5] and evaluate its actual usage in a real working environment by analyzing the learners' behaviors and results [11], [13], according to given benchmarks [12]. The second approach is very important in the context of communities of practice and collaborative e-learning environments, where the evaluation should mainly determine the ease of access to shared resources, and the support offered to collaborative activities. Following these ideas, the paper presents a comparative evaluation of the usage of two learning environments, based on analysis of time and frequency aspects and logs and on visualization of social networks. The first is the rather well known Moodle environment (http://moodle.org). The second is the knowledge-based collaborative learning system Sintec [15], developed at the National Center for Information Technology (NCIT) in the University “Politehnica” of Bucharest (UPB). The paper is organized as follows. Section 2 presents the evaluation of the two platforms using logs analysis from time and frequency perspectives. The analysis E. Tomadaki and P. Scott (Eds.): EC-TEL 2006 Workshops, pp. 362-368, 2006.
Evaluation of Virtual Learning Environments Using Logs and Social Networks
363
aims to find how effectively are the learners using the platforms and to possible identify some improvements. Section 3 presents an evaluation of platforms' collaborative tools, based on visualization of social networks. The problems identified during the experiments, some possible solutions, and several conclusions for improving the evaluation method are reported in Section 4.
2 Evaluation using time and frequency-based log analysis In our experiments, we were interested to evaluate the ways actors (students, teachers, editors) are using the Sintec and Moodle platforms, and to derive some reference results that could be used in the comparative analysis with other platforms. We will firstly consider the differences between the way Sintec and Moodle were used for reading the learning documents on the web. These differences are due to the following factors: (1) in Sintec, the learning materials were all uploaded from the start of the class, while in Moodle, the materials were uploaded gradually; (2) in Moodle, students and teachers used also the collaborative tools, while in Sintec they did not. Using the log records of the activity of 69 students for Sintec and 248 students for Moodle, several indicators (discussed also in [10]) were computed. It is remarkable that, even if the number of indicators was not high and some of them were not available on both platforms, several conclusions can be drawn about the way platforms were used. Table 1. The most important evaluation indicators for the Moodle and Sintec experiments (“NA“ – not available – means that the indicator couldn't be calculated because the logs weren't explicit enough or because the feature wasn't used for teaching that course)
Indicator Average time spent / page (seconds) Median of the times spent per page Average time / session Median of the times spent / session Average time spent on the platform (seconds) Relative frequency of the home page Average number of hits / page Percentage of users that posted in forums Number of posts / user Number of posts / topic Length of reply (words)
Moodle 61 45 297 NA 13571.5 33% 409 0.564 2.02 1.74 28
Sintec 21.24 NA 1635 952 4466 23.3% 284 NA NA NA NA
The average time per session was influenced by the way course materials were loaded on the platforms. It reflects the fact that, in Moodle, where the materials were uploaded incrementally, the students accessed more often the web site. They logged once a week to download or read the newest materials, while on the Sintec platform they mostly downloaded all the materials at once. This indicator together with the
364
V. Posea et al.
number of logins can suggest how to improve the process of posting resources on the learning platform. It is better to post resources periodically in order to encourage students to log in more often, be more active in the class, use more intensively the communication tools, and easier stay in touch with the latest news posted by the tutors. The time spent per page was strongly affected by the relative frequency of accessing the home page. The value of this indicator (relative frequency) is extremely high. It shows that users had troubles with using the interface, because they had to return too often to the home page in order to find another page of interest. This is also showed by the combination between the average time spent per page and the median of the times spent per page. This difference shows that there are many intermediate pages browsed very fast by the user just in search for relevant pages. These indicators also suggest possible improvements in the platform. For example, the results show that the resources need to be re-organized in a different way. One solution would be the use of a tree-menu to allow most of the resources to be accessed from one page or from a few pages. Another way to improve these indicators is also the integration of a recommender system to lead directly to the page of interest. In the experiment with Sintec, no logs of the collaborative tools were recorded and, therefore, no such indicators were computed. In the case of Moodle, the forum collaborative tools were available to students but their use was not mandatory or even rewarded. The very small number of posts per user and especially the number of replies shows that the students preferred alternative communication channels. Even so, the average length of the posts shows that the replies given were rich in content. In conclusion, even if users have used the 2 platforms differently, by using the methodology and the proposed indicators, we could draw an important number of conclusions.
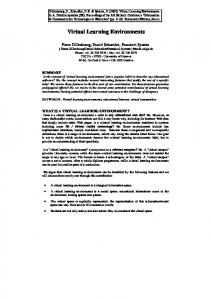
3 Evaluation of collaborative tools using visualization techniques Several techniques may be used for analysing the activity of the users in a forum, for example, sorting messages by author, date, and subject. Another approach is focusing on the convergence of the multiple threads that characterizes the weaving messages (this model is used in the Moodle’s forum). Graphical visualization techniques are extremely useful in various domains. Such an approach may be used also in the evaluation of collaborative tools. The idea is to generate a graphical view representing the social network [14] of the collaboration starting from the usage logs of a VLE (Virtual Learning Environment). The social network depicts actors’ relationships and presents a perspective of their social context. The nodes of the network represent actors (teachers and students) and the arcs represent the interaction between them. This type of network is essential for understanding social dynamics [14]. In our approach, the graphical representation of the social networks was generated from the Moodle logs using the Graphviz tool (http://www.graphviz.org/). Figure 1,
Evaluation of Virtual Learning Environments Using Logs and Social Networks
365
which illustrates the social network of one of the forums, represents some actors who interact through messages: they initiate a thread or post reply-messages in that thread. There are five actors that had at least three reply-messages from the others. Their nodes are grey-filled. In our scenario, the actor with the id “2” is a teacher. He started a thread and many other actors responded to that message. A reply message from an actor to another actor’s message is represented through an oriented edge from the first one to the second one.
Fig. 1. View of a part of a social network, generated from the logs of the Moodle’s forum. Dotted lines represent one message (reply), normal lines represent two or three messages (replies), and bold lines represent a number of messages (replies) greater than four.
For analysing the social network generated from the Moodle’s logs, we considered several indicators. First, we used the “location” of the actors in the network, measuring the centrality of a node [2]. This feature helps to determine the importance or prominence of an actor in the network. In our scenario, the node with the id “2”, which is a teacher, has an important role in the graph. He initiates threads, posts messages and reply messages to the others. There are other nodes, coloured in grey, which have an important activity in the forum. We will see below how centrality and centralization help to analyse if there are “strong” connected teams among the students and the important role of the teacher in the communication process. Table 2. The most important indicators for the actors in the social network in Figure. 1 Indicators/Actors Centrality Density
2 17 0.85
8 3 0.15
14 3 0.15
32 5 0.25
68 3 0.15
Density represents other indicator, describing the general level of cohesion in a social network or the number of different people the actor interacts with [2]. The average density being low shows that students do not interact within the platform. Density is higher for the teacher meaning he keeps in touch with his students. Another aspect of social networks that we found useful for our evaluation is network reach [1]. It is important for social aspects to see if an actor gets the information directly from the main actors (teachers, project managers) or if this information is got indirectly from peers. In our scenario, the length of the largest path is two, but
366
V. Posea et al.
the predominant path has the length one. This means that students interact directly with the teacher, and that, either they do not ask questions to peers, or there is no other competent peer to answer their questions or problems. One challenging task is to select the most relevant peers and their appropriate answers for an actor, which has a problem to solve. In [6], problems like “what is relevant?” or “to how many peers should we send the query to achieve optimal results?” are studied and three criteria of selection rose: connectivity-based selection, reputation-based selection, similarity-based selection. To achieve the goal of selection of a competent peer, we need to compute another indicator, centrality eigenvector [3]. This metric, used in [8] for web page ranking, and studied in [7] for trusted e-mail addresses, is very difficult to apply to the actors in our approach. For example, if a page links to a good (trusted) page, it is a candidate for having a high rank as well [8], but in our case, if an actors replies to an actor with a high rank (maybe teacher) means nothing. However, if a highly ranked actor replies to a normal actor, he might be a candidate for achieving a greater rank. In our future work, we will include in considering these replies a semantic context, which it will help actors to receive a greater rank and to become a competent peer. As we have seen above, the teacher has the highest rank in our scenario and this rank is built on the ranks of the other actors. The centralization [16] of the network shows that the teachers communicated well with the students but also shows that there aren't strong teams in the group of students because the network is centralized around the teacher. This is confirmed by the cohesion [16] indicator which shows that we can't identify groups larger than three people, one of them being a teacher. That shows that the learning process wasn't team-oriented or, if it was, the teams were not working well together or they were not using the platform features. In conclusion, the social networks can provide a large numbers of indicators that offer information about the way students and teachers collaborate in the learning process. These indicators can and might be correlated with indicators obtained from questionnaires and logs.
4 Conclusions and future work This paper presents the results of an ongoing research on the evaluation methods for e-learning platforms. The evaluation proposed here is based on different types of measurements collected in logs during learning experiments, and makes use of social networks. The method could be used in the design and evaluation of e-learning platforms. It is thought to be used in evaluating the Cooper platform that is a collaborative, project-oriented e-learning environment under development in the STREP EU project with the same name (http://www.cooper-project.org ). In this respect, one important aim of our research is to establish a proper evaluation methodology, and to gather data from other systems for a comparative analysis. Another purpose of evaluating the usage of several e-learning platforms is to establish some benchmarks for the indicators we will measure in the Cooper platform,
Evaluation of Virtual Learning Environments Using Logs and Social Networks
367
and to identify what other logging mechanisms are needed in order to obtain more significant evaluation indicators. An important aim of the evaluation is the improvement of e-learning environments by eliminating the detected drawbacks. As discussed above, one of the major issues concerning Moodle is the long length of the paths that users followed to reach a useful web page. The use of a Recommender Service (also a main idea of the Cooper project) would be extremely useful in providing shortcuts to different resources. Acknowledgements This work was partially done under the FP6 projects COOPER (www.cooper-project.org) and EU-NCIT (http://euncit.hpc.pub.ro)
References 1. Albert, R., Barabasi, A.-L.: Statistical mechanics of complex networks. Rev. Mod. Phys. 74 (2002) 47–97 2. Anklam, P.: KM and the social network. In Inside Knowledge, Vol. 6, Issue 8. (2003) 3. Bonacich, P., Lloyd, P.: Eigenvector-like Measures of Centrality for Asymmetric Relations. Social Networks, http://www.sscnet.ucla.edu/soc/faculty/bonacich/Asymmet.pdf [Accessed April 2006] (2001) 4. Business Readiness Ratings for Open Source: A Proposed Open Standard to Facilitate Assessment and Adoption of Open Source Software http://www.openbrr.org/docs/BRR_whitepaper_2005RFC1.pdf [Accessed April 2006] 5. Business Readiness Ratings for Open Source: Assessment Sample for Moodle http://www.openbrr.org/docs/BRR_Worksheet_25Jul05_Moodle.xls [Accessed April 2006] 6. Chirita, P.A., Damian, A., Nejdl, W., Siberski, W.: Search Strategies for Scientific Collaboration Networks. L3S Research Center, University of Hannover. Publications site (2005) 7. Chirita, P.A., Diederich, J., Nejdl, W.: MailRank: Using Ranking for Spam Detection. L3S Research Center, University of Hannover. Publications site (2005) 8. Chirita, P.A., Olmedilla, D., Nejdl, W.: PROS: A Personalized Ranking Platform for Web Search. L3S Research Center, University of Hannover. Publications site (2003) 9. EduTech LMS Evaluation - http://www.edutech.ch/lms/ev3/ [Accessed April 2006] 10. Juvina, I., Trausan-Matu, S., Iosif, G., van der Veer, G., Marhan, A.M., Chisalita, C.: Analysis of Web Browsing Behavior - A great potential for psychological research. In Pribeanu, C., Vanderdonckt, J. (eds.): Task Models and Diagrams for User Interface Design. Proceedings TAMODIA 2002. INFOREC Publishing House, Bucharest (2002) 11. Markham, S., Ceddia, J., Sheard, J., Burvill, C., Weir, J., Field, B., Sterling, L., Stern, L.: Applying Agent Technology to Evaluation Tasks in E-Learning Environments. Proceedings of the Exploring Educational Technologies Conference, Monash University, Melbourne, Australia July 16-17, 31-3 (2003) 12. The Institute for Higher Education Policy: Benchmarks for Success on Internet-Based Distance Education (2000) 13. The University of Iowa: CMS Selection methodology http://www.uiowa.edu/~provost/elearning/cms_selection/ [Accessed April 2006] 14. The University of Melbourne: What is a social network? - Network-based behavioural, social and policy processes -
368
V. Posea et al.
http://www.psych.unimelb.edu.au/cnss/assets/process_summary.pdf [Accessed April 2006] 15. Trausan-Matu, S., Cristea, V., Udrea, O. (eds.): Intelligent e-Learning (in Romanian). PolitehnicaPress, Bucuresti (2005) 16. Wikipedia – Social Networks - http://en.wikipedia.org/wiki/Social_network [Accessed April 2006]