Jan 25, 2017 - [11] K. Figl, J.C. Recker, J. Mendling, A study on the effects of routing ... [27] H. Leopold, J. Mendling, A. Polyvyanyy, Supporting process model ...
Author’s Accepted Manuscript Design and Evaluation of Virtual Environments Mechanisms to Support Remote Collaboration on Complex Process Diagrams Erik Poppe, Ross Brown, Jan Recker, Daniel Johnson, Irene Vanderfeesten www.elsevier.com/locate/infosys
PII: DOI: Reference:
S0306-4379(16)30048-5 http://dx.doi.org/10.1016/j.is.2017.01.004 IS1197
To appear in: Information Systems Received date: 10 February 2016 Revised date: 25 January 2017 Accepted date: 26 January 2017 Cite this article as: Erik Poppe, Ross Brown, Jan Recker, Daniel Johnson and Irene Vanderfeesten, Design and Evaluation of Virtual Environments Mechanisms to Support Remote Collaboration on Complex Process Diagrams, Information Systems, http://dx.doi.org/10.1016/j.is.2017.01.004 This is a PDF file of an unedited manuscript that has been accepted for publication. As a service to our customers we are providing this early version of the manuscript. The manuscript will undergo copyediting, typesetting, and review of the resulting galley proof before it is published in its final citable form. Please note that during the production process errors may be discovered which could affect the content, and all legal disclaimers that apply to the journal pertain.
Design and Evaluation of Virtual Environments Mechanisms to Support Remote Collaboration on Complex Process Diagrams Erik Poppea, Ross Browna, Jan Reckera, Daniel Johnsona, Irene Vanderfeestenb a b
Queensland University of Technology, 2 George St, Brisbane, Qld 4000, Australia Eindhoven University of Technology, P.O. Box 513, 5600 MB Eindhoven, Netherlands
Abstract: Many organizational analysis tasks are solved by collaborating teams. In technology-mediated collaborations, enabling relevant visual cues is a core issue with existing technology. We explore whether avatars can provide relevant cues in collaborative virtual environments. To do so, we develop a research prototype for a collaborative virtual environment that utilises avatars to improve workspace awareness in collaborative tasks. We test this solution through two studies, qualitative and quantitative, in which participants have to collaborate to jointly validate and correct a diagrammatic model of operational procedures. Our evaluations provide both positive and negative results about the proposed prototype. Collaboration patterns changed and became significantly easier, but, task performance was only slightly improved. Together, these findings inform both the ongoing development of collaborative 3D virtual environments and the role of technology-mediated collaboration for validating and fixing models of processes.
Keywords: Computer-Supported Collaborative Work; Collaborative Virtual Environments; BPMN; Design Research; Experiments, Process Validation
Introduction In face-to-face collaboration, participants usually share an understanding of what is happening in the shared work-space. For example, people working together around a table can tell what everyone else is looking at, whether they are currently performing an activity related to the task at hand and
whether they agree with a chosen course of action just by looking at their collaborators. In this setting they have an “up-to-the-moment understanding of another person’s interaction with the shared workspace” [1], which enables them to integrate their actions seamlessly with those of other collaborators. In technology-mediated collaboration, e.g. in virtual teams, however, it is difficult for collaborators to maintain high levels of awareness because relevant visual cues are missing [1]. Providing information about what a collaborator is currently doing or intends to do shortly, is therefore a core issue for collaborative technology. Collaborative virtual environments (CVEs) have been put forward as a way to overcome this problem [2]. CVEs are three-dimensional spaces in which participants can communicate, share objects and collaborate on work tasks [3]. While they have been investigated by both academics and industry as a technology for remote collaboration [4], empirical evidence as to if and how these virtual environments provide benefits for collaboration is still very limited [5]. We argue that avatars, which are digital representations of human users in a virtual environment [6], can provide visual cues that provide awareness about the user’s focus of attention and their locus of operation, which would otherwise be absent and thereby impede collaboration. To study this assertion, we develop a novel prototype of a CVE solution that includes avatars and evaluate it through two empirical studies. As a relevant collaboration scenario we focus on Business Process Management (BPM), which is a popular management method to identify, document, analyse and improve an organization’s business processes to increase productivity, achieve operational excellence or save costs [7]. A fundamental task of BPM is the creation of models of the current or future state of an organization’s processes, an activity called process modelling [7,8]. Process models are created to document the shared understanding that a group of stakeholders has about an operational procedure. To ensure that any created process model in fact denotes the shared understanding, process modelling involves an important task called process validation, where relevant stakeholders (often domain experts, modelling experts, process managers or simply staff members typically executing
the process) inspect the process model, identify any errors in the model and if identified, resolve these errors until everyone agrees on the model of the process [9,10]. It is this task, process model validation, that we chose as the organizational analysis setting in which we examine our novel CVE avatar technology. We did so for three main reasons: 1. Process modelling is a key and popular organizational problem-solving activity [11]. Yet, the existing literature on process modelling has, to date, predominantly focused on process model design, with little attention given to process model validation even though the importance of this task is widely acknowledged [9,10,12]. 2. Process model validation in particular is an inherently collaborative activity involving multiple domain and method experts from various organizational domains [13]. This is because this task sets out to achieve shared understanding by stakeholders with varied backgrounds and expertise. It also involves two different collaborative activities: identification of errors (an analytical task) and resolution of errors (a creative problem-solving task), thus providing ample opportunities to examine collaborative behaviour. 3. Collaboration support for process modelling overall remains a core issue for practitioners [14] and existing technology is often inadequate [15]. Research on a novel technological solution, therefore, will advance knowledge substantially. Within this setting, our research objectives are as follows: -
We will examine how to design a virtual environment that (a) allows for both collaborative process model diagram creation and validation, and (b) provides means for visual cues for collaboration (particularly by featuring avatars).
-
We will explore how the presence of avatars influences collaboration among teams performing diagram validation activities.
-
We will examine through empirical evaluation how visual cues impact on collaborative problem-solving efficacy, i.e., the effectiveness and efficiency of process model diagram validation.
We proceed as follows: first we will review the literature on collaborative technology. Then, we focus especially on collaborative virtual environments and the role of visual cues for collaboration. A review of current technology support for collaborative process model validation, our chosen organizational analysis setting, is then presented. Following on, we summarize the design of our research, and describe the prototype software solution. We then report on our qualitative exploration and quantitative evaluation. Our paper then concludes with a list of contributions, implications and limitations.
Background Visual cues in Computer-Supported Collaborative Work In a collocated collaboration, shared artefacts and the bodies of other collaborators in the immediate environment provide information that collaborators rely on to communicate with others and coordinate their actions [16]. In technology-mediated collaboration, however, this kind of information is difficult to sense, transmit and display to other people, for three main reasons [1]: 1. Input and output devices provide much more limited perceptual information than what is generally available in a face-to-face situation. For example, in a real-world situation a person can look around an environment and get closer to objects of interest, such as a document on a table, to read it, whereas in a video conference they have a static perspective and resolution and therefore cannot look around or move it closer when required. 2. Technology-user interactions generate less distinct information than a face-to-face interaction. For example, browsing a web page, searching for a file or playing a card game on a computer observed from the outside (e.g., a webcam) will only be visible as the user moving a mouse and clicking. 3. Collaborative technology often does not display all awareness information that is available. For example, while an application providing shared document editing (e.g. Google Docs) is aware of
which part of the document the users can see on the screen, it does not show other users what is visible to someone else. In theory, however, collaborative technology could transit such information by means of visual cues, viz., configurations of visual elements in the environment that can be used to gain awareness information. There are arguments available to support the assumption that visual cues would indeed be an appropriate mechanism. For example, Gergle, Kraut & Fussel [17] demonstrated that shared visual cues facilitate coordination by supporting awareness and common ground. These cues in turn led to improved collaboration performance. Kraut, Fussell and Siegel [18] showed that visual cues about participants’ heads and faces, bodies, actions, shared objects and work context supported the monitoring of task status and people‘s actions, the establishment of a joint focus of attention, the creation of efficient messages, and the assessment of comprehension.
Collaborative Task Setting: Validating Process Model Diagrams Visual cues are by nature context specific, so it is logical to examine them within a particular collaborative task setting. We chose process model diagram validation [9] as this task setting. The validation of conceptual diagrams is critical in several areas, such as theoretical models in research [20], models used in software engineering [21] and physical models in engineering [22], to name just a few. Process model diagram validation is also a core task in BPM: To manage business processes, it is important to identify and document the key processes of a business in order to generate a shared understanding of current or future business processes envisaged to be supported or enacted by information systems [7]. These process model diagrams need to be verified and validated to ensure that they represent relevant features of reality accurately [19]. Problems specific to process models can occur, for example, due to individual interpretations of vocabulary and underlying assumptions that are not shared between all the stakeholders of a process [9]. Model verification is performed to ensure syntactic correctness of the model and for process models this is often done by checking formal properties of the model such as soundness, i.e., that the process can complete under all modelled circumstances, that for every activity modelled there is at least one
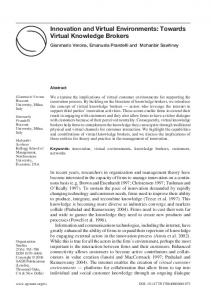
instance where it can be executed and that no activities can be executed after finishing the process [23]. Model validation is concerned with ensuring that the process described by the model is an accurate representation of the real process [24], for example, by making sure that activities that always occur in a fixed order according to the model are indeed executed in this order only. While verification can be done mostly automatically by current modelling tools [25], validation generally requires domain knowledge, often in the form of tacit knowledge, and thus requires the involvement of domain experts [9]. Numerous approaches have been proposed to effectively bridge the gap between the informal mental models of the process being modelled in the minds of stakeholders and the formal process model and therefore increasing their validity, including the use of controlled language, gamification [26] and converting formal models back to textual descriptions [27]. Often, the involvement of stakeholders for model validation is expected to be iterative throughout the creation of the model [28] and the involved stakeholders participate in a dialogue in which statements about the process being modelled are proposed, withdrawn, accepted, rejected, argued for or argued against with domain knowledge existing across the stakeholders [10,12]. In practice, therefore, process model validation is mostly done in workshops where the stakeholders are situated around a print-out or projection of the process model and are guided by experienced facilitators [19,29]. The bodies of every workshop participant provide a variety of visual cues that indicate a) who is present, b) who is working together with whom and c) who is working on which part of the model (Figure 1). They therefore support awareness of the process component currently being discussed.
Figure 1: Process model diagram validation in a co-located workshop setting
Since these bodies can be seen by everyone, they can be used for non-verbal communication. By gesturing and changing gaze locations, the discussion can be regulated, structured and illustrated. Nodding can be used to provide feedback to the speaker without interrupting. Pointing enables direction of the joint focus of attention and therefore allows for more efficient referencing of model parts and locations. Direct manipulation of the process model can serve as evidence of communication success or failure and as an indication of task status. Furthermore, posture and facial expression can give information about the state of the task (person A is unsure, person B is unhappy, so we have not reached consensus yet, see Figure 1) and the state of participants (person A is confused because he has not found the model element under discussion in the model, person C is day dreaming and not actually participating in the validation). Visual cues provided by the stakeholders’ bodies can therefore facilitate communication and coordination in collaborative process model validation. It is therefore relevant to investigate how these processes can be supported adequately, when the stakeholders are globally dispersed, as is often the case in large companies. In the next section, the support for collaboration that existing modelling tools provide will be discussed.
Tool Support for Collaborative Process Model Validation Much like process modelling itself, process model diagram validation can be done using paper and pencil [30], but most often software tools are used. Over recent years, advanced tools have been
made available that provide collaboration support, for instance, through advanced visualization features [31]. Computer-supported prototypes that attempt to improve collaboration and stakeholder involvement in process modelling have been created by academics [13,31,32] and commercial solutions are starting to integrate collaborative features, such as live sharing and editing of process models between multiple users, as well. Still, in their reviews Mendling et al. [15] and Riemer et al. [33] found the support for collaboration across BPM tools overall to be low and fragmented. Poppe et al. [34] found that current tools vary in their support for visual cues, as defined by the taxonomy in Kraut et al. [18], and in particular, lack support for cues related to the bodies of collaborators. We reuse the criteria from this taxonomy in our evaluation below. Table 1 summarizes the evaluation of tool support for visual cues related to the body for seven tools commonly used in industry and academia. We selected the tools by analysing the tools included in the reviews above [15] [33], together with empirical reports on the most popular modelling tools in practice [35] and correlated these with a Gartner report on leading tools in the BPM market [36]. Our ambition was to be illustrative rather than exhaustive. To illustrate how the different levels of support shown in Table 1 have been determined, an example for each of the three levels will be discussed in the following. A1 – Facial expression can be used to identify team consensus. This visual cue has been determined as fully supported, because both ARIS and ProcessWave support video chat. The facial expression of remote users can be seen in the video chat window, and conclusions about their attitude towards the proposition being discussed can be drawn. This can be used in the same way as in a collocated collaboration. D2 – Gestures can be used to illustrate and refer to task objects. This visual cue has been determined as partially supported, because the telepointer features of ARIS and ProcessWave support parts of this behaviour. For example, a user can point out a specific model element to other users, however, the range of gestures that can be performed with a mouse cursor as well their expressiveness is severely limited.
Signavio
IBM Blueworks
ProcessWave
A1 - Facial expression can be used to identify team consensus
û
û
û
û
û
ü
ü
2/7
û
B1 - Gaze direction can be used to infer intended actions
û
û
û
û
û
û
û
0/7
ü
C1 - Eye-gaze and head position can be used to establish others’ general area of attention
û
û
û
û
û
û
û
0/7
ü
D1 - Gaze can be used as a pointing gesture
û
û
û
û
û
û
û
0/7
(ü)
E1 - Facial expressions and nonverbal behaviours can be used to infer level of comprehension
û
û
û
û
û
ü
ü
2/7
û
A2 - Inferences about intended changes to task objects can be made from body position and actions.
û
û
û
û
û
û
û
0/7
ü
B2 - Body position and actions can be directly observed
û
û
û
û
û
û
û
0/7
ü
C2 - Body position and activities can be used to establish others’ general area of attention
û
û
û
û
û
û
û
0/7
ü
D2 - Gestures can be used to illustrate and refer to task objects
û
û
û
û
û (ü) (ü)
0/7
ü
E2 - Appropriateness of actions can be used to infer comprehension and clarify misunderstandings
û
û
û
û
û
0/7
ü
-
7/10
Visual Cue
Total number of Visual Cues Supported by tool
û
û
0/10 0/10 0/10 0/10 0/10 2/10 2/10
Research Prototype
Bizagi
Number of existing tools that support cue fully
SAP StreamWork ARIS Business Architect
Microsoft Visio
Modelling Tool
Table 1: Tool support of visual cues related to embodiment (û - not supported; (ü) – partially supported; ü - fully supported)
C1 – Eye-gaze and head position can be used to establish others’ general area of attention. This visual cue has been determined as not supported, because none of the tools investigated supports the described behaviour. In a collocated situation, seeing what elements of the model other people present are looking at can be used to gather awareness information of the topic of the current discussion. However, even with video chat, the relation between the gaze of a collaborator and the model objects on their screen cannot be determined. Based on this review we argue that available tools fall short of the efficient communication available in a face-to-face setting. Notably, the absence of a body in the same space as the shared process model disables a number of communication mechanisms (See B1, C1, D1, A2, B2, C2, D2 and E2 in Table 1).
Consequently, an interesting question we ask is how technology can be used to support these cues. Three research prototype process modelling tools using collaborative virtual environment technologies have been presented [31,37] and preliminary evaluations found support for their usefulness, but a definitive evaluation of the benefits of such an approach has not yet been performed. We now examine CVEs as a potential technology solution to support the use of these visual cues.
Collaborative Virtual Environments CVEs have received increasing attention over the last two decades both as a communication medium as well as a platform for collaboration. CVEs are argued to support communication, social interactions and visualisations better than traditional CSCW applications such as video conferencing or shared desktop applications, because they provide “new ways of managing and overcoming geographic and other barriers to collaboration” [6]. In CVEs, users are placed in a graphical representation of a 3D virtual space that is persistent for multiple users. In this space, users are typically represented by humanoid avatars that enable them to convey their presence, identity, location and activities to others [2] and communicate by means that depend on the spatial relationships of users and objects. The literature on avatars suggests that they reduce referential ambiguity in communication [38], i.e. it is easier to identify contextual objects that someone is talking about. They also support body-language, gestures and gaze as evidenced by people transferring social conventions [39] into virtual environments. Notwithstanding these potential benefits, the literature also states that a comprehensive understanding of the benefits and limitations of the use of avatars is still not fully developed [5]. More generally, the literature also identifies some persistent problems with CVEs, such as the often limited field-of-view provided [40] and the complexity of the interface [41]. As a result, avatars often fail to display the owners’ current activities and status reliably [42] and important awareness information is lost.
Still, a number of research projects have reported beneficial effects of space and embodiment on collaboration [43,44]. For instance, Montoya, Massey & Lockwood [44] investigated team performance in a collaborative puzzle task in the Second Life platform and found that the CVE provided unique affordances to communicate efficiently. Overall, our assertion is that collaborative process modelling and validation may benefit from CVEs, because both tasks largely depend on communication of processes between people and a shared understanding of those processes. There is already some support for this assertion in the context of process model creation: Brown et al. [31] prototyped a business process modelling tool in Second Life not unlike ours and received positive feedback from test users that employed the prototype for process modelling. What remains outstanding is a test involving model validation activities. Also, a much stronger qualitative and quantitative test of such CVE-supported process modelling tools is still required. For example, the limitations of CVEs need to be carefully considered and addressed in the design of such tools and their evaluation. We take this step.
Method We aim to answer two research questions: 1. How can visual cues related to embodiment be supported by technology in remote collaborative process model validation? 2. How are these visual cues used by collaborators in remote collaborative process model validation? To answer these questions we followed a Design Science approach [45,46]. Firstly, a design that aims to solve the problem of missing awareness information in remote collaboration was created based on kernel-theories from the relevant literature. We report on this design in the section that follows. This design then poses an answer to the first question. Secondly, an evaluation of a prototype system instantiating this design then empirically provides answers to the second question.
In determining how to best conduct the evaluation, Venable, Pries-Heje and Baskerville [47] propose a four step process to guide the evaluation of a design science artefact. These steps consist of determining the goal of the evaluation, choosing an evaluation strategy, deciding which properties of the artefact need evaluation and then designing evaluation episodes. In this evaluation, we need to answer two separate questions to demonstrate the usefulness of the proposed tool. Firstly, we need to demonstrate that it indeed supports the specified visual cues as laid out in the discussion of the tool’s design. Secondly, we need to show that these additional visual cues are beneficial to remote collaboration. To this end we executed two evaluation episodes. We chose to begin the evaluation with a formative artificial evaluation episode in the form of a qualitative experiment [48]. The aim of this episode is to observe the impact of additional visual cues on the collaboration process to gain a better understanding of the potential effects of such a system. The findings of this episode then motivated the formulation of hypotheses to be tested quantitatively in the second evaluation episode in the form of a quantitative experiment. The process of collaboration that we are studying is complex and affected by various external factors. It was therefore decided that artificial evaluations, as provided by lab experiments, would be most appropriate, since they enable greater control over these factors and would therefore be more likely to yield internally valid insights into the effects of the proposed technology on that process, at the expense of external and ecological validity.
Prototype Design We developed a solution technology for the problem at hand by identifying requirements and then creating a system design that met these requirements. We discuss each step, in turn.
Design Requirements Because we examine CVEs as a candidate technology for addressing the lack of visual cues in collaborative organizational analysis, our solution needs to address CVE as well as collaborative
technology requirements. We start by examining CVE requirements for input and output capabilities, by relating requirements to the scientific knowledge available in the literature. Firstly, the system should be able to visualize the artefact that people try to collaborate on persistently for all collaborating users. This enables support for visual cues created by shared task objects. Secondly, users of the system should be visually represented as well [2,49]. Both visualisations of local and remote users should faithfully represent the user’s view into the environment and their interactions with any object or user in the environment [42]. This enables visual cues that allow other users to monitor current activities and anticipate future actions of their collaborators. Thirdly, the virtual space should be visualized seamlessly to provide a persistent relationship between the users’ representations and the artefact, so that an object can be referenced by pointing at it. 3D virtual environments support such interactions better than 2D environments [50,51]. Furthermore, the visualization of space should provide landmarks that facilitate orientation and navigation [52]. On the input side Bowman and Hodges [53] identify four categories of interactions that users need to be able to perform in virtual environments. Accordingly, users need to be able to navigate the virtual space, select and manipulate virtual objects and issue commands. Next, task specific functionality is required to enable users to model processes in the virtual environment together. Pinggera et al. describe a basic list of manipulations of model elements during process modelling [54]. These manipulations include adding and deleting nodes and flows (edges) and layout and labelling of nodes and edges. Since the objective of the proposed tool design is to support remote collaboration, the ability of users to communicate with one another is an additional requirement. While there are many virtual environments with text-based communication, voice communication is essential for efficient communication [55]. The user should also be able to use their visual representation in that space to support communication [49].
Overall, a system that meets these requirements, which are summarized in Table 2, should be able to support remote collaboration, while providing visual information lacking in many existing collaboration tools. In the next section we will propose a system design that meets these requirements. Functional Requirement 3D Visualization of virtual space Visual representation of users in virtual space Visual representation of process model in virtual space Visual landmarks for orientation, navigation Avatar should represent users view into the virtual space Avatar should represent users interactions with the environment Users need to be able to navigate virtual space, select and manipulate virtual objects and issue commands Users need to be able to talk to remote users Users should be able to animate avatar for communication Enough virtual space to model processes of any size Process model editing operations
Source [50,51] [2,49] [52] [42] [42] [53] [55] [49] [56] [54]
Category
Output
Input
Task-specific
Table 2: Design Requirements
Design Description Based on the requirements discussed in the previous section we have developed a prototype system (see Figure 2) that supports additional visual cues compared to existing process diagram modelling tools. A video of this system is available at http://eprints.qut.edu.au/62342/. To provide an environment that is comparable to existing tools, the prototype system implements the industry standard BPMN [35] as the modelling grammar for the process diagram. The process diagram is kept in two dimensions on the floor of the environment. Users can create and manipulate model elements using a ‘drag and drop’ interface.
Figure 2: Three users discuss process model labels in the prototype modelling tool.
Remote collaboration is enabled through a server connection, which allows multiple users to create, view and edit models together. All model changes are shown immediately to all connected users. The tool allows users to communicate either via text chat or via voice communication by leveraging third-party Voice-over-IP services such as Skype or Mumble. However, our system uses a 3D virtual environment including avatars to enable collaboration when creating, validating or even redesigning process model diagrams. We selected a 3D environment over a traditional 2D environment because 3D virtual environments are built to closely mimic faceto-face interaction [42] and are generally considered to enable nonverbal behaviours (such as gaze, head nods and attentional focus) that are not supported in 2D environments (for example using video communication [51]). Such nonverbal behaviours have been shown to be desirable in collaborative settings [57] and while conclusive links between these communication features and collaboration performance have not been shown, it has been hypothesised that observed benefits of 3D virtual environments for collaboration and knowledge sharing in work settings may be an effect of these features [44,58]. Consistent with our general assertion in this paper, each user is represented by an avatar in the CVE. This is the basis for enabling body-related visual cues. By seeing the avatar, other users can see what that user can see in the diagram, as well as their focus of attention.
To enable visual cues that rely on the movement of individual body parts we developed avatar animations to provide remote users with more awareness information: 1. The head of the avatar is rotated to always follow the mouse cursor of the user, so that remote users can see the focus of attention more clearly. 2. The avatar makes a typing motion when the user enters text to edit a label in the model. 3. The avatar points at the position of the mouse cursor to direct the focus of attention of collaborators, if the user presses a key. 4. The user can activate a wave or nod gesture or a pensive body posture to enrich ongoing communication, as shown in Figure 3.
Figure 3: User representation by animated avatar (left: user triggered waving gesture; right: system triggered typing animation)
Visual Features that enable visual cue Cue in face-to-face setting Eye-gaze and head position can C1 be used to establish others’ general area of attention Body position and activities can C2 be used to establish others’ general area of attention Gaze can be used as a pointing gesture D1
D2
Gestures can be used to illustrate and refer to task objects.
Features of prototype that enable visual cue in remote collaboration The position and rotation of avatars and avatar heads show which part of the model a participant is currently viewing.
A user can move their avatars head to point at specific area or elements in the model, however, due to screen size and resolution and lack of precise control, this feature’s effectiveness is likely reduced compared to face-to-face scenario. A user can use avatar position and/or pointing gestures for efficiently referencing positions and objects.
B2
Body position and actions can be directly observed
B1
Gaze direction can be used to infer intended actions
A2 E2
Intended changes to task objects can be inferred from body position and actions. Appropriateness of actions can be used to infer comprehension
Animations on the avatar show current activities of the user, e.g. a typing animation shows that the user is currently changing the label of a task. The rotation of the avatar and avatar head shows which interactive model elements are in the view of each user. A user can monitor whether the other participants understood him, by monitoring whether their avatars move towards his position as requested or look around the diagram trying to identify the target location.
Table 3: Visual cues enabled by embodiment, deliberate and automatic animation in a shared workspace
In Table 3 we summarize how the features of the prototype tool described above translate into support for visual cues that facilitate collaborative process modelling. Specifically, the visual cues listed in Table 3 are enabled by the user embodiment in the space of the process model. Compared to existing process model diagramming tools, our prototype system provides support for seven additional visual cues related to head and body. This, in theory, should enable better communication and coordination in collaborative process modelling. In addition, the prototype system has an optional consensus mechanism. When activated, it requires all connected users to mark an element for editing, before it can be edited and approve subsequent changes to a diagram element before these changes are enacted. This is not one of the listed requirements, but was considered useful for data collection, as it makes explicit the achievement of consensus that is usually implicit in process modelling and therefore more observable.
First Evaluation: Qualitative Exploration Design As discussed, an experimental setting was chosen to allow isolation of the effect of the proposed avatar features. The discussed literature on CVEs is too general and the literature on collaborative modelling technology not sufficiently operationalized to allow for precise empirical discrimination. We, therefore, opted for qualitative, exploratory research in order to gain experience that will be helpful in formulating hypotheses for more definite subsequent investigation [59].
A challenge with testing the proposed mechanisms is, that many of them depend on a 3D environment to work and that some mechanisms also depend on other proposed mechanisms. For example, animating the avatars to enable remote collaborators to communicate using gestures is only possible due to them having an embodiment in the work space that can be animated. A direct comparison with existing (2D) tools used for process validation or collaboration in general would therefore make it impossible to isolate effects of individual mechanisms and would rather constitute an evaluation of the utility of the complete package of the mechanisms. While this would also be worthwhile to evaluate, we opted to compare the prototype tool with different feature levels, isolating possible effects of individual mechanisms. We developed a between-groups exploratory laboratory study design where different features of the prototype (and therefore different visual cues) were enabled for different experimental groups. This implements the strategy of “adjection/intensification” described by Kleining [48] for qualitative experiments. The treatments are a) virtual environment with no user representation, b) virtual environment with static avatar, and c) virtual environment with animated avatar as shown in Figure 4.
Figure 4: Treatment groups (Top-Left: No avatar treatment; Top-Right: Static avatar treatment; Bottom: Animated avatar treatment)
This design allowed us to control and manipulate our central variables of interest (visual cues through avatar representations) while allowing values of the independent variables to range over
the natural range of the participants’ experiences. These designs are relatively common in studies of process diagrams, e.g., [60,61].
Materials In each experimental group, participants had to validate a given BPMN process diagram by (1) identifying and (2) correcting errors. The diagram used in the experiment was a process model of human digestion. While this process is not a typical business process, there are several reasons for this choice. Firstly, we wanted to avoid domain bias as is common in experimental studies [11,62,63]. Using a “typical” process model such as claim processing might have led to reduced collaboration if one of the participants had high familiarity with such a domain or process. Similar to a real-world process validation scenario, we wanted participants to validate a partially familiar process. We assumed that school education and personal experience would allow participants to reason about obvious errors and potential fixes for them while leaving enough uncertainty to allow room for discussion. We also wanted to use a truly complex diagram, to encourage participants to engage and discuss semantics such that collaboration could be guaranteed. By contrast, a “typical” process diagram such as a claim processing model might have biased results if one of the participants had some familiarity with such a domain or process and individual organisations might execute such processes in different ways. We therefore developed a process model of human digestion based on a physiology textbook description of the process and validated that model with a physiology expert. The resulting BPMN diagram (see Appendix A.6) has 80 model elements and 80 sequence flows, making it a complex diagram [64]. This was important because having a complex and large process is likely to amplify referential ambiguity [17,38], viz., the possibility that elements in a model can be interpreted in multiple ways, depending on context. Therefore, the higher the referential ambiguity of the model, the more clearly the effect of visual cue support for directing focus of attention should be visible because this would allow users to identify the proper meaning of an element more readily.
We inserted a total of six errors into the diagram – three syntactic and three semantic. We designed all errors to be relatively obvious to identify so that all participants should be able to locate the errors even without detailed knowledge of the domain or of modelling syntax. For example, we inserted a deadlock and a missing start event as syntax errors, and we added an activity (“Boil chyme”) that cannot possibly occur in human digestion. All inserted errors including potential solutions (“fixes”) are provided in Appendix A.7.
Participants Participants for the experiment were recruited from students enrolled in one of the business process modelling units at an Australian public university. While a sample of convenience, the use of a student sample is appropriate for this exploratory study, as stakeholders involved in process model validation in a real-world setting can come from various roles and areas of an organisation and do not necessarily possess high levels of process modelling knowledge or expertise. Our sample of process modelling students ensured that we would have some basic and varied knowledge about process modelling, which was important so that the results would not be skewed by too little familiarity with process models, but also ensured that we would have no experienced expert either. Each participant received a $20 voucher for a local electronics shop for participation. To encourage the teams to perform well, we also offered a $100 voucher for each member of the overall best performing team. We did so because reviews suggest that financial incentives can indeed motivate better performance in judgment (agreeing on an error in a process model) and decision (identifying and implementing a model change operation) tasks [65]. In each experimental group, participants were grouped to build teams of three. The choice to use teams of three for this study was influenced by multiple considerations. Firstly, an uneven number of team members would ensure that a disagreement would require disambiguation and consensus making. Furthermore, three-way communication significantly raises the requirements imposed on the communication medium (in comparison to two-way communication), as the complexities of identifying speaker and addressee increases and turn taking needs to be much more regulated to
avoid talking at the same time [66]. On the other hand, while a larger uneven group size would also have met these requirements, since our data points are collected on a team level, increasing group size beyond three participants would have severely reduced our sample size for analysis. Teams of three therefore seemed to be the minimal size to observe issues of group communication and coordination while enabling us to recruit a large enough number of teams to expect sufficient statistical power to detect relevant effects. During the experiment, the participants could communicate only via the CVE, and could not see the other participants or their screens directly.
Procedures Each team of three students recruited was randomly assigned to one of the three experimental groups. To facilitate collaboration using the CVE technology, each participant was seated in front of a desktop computer that was running the prototype tool. While the participants were all located in the same room, each workspace was partitioned off so that they were not able to see other participants or their workspaces (e.g. computer screens) during the experiment. Each team member received a pseudonym (“Red”, “Green” and “Blue”) for the duration of the experiment, so that difficulties in remembering names would not affect the team’s communication. If the users had avatars representing them, the avatars would be in the associated colour. Each participant first filled in the pre-test questionnaire and then went through a tutorial that taught them how to use the necessary features of the modelling tool. Once all three participants finished the tutorial, they were asked to press the “Start Experiment” button in the prototype and the tool would load the prepared process model and show it to the participants. This process model contained six errors that we added to be identified and fixed by the participants. Once a participant found an error, she then needed to get every team member to mark the model element in question as an error. This required directing the other team members to the element, discussing whether it was indeed incorrect and then coordinating the marking of the element. Once all three participants marked the element, it would be unlocked and then one of the participants
would edit this part of the process. These changes then had to be approved by all team members (by pressing an “Approve” button) in order for the fixed error to be counted. During the experiment we captured the computer screens and video-recorded participants with a webcam. We also recorded team conversations. When the team agreed that they had found all the errors (or were unable to find the remaining ones), each participant had to press the “End Experiment” button and the tool would save the final process model. Then the participants were asked to fill in the post-test questionnaire and the experiment was concluded.
Data Analysis and Findings Because this initial evaluation was one of qualitative exploration, our primary interest was in how participants used the CVE prototype for collaboration under the different experiment conditions. To that end, we examined the data collected from the recording of video and audio. Data was collected from a total of nine teams for this study. In analysing this data, we proceeded as follows: We first transcribed the team conversations and identified the speaker of each utterance as either the red, green or blue participant. We then identified passages of the conversation where the participants made use of contextual information. We then investigated the screen recording at the given time for the participants involved in the discussion, to identify visual information that they might have drawn upon to support their conversation. After identifying all situations in which groups used visual information to support their communication, we identified similar situations in the conversations of teams that had less visual cues available to see how the missing information affected their communication strategies. R R R B R R B
So, guys, I am really sorry... ...which one do you think is the wrong one...? ...at the beginning? This one...that I am standing on. That one? That's an And-Join? Yeah.
B G
Whereabouts are we, sorry? In Large Intestine.
B G B G B G R
Yeah. The XOR-Split. Uh-huh. ...before Absorb Water and Absorb Salts... Uh-huh. ...should that be an OR-Split? Uh, no. Technically, I think, it should be an
G
AND. Yeah, okay.
Excerpt 1: Team with avatar (left) vs. Team without avatar (right) trying to reference a model element
Based on this analysis, we suggest our data provides some support for our predictions with regards to communication efficiency. We identified several instances of participants a) making active use of the avatar feature for communication or b) adjusting their communication methods to compensate for missing features. One example of communication behaviours that avatars were used for is the referencing of model elements and locations, as shown in Excerpt 1. In this example, three members, Red (noted by R), Green (G) and Blue (B) discuss a potential error in the process model. Red is unsure which element the team is currently discussing. Blue tries to direct Red’s attention to the element in question by moving his avatar there and stating “This one…that I am standing on.”. Teams that did not have avatars to represent the other team members, on the other hand, often developed communication strategies to work around this lack of embodiment when referencing parts of the model. One strategy we found being employed was lateralizing the process model, meaning they agreed on directions based on the direction of the static labels in the model, e.g. the “top” being the first lane and then referencing elements by locating them accordingly, e.g. “the gate on the top right”. Another strategy was using more explicit descriptions to guide the focus of other team members, such as saying (“in the mouth lane, the third task from the right”). A typical example of this strategy can be seen in Excerpt 1. However, in doing so they also needed to communicate more, to be certain everyone was focusing on the same element, as can be seen in the two excerpts. G G
Blue, can you come to here? Oh, yeah, yeah, you are on the right way.
Excerpt 2: Communication that shows confirmation of understanding using avatars
Similarly, teams with avatars used them to confirm the understanding of their team members. They observed the movements of team members’ avatars to check that they understood references and instructions, as shown in Excerpt 2. In the excerpt, Green requests that Blue comes to her current position and then confirms that Blue has understood the intended location when (she) sees Blue’s
avatar moving towards her. We also found examples of communication breakdowns in teams without avatars, as shown in Excerpt 3. Due to these breakdowns, teams sometimes spent a lot of time trying to mark an element as an error and did not realize that each of them is marking a different element to the others. G R G G R G G R R G R
Uh, [Name of R]? Have you marked the centre one? Centre one? Bile...in the...right in the centre of the model. There is... […] In the Liver area. In the Liver area. That’s right. There is a task there called Continuously Secrete Bile. It needs to be marked as an error. So, uh... [...] Are you sure it is in the Liver lane? [...] Yeah. Liver and Gallbladder. [...] Still can’t find it.
Excerpt 3: Example of a communication breakdown in a team without avatars
Overall, three usages of the avatar could be observed across all experiment sessions in which teams had avatars. Firstly, avatars were frequently used to reference locations or model elements, see Excerpt 1. Secondly, participants observed the avatars of their collaborators to infer their understanding of the ongoing discussion. The avatars gave indications of understanding by displaying the user’s focus of attention and their location in, and movement around, the virtual space. Thirdly, participants observed avatars to confirm actions performed by their collaborators, such as modifying a model element being discussed by the team. We also found that teams in the animated avatar treatment rarely tried to use gestures and postures. When they did so, it was usually out of curiosity or for entertainment. The use of these features did not seem to affect either communication or coordination processes noticeably. Overall, the results of this experiment showed that the visual cues provided by avatars in a virtual environment are indeed used, as expected, to reference model elements and locations, to confirm understanding and to confirm the actions of collaborators. However, the sample was not large
enough to disconfirm any impact of these behaviours on performance measures such as model error identification or correction. This is the target of our second evaluation.
Second Evaluation: Quantitative Evaluation Design We designed the quantitative experiment largely as a replication of the qualitative exploration study, with minor changes to materials, participants and procedures to overcome the issues discovered in the qualitative experiment. In addition, we developed testable hypotheses and introduced quantitative measures to test them. The changes to our second evaluation were as follows: 1. We found no noticeable differences between static and animated avatar treatments in the first evaluation; therefore, we eliminated the third experiment group (animated avatars). 2. To eliminate the limitation of requiring BPMN knowledge to execute the experiment, the process model of human digestion was converted into a flowchart (see Appendix A.7) that is understandable to the general population. This was appropriate because, similar to the target population of stakeholders in an organisation, most of our sample population of students will have no or very little formal knowledge of process modelling, which would make it harder for them to understand the syntactic aspects of the BPMN process model [67]. Furthermore, it has been shown that flowcharts are the preferred process representation for students without formal process modelling knowledge [68]. The simplified flowchart has 32 model elements and 37 connections. In turn, this allowed us to recruit students representative of general practitioners rather than process analysts only. 3. We adjusted the six errors in the flowchart model to be solvable by general practitioners without any knowledge of process model syntax. Testing the simplified model in a pilot test with several non-expert modellers showed that the simplified visualization of the process allowed the target audience to understand the model and find the errors more readily.
4. To eliminate a bias from lack of domain knowledge, we provided a (half-page) textual description of the digestion process to participants. This allowed better comprehension and in turn allowed us to examine the collaboration processes and outcomes without distortion from lack of comprehension of the material. Also, in practice practitioners often have multiple sources of information available about a process, including texts such as manuals, policy documents or regulations [69].
Hypotheses Recall, the prototype design was intended to solve the issue of missing awareness information gained from visual cues provided by the embodiment of collaborators in a shared space. Solving this issue should improve collaboration between remotely located collaborators. This improvement should manifest itself in three specific changes to processes and outcomes of that collaboration. During the process of validation, people will communicate with the other team members to come to an agreement on whether the model is correct or needs to be changed. The time required for this process depends partially on how effective people are in achieving these goals. The outcomes of the proposed task can thus be quantified in a) time required to complete, b) number of errors found and c) number of errors fixed. To demonstrate an improvement in task outcomes we should therefore expect an improvement in at least one of these outcome dimensions. This expectation leads to the following hypotheses: Hypothesis 1a: Teams that have avatars available to them will complete the task faster than teams that do not have avatars. Hypothesis 1b: Teams that have avatars available to them will find more errors than teams that do not have avatars. Hypothesis 1c: Teams that have avatars available to them will fix more errors than teams that do not have avatars.
Furthermore, additional visual cues provided by the avatars should facilitate communication and coordination with team members [17,38], in turn decreasing the cognitive effort required to collaborate. The second hypothesis is therefore: Hypothesis 2: Teams that have avatars available to them will report lower perceived cognitive load from the task than teams without avatars.
Measurement We tested our hypotheses by employing four measures. First, we counted the number of errors in the model that teams successfully identified and agreed upon. Incorrectly identified errors in the model were not counted. Second, we counted the number of model changes made and agreed upon by teams in response to correctly identified errors. While we recorded all changes made to the model, changes made to incorrectly identified errors in the model were not counted. We evaluated the correctness of the changes and only counted correct model changes. Third, we measured the time taken to complete the validation task. This measurement was automated by having each participant pressing a start experiment button appearing in the process modelling tool after they finished the tutorial and an end experiment button when the group was done. The time was measured from the moment the last group member pressed the start button to the time the last group member pressed the end button. Lastly, we adopted a self-report cognitive load scale with items such as “I found the task difficult.” [70]. Appendix B lists all measures used. While the randomized design already reduced the impact of variations in individual skills and experiences of participants on the outcome measures, we also measured key control variables to be able to control potentially confounding influences such as prior experience or pre-existing knowledge, prior modelling knowledge, domain knowledge, experience with virtual environments of each participant. To identify potential confounds in the team work we measured familiarity of team members with each other, which is a proxy for how well teams work together [71,72]. All controls
were measured using a pre-test questionnaire and the measures used are summarized in Appendix B.
Procedures and Participants The procedures used for the recruitment of participants and executing the experiment were largely identical to the qualitative study. One exception is that the participants were not screened for prior process modelling experience. Given that domain experts in an organizational setting do not necessarily possess much knowledge or expertise of process models, we believed this to be appropriate. We recruited 126 students who participated in 42 experimental groups. Our recruitment strategy was similar to the qualitative study, but we increased the incentive for participating to $40 to attract more participants (with a view to increasing statistical power). The members of the best performing team were again promised an additional $100 voucher each to motivate participants to perform well.
Data Analysis We first discuss the characteristics of the sample and the measurements before discussing the analyses conducted to test our hypotheses and interpreting the results of the experiment. Table 4 summarizes descriptive statistics. It also provides results from statistical tests performed, including information on the context of these tests, in line with recent guidelines [73]. Based on a series of independent samples t-tests, the groups were found not to differ significantly on most of the control variables, confirming the effectiveness of the randomization, with the exception that the treatment group without avatars reported greater experience with computers. We see several trends in the descriptive data that seem to support our hypotheses. Firstly, teams with avatars finished the task more quickly than teams without avatars. Secondly, both the number of errors found and the number of errors fixed increased slightly with increasing number of avatar features. Furthermore, with increasing avatar features, participants found the task less difficult. If
the unintended variation between groups (in terms of years of experience with computers) was influential, one would reasonably expect each of the observed effects to be reduced or reversed.
Independent Factor Teams Participants Gender (Male) Gender (Female) Native English Speakers Non-Native English Speakers
Means (St. Dev.) No Avatar Group Total groups: 21 N = 63 N = 52 N = 11
Means (St. Dev.) Static Avatar Group Total groups: 21 N = 63 N = 50 N = 13
N = 55 N=8 19.63 (2.81)
N = 55 N=8 19.71 (2.64)
4.55 (1.47)
3.91 (1.99)
2.06 (0.59)
1.92 (0.61)
2.90 (0.93)
2.78 (0.96)
2.94 (1.01)
2.67 (0.97)
6.19 (0.82)
5.90 (1.21)
12.84 (2.89)
11.32 (4.30)
6.02* (3.12)
5.71 (2.76)
2.94 (1.01)
2.90 (0.96)
Age Team familiarity Process Modelling Intensity (never – daily) Process Modelling Experience (less than a month ago – more than three years ago) Domain Knowledge Computer Skill Subjective Computer Experience Years Computer Use Daily (Hours) 3D Environment Use (never – daily)
t-value (Sig.)
Lower Conf. Bound
Upper Conf. Bound
Effect Size
-
-
-
-
-0.16 (0.87) 1.19 (0.24) 1.26 (0.21) 0.76 (0.45)
-1.04
0.88
-0.45
1.74
d=0.03 d=0.37
-0.08
0.37
d=0.22
-0.21
0.46
d=0.13
1.53 (0.13) 1.55 (0.12) 2.34 (0.02) 0.57 (0.57) 0.18 (0.86)
-0.08
0.62
d=0.27
-0.08
0.65
d=0.28
0.23
2.82 d=0.42
-0.75
1.35
d=0.10
-0.32
038
d=0.03
Table 4: Descriptive statistics for experiment 2
We then ran statistical tests to examine our hypotheses. The first set of hypotheses made predictions about the effect avatars (or their absence) have on the outcome of the collaboration. As there is some interrelation between the three dependent variables that measure differences in the outcome of the collaboration (see Appendix B.3) and to minimise the familywise error rate of testing multiple hypotheses, we ran a MANOVA analysis to examine differences in these variables between the treatments. Table 5 summarizes the results for the dependent measures by the two groups. The MANOVA analysis shows that the differences between treatment groups are not significant (Wilks’ λ
= 0.97; F(3,38) = 0.41; p = 0.75). Therefore Hypothesis 1a, 1b and 1c cannot be confirmed even though the univariate results in Table 5 show at least the expected directionality of the effects. Table 5 also shows that the effect size for the treatment condition (using avatars or not) is small (Partial Eta Squared = 0.03), and that the test had an observed power of 0.12, indicating that our sample size was not large enough to statistically confirm such a small effect.
Dependent Measure
Means (St. Dev.) No Avatar Group
Corrected model 37.17 (8.46) Experiment Duration 5.10 (1.26)
Means (St. Test Statistic Dev.) Static Avatar Group Wilks’ λ = 0.97; F(3,38) = 0.41 35.30 (8.58) F(1,38) = 0.50 5.29 (0.78) F(1,38) =
Errors Found Errors Fixed Cognitive Load higher - 1 lower)
(7
3.33 (1.35)
3.38 (1.40)
2.54 (2.63)
2.24 (2.27)
0.35 F(1,38) = 0.01 t = 2.03
Sig.
Effect Size
Observed Power
0.75
= 0.03
0.12
0.48
= 0.01
0.11
0.56
= 0.01
0.09
0.91
= 0.00
0.05
0.04
d=0.37
0.50
Table 5: Results for experiment 2
The second hypothesis suggested that having the additional visual cues provided by the avatars will make the task of collaborative process validation easier. To test this hypothesis, we ran an independent samples t-test based on the reported subjective cognitive load, which showed that there is a significant difference in the perceived cognitive load of individuals in the different treatment groups (t = 2.03; p = 0.04), such that participants in the treatment group without avatars reported the task to be more difficult. This result supports Hypothesis 2. As the results do not show a significant effect on the performance of teams we decided to investigate in more detail which parts of the validation process are affected by the avatars. To this end we extracted the synchronisation events for each experiment session out of the network logs. As each client application of the prototype synchronises all actions mode by the user with all other participants via a server, this log provides a complete view of all actions taken by participants inside the virtual environment. The collection contained between 80,000 and 160,000 events per
experiment session. However, a large percentage of these events relate to intermediate updates (e.g., a model element has moved by a millimetre) rather than events that are meaningful for analysis (e.g., a model element has moved from one lane to another lane). These intermediate events are marked by the application for optimizing network traffic and were therefore easy to filter out. We furthermore removed all events that were automatically generated by the application or that related to actions that did not fall into the timed portion of the experiment. This left us with a total of 9,922 events that described meaningful actions performed by the participants. We analysed this data in two ways. Table 6 summarizes the results from these analyses. First, we analysed differences in mean occurrence of events overall on a group level. The data in Table 6 shows that teams without avatars performed significantly more actions, while achieving results of similar quality as teams with avatars (see Table 4). Second, we classified the actions in the 9,922 events into different categories. Broadly, the participants’ actions can be distinguished into editing actions and coordination actions. To allow for a reasonably detailed analysis, we grouped the events into five categories, with the first three relating to editing the model and the remaining two relating to coordination within the team: 1. Model structure change actions: actions that change the structure of the process model diagram. This includes creating and deleting model nodes and sequence flows, and changing the labels of model elements, because label change actions are semantically equivalent to replacing one activity with another activity. These actions are generally considered to be primitive patterns of process model change [74–76]. 2. Model layout change actions: actions that change aesthetic aspects of the model. This includes moving model elements, scaling model elements and moving sequence flow vertices. These actions differ from model structure change actions in two ways: a) they do not affect the semantics of the model and are therefore not part of common model change patterns [74–76] and b) talking about them requires precise location references.
3. Reconsider actions: actions that imply that users reconsidered previous changes to the model. The only event in this category is the undo button being pressed. 4. Consensus actions: actions that users performed to confirm consensus amongst the team. This category includes marking model elements as errors and approving changes to the model. 5. Text chat actions: This category includes all text messages participants sent to each other. With these categories defined, we ran an independent samples t-test to compare the mean occurrence of events per category. The results are summarized in Table 6. The results show that actions required to gain consensus, i.e., marking elements as errors and approving changes, were performed significantly more often by teams without avatars. Similarly, actions that changed the structure of the process model, such as adding or deleting model elements, were performed significantly more often by non-avatar teams. While there is also a large difference in the number of changes to model layout, the difference is not statistically significant. Neither avatar nor non-avatar teams made much use of the text chat option, nor did we find differences between the conditions for events relating to text chat. Teams with avatars reconsidered their edits more (i.e. used the “undo” button) than teams without avatars, but not significantly so and not enough to explain the difference in model layout or model structure changes. Events per group
Overall Model Structure Change Model Layout Change Reconsider Consensus Text Chat
Means (St. Dev.) No Avatar Group 266.76 (113.93) 8.31 (6.50) 13.38 (24.07) 4.81 (7.09) 89.76 (36.93) 0.76 (2.41)
Table 6: Event analysis results
Means t-value Lower Upper Effect Observed (St. Dev.) (Sig.) Conf. Conf. Size Power Static Bound Bound Avatar Group 205.71 2.17 3.71 118.39 d = 0.79 0.70 (0.038) (59.89) 6.68 1.97 0.00 3.26 d = 0.27 0.50 (0.050) (5.44) 8.65 1.43 -1.80 11.26 d = 0.26 0.30 (10.33) (0.154) 7.76 -1.16 -8.09 2.1825 d = -0.37 0.12 (9.24) (0.252) 68.91 3.13 7.55 34.16 d = 0.76 0.67 (0.003) (22.44) 0.81 -0.08 -1.26 1.16 d = -0.02 0.03 (1.33) (0.937)
Overall, the statistical analysis of the quantitative data comparing the effects of avatar use was unable to confirm statistically significant positive effects of avatar use on team performance even though in all three tests the direction of the effects were as expected. However, differences in the perceived cognitive load and a post-hoc analysis of participant actions were found to be significant between treatment groups. These results are summarized in Table 7. Expectation H1a
Results
Teams that have avatars available to Teams
Interpretation that
had
avatars The direction of
them will complete the task faster completed the task faster than the effect is as than teams that do not have avatars.
teams that did not have avatars expected but the but the difference did not reach hypothesis is not statistical significance.
H1b
Teams that have avatars available to Teams
that
had
confirmed avatars The direction of
them will find more errors than teams identified more errors than the effect is as that do not have avatars.
teams that did not have avatars expected but the but the difference did not reach hypothesis is not statistical significance.
H1c
Teams that have avatars available to Teams
that
had
confirmed. avatars The direction of
them will fix more errors than teams correctly fixed more errors than the effect is as that do not have avatars.
teams that did not have avatars expected but the but the difference did not reach hypothesis is not confirmed.
statistical significance. H2
Teams that have avatars available to Teams them will report lower perceived reported
that
had
avatars The hypothesis is
significantly
lower supported.
cognitive load from the task than perceived cognitive load from teams without avatars.
the task than teams without avatars
and
the
difference
reached statistical significance. Table 7: Overview of the results of hypothesis testing
Discussion Summary of Contributions We set out to answer two research questions. We will now discuss how the findings presented above answer these two questions. Our first research question was: How can visual cues related to embodiment be supported by technology in remote collaboration? As an answer, we presented a design for a virtual environment describing three mechanisms that provide visual cues to remote collaborators. In particular, these cues are supported by providing an embodiment for each user in a shared workspace, providing users with the ability to animate their avatars, providing automatic animations for the avatar so that it accurately represents a user’s interactions with the system to remote users.Our second research question asked: “How are these visual cues used by collaborators in remote collaboration”. In answering this question, our qualitative experiment suggests that participants did in fact make use of the mechanisms of embodiment and animation. However, only animation of the avatar as a whole, such as deliberately moving it to a location referenced, has been observed to be used. While this seems to imply that the avatars were simply used as pointers, our qualitative finds show that participants were also able to use avatars as an indicator of the status of a remote collaborator. For example, due to the fixed linking of view perspective with the avatar, participants were able to infer whether a remote participant was looking at the same region of the model as them, which would not be possible with abstract telepointers [1,77]. Animations of the body posture and gestures, however, were rarely used and then only for fun (we note that this could have been affected by the design of the input – participants had to learn and use a number of key presses). The evaluation has therefore shown that our design does indeed enable people to use visual cues in remote collaboration. However, it remains for future research to determine if people do not use visual cues provided by gestures and body posture due to limitations of the design or because they are not useful for the collaboration task.
We also wanted to know how such support for visual cues affects the process and outcomes of collaboration. The qualitative experiment suggested participants used these visual cues to support their communication and coordination as a team in three ways. Firstly, the avatars were frequently used to reference locations or objects. Secondly, participants observed the position and movement of the avatars of their collaborators to confirm that these have understood their communications. Thirdly, the avatars also served to confirm the actions of remote collaborators. The quantitative experiment demonstrated, that by using these additional visual cues, teams achieved results of equal quality, but they required fewer actions and perceived the task to be easier. While we were not able to confirm that team performance improved significantly as was observed in other studies ([e.g. ,44]), we were able to confirm a gain in efficiency of the collaboration. Table 8 summarizes and compares the findings of both evaluation episodes. Qualitative Study Avatars are used for: · referencing model elements locations, · confirming understanding, and · confirming action.
Quantitative Study Teams with avatars: and · were faster, but not by much, · performed better overall, but not by much · completed the task with fewer actions, and · found the task easier.
Table 8: Summary of the findings of both evaluation episodes
Implications The evaluations of our prototype system demonstrated that a) people use visual cues in technologymediated remote collaboration when these are available, b) the use of these visual cues can make collaboration easier and more efficient, but c) no significant performance impacts can be detected. These findings have implications for at least three areas of research: CVEs, collaborative technology design and process modelling. For collaborative virtual environments, our findings clarify benefits of virtual environments for remote collaboration and specifically the benefits provided by avatars. Avatars have often been suggested to benefit collaboration [2] but limited empirical evidence exists to justify that claim. Our study implies that user embodiments (in the form of avatars) should enter the discussion of virtual
artefacts. Our findings suggest that the embodiment serves to indicate the point-of-view clearly visible for other participants and can thereby reduce misunderstanding from referential ambiguity when other people have to be aware of this point-of-view to understand an utterance, for example in referencing locations or model elements. This finding mirrors previous suggestions that avatars reduce referential ambiguity [38]: we observed the same effect they observed for structured communication in cases of unstructured communication. We also learned that the embodiment can be used to confirm understanding and confirm the actions of remote collaborators. Overall, we advanced the understanding of how avatars affect communication and coordination in virtual environments: They enable the use of an extended range of visual cues, which can make communication and coordination in remote collaboration easier. However, while we were able to empirically confirm efficiency gains caused by the use of avatars in collaboration as hypothesised by studies such as Montoya et al. [44], we also note that our quantitative study was not able to confirm an impact of these gains on team performance in remote collaboration. For collaborative technology, our findings clarify assertions of the usefulness and importance of visual cues in collaboration tasks, which were made by Gergle et al. [17] and Kraut et al. [18]. To the best of our knowledge, ours was the first systematic empirical application of their taxonomy. Furthermore, while virtual environments can be built in various ways, we presented a theoretically grounded prototype design for a collaboration system that academics and practitioners can replicate. This should enable a systematic discussion of differences between different CVEs to better integrate findings in the existing body of knowledge and increase the likelihood that the benefits of the system observed in our study can be transferred to real-world usage of such a system. There are also implications for the area of process model validation. Previous studies of tool support for collaborative process modelling identified a lack of communication and awareness features in existing modelling tools [15,33,56]. We built such a system and also performed qualitative and quantitative evaluations. While we did not find significant effects of avatars on process validation performance, our studies did show that additional visual cues can be used to facilitate
communication and coordination in collaborative process model validation: teams found it easier to perform the process validation task when using avatars. If collaborative process model validation is well supported by technology such as ours, organizations that currently use workshops to validate process models could use this technology instead to have relevant stakeholders work together across long distances. The design proposed in this paper could therefore result in savings on both travel costs and time spent traveling by stakeholders involved in process model validation activities. As insufficient stakeholder involvement, especially from management, has been identified as a key reason for the failure of business process improvement projects [78], the use of a tool such as ours could also increase the involvement of stakeholders in the model validation process and ultimately reduce the likelihood of project failure. Furthermore, scenarios such as BPM education could benefit from a system such as the one demonstrated in this paper for similar reasons. Overall, the design and evaluation of the prototype system presented in this paper has created knowledge that contributes to the areas of collaborative virtual environments, collaborative technology and process modelling. This knowledge can help to create more effective technological support for remote collaboration. The results from our tests also provide empirical knowledge, as well as a range of open research questions worthy of further investigation. For example, whilst we measured the performance of teams in terms of error identification and resolution, one might also conceive alternative metrics that focus on team collaboration and communication (e.g., number of conversations, number of consensual agreements reached, level of homogeneity). Such metrics could then be applied to examine how different collaboration approaches for modelling and validation affects the teams.
Limitations Several limitations exist. First, our study is both wide and narrow in scope – we built and examined mechanisms that support the validation of any process diagram rather than a particular formalism (e.g., BPMN) but we restricted the task to the scope of validating the model against a textual
description. Both were considered design choices (as described above); however, future research could be conducted on a more specific formalism (e.g., Petri nets) and with a wider scope (e.g., both model creation and validation). Second, the development of the research prototype is governed by a number of assumptions we had to make to guide the design. One assumption was that available commercial tools for process model creation and validation lack required visual cues. Table 1 substantiates this assumption somewhat; however, we are not in a position to ascertain why and how the support available in commercial tools has come into being. Another assumption is that avatars are at least approximately consistent and complete representations of the users, their thoughts, moods, actions and decisions. One derivative assumption is that avatars with extended visual cues indeed provide more complete and consistent representations; another derivate assumption is that users continuously update the representation of their avatars (e.g., as their mood changes). While the most salient visual cues for our study, i.e. the position and orientation of the avatar, are mostly automatically updated by the system, the validity of these assumptions may also be challenged. Third, limitations also pertain to the way we conducted our evaluations. Regarding participants, we recruited university students. Our research design is not suited to evaluate whether the use of avatars by professional or more experienced teams would yield different results so our findings are limited in generalizability to other settings. Several elements deserve note: a) We used financial incentives to motivate participation and also performance. While there is broad support that financial incentives are effective to that end [65], we cannot exclude the possibility that the financial rewards impacted on the experimental outcomes. b) While students were offered a reward for good team performance, their overall motivation during the experiment may differ from professional collaborators that seek to achieve a specific goal in their day-to-day job. c) Domain and modelling knowledge of these students will be limited in comparison to professionals. This is important because it is likely that process model validation in practice is
performed largely by people or teams with expertise in domain and method – e.g., often, the same teams that developed the model. Given our evaluation concerned a novel research prototype, we could not evaluate it in the field with representative practitioners. Also, we do not believe students would not be representative – validation is also sometimes performed by varied teams with different sets of skills, backgrounds and interests, much like our students. d) Our results are limited to small collaborative groups. Future work should explore these issues with larger groups to see to what extent our findings hold in more complex collaborative settings. Furthermore, the experimental setting in a research lab is likely to have influenced the results, because the results of the experiment were of little relevance for the future of the participants, which will be different in a work setting. Similarly, real world collaborative process modelling often stretches over longer time periods and people can gain experience in working as a team, which is unlikely to happen to the same extent in a one hour experiment session. Another limitation is in the choice of metrics we implemented to evaluate model validation. We measured error identification and rectification as outcome variables. To evaluate changes in the process, we undertook an event analysis where we contrasted volumes of different actions. Still, several other metrics could be conceived that may meaningfully add to our analyses, e.g. focusing on incorrect, rather than correct, error identifications and model change operations. Another limitation stems from the choice of task. We developed a task that concerned process validation. We did so because during identification and correction of errors, participants are forced to scan and comprehend an entire process model and they are required to collaborate to reach decisions. The nature of validation also requires participants to be analytic (identifying an error) and creative (proposing solutions), thereby mixing the tasks amply. Therefore, it was an appropriate setting for our research objective. Still, it would be interesting to investigate the effects of these visual cues in another related setting, such as process model creation. Also, we note that the
experimental task setting and materials, whilst appropriate to evaluate our research questions, are unlikely to feature as such in any real-world application. One might also criticize our choice of process domain. We selected a process outside of a business domain to eliminate confounding effects of domain knowledge. The use of different, non-business domains is quite common in experimental studies to eliminate any possible domain complexity and familiarity bias [11,62,63] Fourth, limitations exist about our findings. One might argue that the identified results do not show strong support for the utility and efficacy of the technology. Still, in most cases we did observe expected directionality of the results, just without statistical conclusiveness. We made sure we described all results fully and openly, including effect sizes, power, bounds and contexts of the tests to allow all readers to develop their own interpretation of the results [73]. Moreover, we believe that through our comprehensive multi-method evaluation we developed a rich, contextualized and precise understanding of collaboration processes and outcome impacts from the prototype design. Finally, we found that the interface participants used to interact with the virtual environment created some issues with the usability of the prototype. Future research should investigate whether the benefits of avatars can be employed in a way that reduces the barrier to entry created by the interface, especially for novice users. Another limitation, therefore, is that we have not compared our 3D tool with a 2D tool for process model creation or validation. While such an approach would have revealed potential overheads in understanding and navigating a 3D environment, it would not have allowed us to isolate the effects of avatars, which was the focus of this study. In future work, however, it would be both relevant and interesting to compare our tool to a 2D tool with similar functionality, to investigate potential boundaries to effects that can be expected from 3D modelling environments.
Conclusion Technology-mediated remote collaboration still faces many issues when compared to face-to-face collaboration. One of these issues is a lack of awareness information. In this paper, we presented a design for a CVE solution that is able to provide remote collaborators with additional visual cues compared to existing technology, which should improve their ability to coordinate and communicate. To evaluate this, we examined the use of avatar representations in virtual environments for collaborative validation of process model diagrams. Our findings show that avatar representations affect the collaboration process and cause people to communicate differently. Teams with avatars required significantly fewer actions to achieve consensus and fix errors, while achieving results of equal quality compared to teams without avatars. Consequently, teams with avatars also found communication easier. In other words, we have found evidence that avatars made communication both easier and more efficient.
References [1]
C. Gutwin, S. Greenberg, A Descriptive Framework of Workspace Awareness for Real-Time Groupware, Comput. Support. Coop. Work. 11 (2002) 411–446.
[2]
S. Benford, J. Bowers, L.E. Fahlén, C. Greenhalgh, D. Snowdon, User embodiment in collaborative virtual environments, in: Proc. SIGCHI Conf. Hum. Factors Comput. Syst., ACM Press, Denver, Colorado, USA, 1995: pp. 242–249.
[3]
A. Chellali, I. Milleville-Pennel, C. Dumas, Influence of contextual objects on spatial interactions and viewpoints sharing in virtual environments, Virtual Real. 17 (2013) 1–15.
[4]
P.R. Messinger, E. Stroulia, K. Lyons, M. Bone, R.H. Niu, K. Smirnov, S. Perelgut, Virtual worlds — past, present, and future: New directions in social computing, Decis. Support Syst. 47 (2009) 204–228.
[5]
G. Bente, N.C. Krämer, Virtual gestures: embodiment and nonverbal behavior in computermediated communication, in: Face-to-Face Commun. Over Internet Emot. a Web Cult. Lang. Technol., Cambridge Univ Pr, 2011: pp. 176–209.
[6]
A. Davis, J. Murphy, D. Owens, D. Khazanchi, I. Zigurs, Avatars, People, and Virtual Worlds: Foundations for Research in Metaverses, J. Assoc. Inf. Syst. 10 (2009) 90–117.
[7]
M. Dumas, M. La Rosa, J. Mendling, H.A. Reijers, Fundamentals of Business Process Managment, Springer, Berlin and Heidelberg, Germany, 2013.
[8]
B. Curtis, M.I. Kellner, J. Over, Process Modeling, Commun. ACM. 35 (1992) 75–90.
[9]
S. Hoppenbrouwers, H.A. Proper, T.P. van der Weide, A Fundamental View on the Process of Conceptual Modeling, in: Lect. Notes Comput. Sci. 3716, Springer, Klagenfurt, Austria, 2005:
pp. 128–143. [10]
P. Rittgen, Negotiating models, in: Adv. Inf. Syst. Eng., Springer Verlag, 2007: pp. 561–573.
[11]
K. Figl, J.C. Recker, J. Mendling, A study on the effects of routing symbol design on process model comprehension, Decis. Support Syst. 54 (2013) 1104–1118.
[12]
S. Hoppenbrouwers, H.A. Proper, T.P. van der Weide, Formal Modelling as a Grounded Conversation, in: Int. Work. Conf. Lang. Action Perspect. Commun. Model., Linkopings Universitet and Hogskolan I Boras Linkoping, Kiruna, Sweden, 2005: pp. 139–155.
[13]
P. Rittgen, IT support in collaborative modelling of business processes – a comparative experiment, J. Organ. Des. Eng. 1 (2010) 98.
[14]
M. Indulska, J.C. Recker, M. Rosemann, P. Green, Process Modeling: Current Issues and Future Challenges, in: Lect. Notes Comput. Sci. 5565, Springer, Amsterdam, The Netherlands, 2009: pp. 501–514.
[15]
J. Mendling, J.C. Recker, J. Wolf, Collaboration features in current BPM tools, EMISA Forum. 32 (2012) 48–65.
[16]
C. Heath, P. Luff, H. Kuzuoka, K. Yamazaki, S. Oyama, Creating Coherent Environments for Collaboration, in: W. Prinz, M. Jarke, Y. Rogers, K. Schmidt, V. Wulf (Eds.), Conf. Comput. Support. Coop. Work, Kluwer Academic Publishers, Bonn, Germany, 2001: pp. 119–138.
[17]
D. Gergle, R.E. Kraut, S.R. Fussell, Using Visual Information for Grounding and Awareness in Collaborative Tasks, Human–Computer Interact. (2012).
[18]
R.E. Kraut, S.R. Fussell, J. Siegel, Visual Information as a Conversational Resource in Collaborative Physical Tasks, Human-Computer Interact. 18 (2003) 13–49.
[19]
M. Prilla, A. Nolte, T. Herrmann, G. Kolfschoten, S. Lukosch, Collaborative Usage and Development of Models: State of the Art, Challenges and Opportunities, Int. J. ECollaboration. 9 (2013) 1–16.
[20]
M. Landry, J.-L. Malouin, M. Oral, Model validation in operations research, Eur. J. Oper. Res. 14 (1983) 207–220.
[21]
J.E. Cook, A.L. Wolf, Software process validation: quantitatively measuring the correspondence of a process to a model, ACM Trans. Softw. Eng. Methodol. 8 (1999) 147– 176.
[22]
T. Buranathiti, J. Cao, W. Chen, L. Baghdasaryan, Z.C. Xia, Approaches for model validation: methodology and illustration on a sheet metal flanging process, J. Manuf. Sci. Eng. 128 (2006) 588–597.
[23]
W.M.P. Van der Aalst, Formalization and verification of event-driven process chains, Inf. Softw. Technol. 41 (1999) 639–650.
[24]
J.C. Recker, A socio-pragmatic constructionist framework for understanding quality in process modelling, Australas. J. Inf. Syst. 14 (2007) 43–63.
[25]
M.T. Wynn, H.M. V Verbeek, W.M.P. Van der Aalst, A.H.M. ter Hofstede, D. Edmond, Business Process Verification – Finally a Reality! , Bus. Process Manag. J. 15 (2009) 74–92.
[26]
P. Rittgen, Success factors of e-collaboration in business process modeling, in: Adv. Inf. Syst. Eng., Springer, 2010: pp. 24–37.
[27]
H. Leopold, J. Mendling, A. Polyvyanyy, Supporting process model validation through natural language generation, IEEE Trans. Softw. Eng. 40 (2014) 818–840.
[28]
P.J.M. Frederiks, T.P. van der Weide, Information Modeling: The Process and the Required Competencies of Its Participants, Data Knowl. Eng. 58 (2006) 4–20.
[29]
M. Rosemann, M. Lind, A. Hjalmarsson, J.C. Recker, Four Facets of a Process Modeling Facilitator, in: Int. Conf. Inf. Syst., 2011: pp. 1–16.
[30]
M. Rosemann, Potential Pitfalls of Process Modeling: Part A, Bus. Process Manag. J. 12 (2006) 249–254.
[31]
R.A. Brown, J.C. Recker, S. West, Using Virtual Worlds for Collaborative Business Process Modeling, J. Bus. Process Manag. 17 (2011) 546–564.
[32]
G. Decker, H. Overdick, M. Weske, Oryx – An Open Modeling Platform for the BPM Community, in: Bus. Process Manag., 2008: pp. 382–385.
[33]
K. Riemer, J. Holler, M. Indulska, Collaborative Process Modelling-Tool Analysis and Design Implications, in: Eur. Conf. Inf. Syst., 2011.
[34]
E. Poppe, R.A. Brown, J.C. Recker, D. Johnson, Improving Remote Collaborative Process Modelling using Embodiment in 3D Virtual Environments, in: Asia-Pacific Conf. Concept. Model., Adelaide, Australia, 2013.
[35]
J. Recker, Opportunities and Constraints: The Current Struggle with BPMN, Bus. Process Manag. J. 16 (2010) 181–201.
[36]
J.B. Hill, M. Cantara, E. Deitert, M. Kerremans, Magic Quadrant for Business Process Management Suites, (2007).
[37]
E. Poppe, R.A. Brown, J.C. Recker, D. Johnson, Evaluation of an Augmented Reality Collaborative Process Modelling System, in: Cyberworlds, Darmstadt, Germany, 2012.
[38]
D. Ott, P. Dillenbourg, Proximity and view awareness to reduce referential ambiguity in a shared 3D virtual environment, in: Conf. Comput. Support Collab. Learn., Association for Computational Linguistics, Morristown, NJ, USA, 2002: pp. 603–604.
[39]
N. Yee, J.N. Bailenson, M. Urbanek, F. Chang, D. Merget, The unbearable likeness of being digital: the persistence of nonverbal social norms in online virtual environments., Cyberpsychol. Behav. 10 (2007) 115–21.
[40]
J. Hindmarsh, M. Fraser, C. Heath, S. Benford, C. Greenhalgh, Fragmented interaction: establishing mutual orientation in virtual environments, in: ACM Conf. Comput. Support. Coop. Work, ACM Press, Seattle, WA, USA, 1998: pp. 217–226.
[41]
J. Hauber, H.T. Regenbrecht, A. Cockburn, M. Billinghurst, The Impact of Collaborative Style on the Perception of 2D and 3D Videoconferencing Interfaces, Open Softw. Eng. J. 6 (2012) 1– 20.
[42]
R.J. Moore, N. Ducheneaut, E. Nickell, Doing Virtually Nothing: Awareness and Accountability in Massively Multiplayer Online Worlds, Comput. Support. Coop. Work. 16 (2007) 265–305.
[43]
V. Venkatesh, J.B. Windeler, Hype or Help ? A Longitudinal Field Study of Virtual World Use for Team Collaboration, J. Assoc. Inf. Syst. 13 (2012) 735–771.
[44]
M.M. Montoya, A.P. Massey, N.S. Lockwood, 3D Collaborative Virtual Environments : Exploring the Link between Collaborative Behaviors and Team Performance, Decis. Sci. 42 (2011) 451–476.
[45]
A.R. Hevner, S.T. March, J. Park, S. Ram, Design Science in Information Systems Research, MIS Q. 28 (2004) 75–105.
[46]
K. Peffers, T. Tuunanen, M. a. Rothenberger, S. Chatterjee, A Design Science Research Methodology for Information Systems Research, J. Manag. Inf. Syst. 24 (2007) 45–77.
[47]
J.R. Venable, J. Pries-Heje, R. Baskerville, FEDS: a Framework for Evaluation in Design Science Research, Eur. J. Inf. Syst. (2014) 1–13.
[48]
G. Kleining, Das qualitative Experiment [the qualitative experiment], Kolner Z. Soz. Sozpsychol. 38 (1986) 724–750.
[49]
T.J. Dodds, B.J. Mohler, H.H. Bülthoff, A Communication Task in HMD Virtual Environments: Speaker and Listener Movement Improves Communication, in: 23rd Annu. Conf. Comput. Animat. Soc. Agents (CASA 2010), 2010: pp. 1–4.
[50]
D. Roberts, I. Heldal, O. Otto, R. Wolff, Factors influencing flow of object focussed collaboration in collaborative virtual environments, Virtual Real. 10 (2006) 119–133.
[51]
H. Ishii, M. Kobayashi, K. Arita, Iterative design of seamless collaboration media, Commun. ACM. 37 (1994) 83–97.
[52]
R.P. Darken, J.L. Sibert, Navigating large virtual spaces, Int. J. Hum. Comput. Interact. 8 (1996) 49–71.
[53]
D.A. Bowman, L.F. Hodges, User Interface Constraints for Immersive Virtual Environment Applications, 1995.
[54]
J. Pinggera, S. Zugal, M. Weidlich, D. Fahland, B. Weber, J. Mendling, H.A. Reijers, Tracing the Process of Process Modeling with Modeling Phase Diagrams, in: Bus. Process Manag. Work., 2012: pp. 370–382.
[55]
D.A. Hantula, N. Kock, J.P.D. Arcy, D.M. Derosa, Media Compensation Theory: A Darwinian Perspective on Adaptation to Electronic Communication and Collaboration, in: G. Saad (Ed.), Evol. Psychol. Bus. Sci., Springer, Berlin, Heidelberg, 2011: pp. 339–363.
[56]
C. Hahn, J.C. Recker, J. Mendling, An Exploratory Study of IT-enabled Collaborative Process Modeling, in: Int. Work. Bus. Process Des., Hoboken, New Jersey, USA, 2010: pp. 61–72.
[57]
Y.I. Nakano, G. Reinstein, T. Stocky, J. Cassell, Towards a model of face-to-face grounding, in: Proc. 41st Annu. Meet. Assoc. Comput. Linguist. 1, 2003: pp. 553–561.
[58]
J. Mueller, K. Hutter, J. Fueller, K. Matzler, Virtual worlds as knowledge management platform - a practice-perspective, Inf. Syst. J. 21 (2011) 479–501.
[59]
R.A. Stebbins, Exploratory Research in the Social Sciences, in: J. Van Maanen, P.K. Manning, M.L. Miller (Eds.), Qual. Res. Methods, Sage, Thousand Oaks, California, 2001.
[60]
J.C. Recker, J. Mendling, C. Hahn, How Collaborative Technology Supports Cognitive Processes in Collaborative Process Modeling: A Capabilities-Gains-Outcome Model, Inf. Syst. 38 (2013) 1031–1045.
[61]
J.C. Recker, H.A. Reijer, S.G. van de Wouw, Process Model Comprehension: The Effects of Cognitive Abilities, Learning Style, and Strategy, Commun. Assoc. Inf. Syst. 34 (2014) 199–222.
[62]
V. Khatri, I. Vessey, V. Ramesh, P. Clay, S.J. Park, Understanding Conceptual Schemas: Exploring the Role of Application and IS Domain Knowledge, Inf. Syst. Res. 17 (2006) 81–99.
[63]
G. Allen, J. Parsons, Is query reuse potentially harmful? Anchoring and adjustment in adapting existing database queries, Inf. Syst. Res. 21 (2010) 56–77.
[64]
J.C. Recker, Empirical Investigation of the Usefulness of Gateway Constructs in Process Models, Eur. J. Inf. Syst. 22 (2013) 673–689.
[65]
C.F. Camerer, R.M. Hogarth, The effects of financial incentives in experiments: A review and capital-labor-production framework, J. Risk Uncertain. 19 (1999) 7–42.
[66]
D. Traum, Issues in multiparty dialogues, in: Work. Agent Commun. Lang., 2003: pp. 201–211.
[67]
J. Mendling, M. Strembeck, J.C. Recker, Factors of process model comprehension—Findings from a series of experiments, Decis. Support Syst. 53 (2012) 195–206.
[68]
J.C. Recker, N. Safrudin, M. Rosemann, How novices design business processes, Inf. Syst. 37
(2012) 557–573. [69]
S. Patig, V. Casanova-Brito, Requirements of Process Modeling Languages – Results from an Empirical Investigation, in: A. Bernstein, G. Schwabe (Eds.), Int. Conf. Wirtschaftsinformatik, Association for Information Systems, Zurich, Switzerland, 2011: pp. 756–765.
[70]
F. Paas, J.E. Tuovinen, H. Tabbers, P.W.M. Van Gerven, Cognitive Load Measurement as a Means to Advance Cognitive Load Theory, Educ. Psychol. 38 (2003) 63–71.
[71]
S.J. Adams, S.G. Roch, R. Ayman, Communication Medium and Member Familiarity: The Effects on Decision Time, Accuracy, and Satisfaction, Small Gr. Res. 36 (2005) 321–353.
[72]
D.H. Gruenfeld, E. a. Mannix, K.Y. Williams, M. a. Neale, Group Composition and Decision Making: How Member Familiarity and Information Distribution Affect Process and Performance, Organ. Behav. Hum. Decis. Process. 67 (1996) 1–15.
[73]
R.L. Wasserstein, N.A. Lazar, The ASA’s statement on p-values: context, process, and purpose, Am. Stat. 70 (2016) 129–133.
[74]
B. Weber, M. Reichert, S. Rinderle-Ma, Change Patterns and Change Support Features Enhancing Flexibility in Process-aware Information Systems, Data Knowl. Eng. 66 (2008) 438– 466.
[75]
S. Kabicher, S. Kriglstein, S. Rinderle-Ma, Visual change tracking for business process models, in: Int. Conf. Concept. Model., 2011: pp. 504–513.
[76]
J. Kolb, B. Rudner, M. Reichert, Towards gesture-based process modeling on multi-touch devices, in: Int. Conf. Adv. Inf. Syst. Eng., Springer, 2012: pp. 280–293.
[77]
P. Luff, C. Heath, H. Kuzuoka, J. Hindmarsh, K. Yamazaki, S. Oyama, Fractured Ecologies : Creating Environments for Collaboration, Human-Computer Interact. 18 (2003) 51–84.
[78]
M. Den Hengst, G.-J. De Vreede, Collaborative business engineering: a decade of lessons from the field, J. Manag. Inf. Syst. 20 (2004) 85–113.
[79]
B.E. Erlandson, B.C. Nelson, W.C. Savenye, Collaboration modality, cognitive load, and science inquiry learning in virtual inquiry environments, Educ. Technol. Res. Dev. 58 (2010) 693–710.
[80]
J.C. Recker, A. Dreiling, The Effects of Content Presentation Format and User Characteristics on Novice Developers’ Understanding of Process Models, Commun. Assoc. Inf. Syst. 28 (2011) 65–84.
[81]
K.J. Garland, J.M. Noyes, Computer experience: a poor predictor of computer attitudes, Comput. Human Behav. 20 (2004) 823–840.
Appendix A – Experimental Material A.1.
Protocol
Running the experiment 1. “Greetings, thanks for coming” 2. Ask participants to read and sign consent forms 3. Impress upon participants the risk of motion sickness 4. Ask participants to fill in pre-test questionnaire 5. Ask participants to read task description, hints and tips, keyboard layout sheets 6. Tell participants NOT to hit the start experiment button until I give the go ahead 7. Start the tutorial for each of the participants 8. If participants get stuck and they’re not moving forward remind them to look at task description and hint sheet or keyboard layout – NO FURTHER HELP 9. Tell participants to hit the start experiment button once all have finished tutorial 10. Keep an eye on the voice recording to be sure that’s working 11. Give participants five-minute warning at 40 minutes in experiment 12. Ask participants to press “stop experiment” button once 45 mins are over or team agrees on being done 13. Ask participants to fill in pre-test questionnaire 14. Give them JB Hi-Fi vouchers before they leave
A.2.
Task Description
Task Description: Your team needs to collaborate on validating the given process model. That means your team has to check whether the given model to the best of their knowledge faithfully represents the process it is supposed to describe. Each team member will work on a desktop computer running a client of BPM Virtual Modeller. During the experiment you will not be allowed to communicate with team members any other way than via the prototype. The team will be given a complex process model that has been validated by a domain expert. We have added 3 syntactic errors as well as 3 semantic errors to it. ·
·
Syntactic errors in some way break grammar rules (of BPMN in this case) but could still represent the process correctly. Such errors would include missing start and end-events, deadlocks (a combination of mismatching splits and joins that prevents the process from finishing) and using tasks for representing states instead of activities. Semantic errors are when the grammar is used correctly but the process that is shown in the model is not equivalent to the process it is supposed to represent. Such errors include wrong sequencing, wrong connections, activities that are not part of the represented process or wrong role assignments.
We will measure the total time the team takes to finish task c) and d) described in the following. In detail, you will be asked to:
A. Complete the Pre-Test Questionnaire This questionnaire will capture data that is of relevance for statistical analysis of the experiment results. B. Complete a short tutorial A tutorial will explain all major features of the modelling tool to you. This is to ensure that your performance is not influenced mainly by unfamiliarity with the tool. The time you take to complete the tutorial will be measured. This is done for statistical data analysis purposes and will not influence your performance score. C. Identify all errors For this all members of the team have to mark an error as error in their tool in order for the error to be counted as “identified”. Each team member will have to select the model part in question and press the ‘Mark as Error’-button in the GUI. This will require some form of agreement and coordination between team members, as can reasonably be expected in a real-world process validation. D. Correct all errors The team then has to correct the errors by editing the model. All elements of the original model will be locked initially. A model element will be unlocked and can be edited once it has been flagged as error by all team members. This is not necessary for elements that have been created by team members during the experiment. All changes have to be approved by all team members. You can approve changes made to a model element by selecting it and pressing the ‘Approve’-button in the top-right. The list below the approve button shows, what all the changes made to the selected model element are and who has approved them already. Take care of approving all changes before moving on, because unapproved changes in the model will not be saved and therefore not be counted as corrected. E. Complete the Post-Test Questionnaire This questionnaire contains questions regarding your impression of working with the modelling tool. You have 45 minutes to find and correct all the errors, but you can finish before the time has passed. We will measure and record the time taken to finish tasks c) and d). We will also capture the final process model. You will then be asked to fill in a post-test questionnaire. Team performance: We will show the final process models to two expert modellers that work as independent judges to score the quality of corrections. They will give points for each error that has been correctly identified and points for each error that has been fixed (i.e. is equivalent to the error-free model). Wrongly identified errors will affect the score negatively. This will result in a model score. We can then establish a total measure of quality: model score / time. This measure will be used to evaluate the performance of each team in the experiment.
A.3.
Hint Sheet
Tips & Tricks Hint: This task requires team work and coordination, so talk to your team mates! Hint: The task description lists possible types of errors, so if you are out of ideas, read it again and look specifically for errors of one of the types described. Hint: Your team is assessed against the number of errors found, number of errors corrected and the time taken to do so, so keep an eye on the time! There is display indicating the duration of the experiment so far to the right of the experiment button.
Reminder: Procedure to mark and correct an error Once you have found an error flag it by selecting the model element and pressing the flag button. A red border around the button indicates that you have flagged it. Discuss the error with your team mates and get them to flag the element if they agree. You will be able to see who has flagged the element by moving the mouse cursor over the flag button. When all participants have marked the element the button should turn red. This means you can now edit the element.
Discuss with your team mates how to fix the error and then get one person to do the changes. Once the changes have been implemented, all other team members have to approve the changes. To do so they need to select the element in question. A list with changes done to the object should appear on the right side of the screen. To approve the changes every team member has to press the ‘Approve’-button. If the button shows up green, then there is at least one change in the list that has not been approved by you. The list shows in more detail which action has been approved by which team member.
Hint: The Experiment button in the top-center of the screen shows you the overall status of approval. If it is red, there are some changes somewhere in the diagram that have not been approved by every team member. If it is green, then everything has been approved.
A.4.
Keyboard Layout Sheet
A.5.
Pre-Test Questionnaire
Pre-Test Questionnaire (1/4) Statistical What is your age? What is your gender? Male/female Is English your first language? Yes/no
Pre-Test Questionnaire (2/4) Process Modelling Knowledge After exclusive choices, at most one alternative path is executed. True/false Exclusive choices can be used to model repetition. True/false Synchronization means that two activities are executed at the same time. True/false An inclusive OR can activate concurrent paths. True/false If two activities are concurrent, they have to be executed at the same time. True/false If an activity is modelled to be part of a loop, it has to be executed at least once. True/false Having an AND-split at the exit of a loop can lead to non-termination. True/false A deadlock is the result of an inappropriate combination of splits and joins. True/false Processes without loops cannot deadlock. True/false Both an AND-join or an XOR-join can be used as a correct counterpart of an OR-split. True/false How often do you encounter process models in practice? · · · ·
never less than once a month more than once a month daily
When did you first work with process models in practice? · · · ·
less than a month ago less than a year ago less than three years ago more than three years ago
Pre-Test Questionnaire (3/4) Domain knowledge How well do you understand the process of human digestion? "not at all" - "very well" Which of the following organs is mainly involved in digestion? · · · ·
brain heart lungs stomach
Which of the following is not absorbed by the digestive system? · · · ·
carbohydrates proteins fats fibre
Which is unrelated to the process of digestion? · · · ·
pepsinogen hydrochloric acid bile urine
Which one is a function of the pancreatic enzymes? · · · ·
digest carbohydrates regulate acidity of food neutralize bad tastes trigger movement of intestines
Food that has a high Glycemic Index (GI)... · · · ·
...rapidly raises the glucose (sugar) level in the blood. ...slowly raises the glucose (sugar) level in the blood. ...rapidly lowers the glucose (sugar) level in the blood. ...slowly lowers the glucose (sugar) level in the blood.
Pre-Test Questionnaire (4/4) Virtual World Experience I feel competent in using a computer. "strongly disagree" - "strongly agree”
For how many years have you been using computers? On average, how many hours a day have you spent using a computer in the last year? How often do you play games that require navigating a 3-dimensional virtual space? · · · ·
never less than once a month more than once a month daily
A.6.
BPMN Diagram
Figure 5: BPMN diagram of human digestion
A.7.
BPMN Diagram Errors
Syntactic errors: ·
The task “Continuously secret bile” is not reachable as it has no incoming sequence flow. To fix this error a start event connecting to this task with a sequence flow has to be added. Figure 6 shows the first error and solution.
Figure 6: Syntactic error 1 - missing start event (left: error, right: solution)
·
The state “Too much fat in blood” is incorrectly represented as an activity in the process when it should be represented as a condition. To fix this error, the task has to be removed and has to be made a condition of the preceding OR-split by adding a label to the relevant outgoing sequence flow. Figure 7 shows the second error and solution.
Figure 7: Syntactic error 2 - state as task (left: error, right: solution)
·
Mismatching splits and joins at the tasks “Absorb water” and “Absorb salts” mean that the process can “deadlock” and never finish. Since both water and salts are absorbed in parallel, here changing the split to an “AND” is the correct approach. This error and the solution are shown in Figure 8.
Figure 8: Syntactic error 3 - deadlock (left: error, right: solution)
Semantic errors:
·
No boiling occurs as part of the process of digestion inside the human body, so the activity “Boil chyme” should not exist in the model. Consequently, the activity has to be removed and the preceding and following task need to be connected directly. Figure 9 shows this error and the correct solution.
Figure 9: Semantic error 1 - non-existent task (left: error, right: solution)
·
The task “Secrete pancreatic enzymes” occurs in the pancreas, not in the mouth. Furthermore, the related start event was left in the correct lane to make this error even more obvious. Therefore, this task needs to be moved from the swimlane “Mouth” into the swimlane “Pancreas”. Both error and solution are shown in Figure 10.
Figure 10: Semantic error 2 - wrong role assignment (left: error, right: solution)
·
Even though gurgling sounds do occur during digestion, “Make gurgling sounds” is not a purposeful activity of the process of digestion. This error can be fixed by removing the task and connecting the incoming sequence flow directly to the succeed activity, as shown Figure 11.
Figure 11: Semantic error 3 - irrelevant task (left: error, right: solution)
A.8.
Flowchart Diagram
Figure 12: Flowchart of human digestion
A.9.
Flow-chart Diagram Errors
The following six errors were added to the flow-chart: ·
The process description says “Chewing the food cuts and mixes food”, so the label “Cut & Dehydrate food” is incorrect and needs to be changed to “Cut & mix food”, as shown in Figure 13.
Figure 13: Flowchart Error 1 – Incorrect label (left: error, right: solution)
·
The process description says “The digestive juices start digesting proteins. At the same time the chyme is moved to the small intestine”. Therefore, an activity “Digest proteins” is missing and needs to be added after the activity “Mix food with digestive juices” and parallel to “Move chyme to small intestine”, as shown in Figure 14.
·
Boiling is not mentioned anywhere in the process description and therefore the fake activity “Boil chyme” should be removed from the flowchart, as shown in Figure 14.
Figure 14: Flowchart Error 2 and Error 3 – Missing activity and bogus activity (top: error, bottom: solution)
·
The activity “Secrete bile” is unconnected in the diagram. Following the process description, the start event leads to “Secrete bile”. Furthermore, the description says that “Secrete bile” needs to be connected after the mixture has been neutralized and therefore connects to the “Once all preceding are done” check after that activity, just like the “Secrete pancreatic juice” activity, as shown in Figure 15
Figure 15: Flowchart Error 4 – Missing relations (top: error, bottom: solution)
·
The order of the activity “Absorb salts” and the check “Once both are done” is illogical. Accordingly, the labels need to be changed, as shown in Figure 16.
Figure 16: Flowchart Error 5 – Incorrect flow control (left: error, right: solution)
·
Following the description, the absorbed materials are first moved to the liver, then detoxified and then processed, so the sequence of these activities in the flow-chart is incorrect. Figure 17 shows this error and the correct sequencing.
Figure 17: Flowchart Error 6 – Incorrect sequencing (left: error, right: solution)
A.10. Post-Test Questionnaire
Subjective Cognitive Load [70] I found the task difficult ["strongly disagree" - "strongly agree"]. I found operating the prototype difficult ["strongly disagree" - "strongly agree"]. I found communicating with other collaborators difficult ["strongly disagree" - "strongly agree"] I found the diagram to be complex ["strongly disagree" - "strongly agree"] I found the diagram to be difficult to understand ["strongly disagree" - "strongly agree"]
Free Comments Comments about the tool: Comments about the communication features: Comments about the experiment:
A.11. Process Description Process Description: The process of digestion begins with food. Seeing and thinking about food while the food is moved into the mouth triggers the secretion of a number of digestive fluids throughout the body. These fluids include saliva in the mouth, digestive juices in the stomach, and aqueous alkaline solution, pancreatic juice and bile in the small intestine. Chewing the food cuts and mixes food and saliva into a pulp. The saliva begins to digest carbohydrates. At the same time food is swallowed to move the food pulp to the stomach. The stomach movement then mixes the food pulp with the digestive juices. The resulting mixture is referred to as chyme. The digestive juices start digesting proteins. At the same time the chyme is moved to the small intestine. The mixture is acidic at this stage. To neutralize it aqueous alkaline solution is secreted into the chyme and pancreatic juice and bile are added to the mixture. This accelerates existing digestion processes and begins the digestion of fats. Once the digestion of carbohydrates, proteins and fats has finished the products of the digestion are absorbed. The remaining waste is moved into the large intestine where water and salts are extracted from it. What remains after that is removed from the body by excretion. While the food waste is moved into the large intestine the materials that have been absorbed after the digestion of carbohydrates, proteins and fats are transported to the liver, where they are detoxified. Afterwards the materials are processed. The nutrients are then transported to cells throughout the body via the bloodstream.
Appendix B – Measures and Correlations B.1.
Dependent Variables
Measure
Source
Rationale
Completion Time
[17,44]
Errors Found
-
Availability of visual features in remote collaboration affects communication efficiency and as a result task completion time [17,44]. Dimensions of outcome quality for the given task.
Errors Fixed Subjective Cognitive Load
[70]
B.2.
Covariates
Measure Age Gender English as Second Language Team member familiarity Process modelling knowledge Process modelling intensity Process modelling experience Domain knowledge Subjective Computer Use Competency Computer Experience Computer Use Intensity Virtual Game Use Intensity
B.3.
Visual cues might increase complexity of using the tool [41] or cognitive effort of communication [79].
Source [80] [71] [67]
Rationale Studies of CVEs showed that gender differences in communication affected collaborative performance [3,41]. Non-native language affects comprehension of process models [80]. Team familiarity has also been shown to affect team performance [71]. Process modelling knowledge and experience affects comprehension of process models [67].
[67] [67] [similar to ,79] [81] [81] [81] -
Domain knowledge affects comprehension of conceptual models [62]. Computer experience affects exploration of new technology [81].
Gaming experience increases familiarity with virtual environments.
Correlations between dependent measures
Variable Experiment Duration Errors Found Errors Fixed
Experiment Errors Found Errors Fixed Duration 1.00 0.19 -0.09 (p = 0.24) (p = 0.59) 1.00 0.57 (p = 0.00) 1.00
Highlights -
We present design principles for 3D virtual environment collaboration technology for process diagram creation and validation.
-
We present a proof-of-concept implementation of the technology.
-
We present findings from two studies of collaborative validation of a process diagram, qualitative and quantitative.