IEEE TRANSACTIONS ON POWER DELIVERY, VOL. 29, NO. 1, FEBRUARY 2014
13
Evaluation of ZigBee Wireless Sensor Networks Under High Power Disturbances F. M. Sallabi, A. M. Gaouda, A. H. El-Hag, and M. M. A. Salama, Fellow, IEEE
Abstract—The goal of the research presented in this paper is to investigate the reliability of ZigBee-based wireless sensor networks in transforming existing power systems into future smart grids. The performance of the communication network for a specific propagation environment, channel modulation, and frequency band is investigated. The high-power interrupting disturbances generated from harsh normal and abnormal operating conditions in a power system environment are investigated. Laboratory-simulated switching transient events have been generated under different conditions. The interruption limits due to the radio-frequency signals generated during high-power switching transients are defined for ZigBee coordinator and device units. Index Terms—Impulsive transients, partial discharge (PD), wireless sensors, ZigBee.
I. INTRODUCTION
A
DIVERSE set of applications for sensor networks has already emerged for use in a number of fields, including energy, machine malfunctions, medicine, agriculture, the environment, motion tracking, and many others. The delivery of the IEEE 802.15.4 standard for physical and medium-access control (MAC) layers and the development of a ZigBee standard for network and application layers have paved the way for the broad acceptance of sensor devices in a wide variety of applications [1]. Increasing the efficiency of energy delivery, enhancing the reliability of the power system, and mitigating the adverse impact of conventional fuel plants on the environment can all be achieved through increases in the intelligence level of power systems [2]. Intelligent power networks are expected to incorporate millions of sensors, all connected through an advanced, two-way communication and data-acquisition system in order to provide real-time monitoring, diagnosis, and control. IEEE 802.11 (Wi-Fi), IEEE 802.15.1 (Bluetooth), IEEE 802.15.3 (UWB), and IEEE 802.15.4 (ZigBee) are possible Manuscript received December 13, 2011; revised April 02, 2012; accepted May 13, 2012. Date of publication December 17, 2013; date of current version January 21, 2014. Paper no. TPWRD-01058-2011. F. M. Sallabi is with the Faculty of Information Technology, United Arab Emirates University, United Arab Emirates (e-mail:
[email protected]). A. M. Gaouda is with the Electrical Engineering Department, United Arab Emirates University, United Arab Emirates (e-mail:
[email protected]). A. H. El-Hag is with the Electrical Engineering Department, American University of Sharjah, United Arab Emirates (e-mail:
[email protected]). M. M. A. Salama is with the Electrical and Computer Engineering Department, University of Waterloo, Waterloo, ON N2L 3G1 Canada (e-mail:
[email protected]). Color versions of one or more of the figures in this paper are available online at http://ieeexplore.ieee.org. Digital Object Identifier 10.1109/TPWRD.2013.2290300
candidates for integrating sensors with wireless technologies in order to provide reliable data and to transform existing power systems into smart grids. ZigBee offers a self-forming, self-healing, secure wireless communication protocol enabled by a mesh topology supported by a low data rate, low cost, and low power consumption. These attractive features make ZigBee a good candidate for application in a smart-grid environment [3], [4]. The U.S. Department of Energy (DOE) expects that the widespread deployment of wireless sensor networks (WSNs) in industry could improve overall production efficiency by 11% to 18% and, in addition, reduce industrial emissions by more than 25% [5], [6]. Nonetheless, with the adverse effects of the harsh operating conditions and high noise levels that are common in electric substations, many researchers have investigated the application of an IEEE 802.15.4-compliant sensor network in such an environment and with a view to its use in future smart grids. In [7] and [8], background noise, channel characteristics, and attenuation in the 2.4 GHz frequency band were investigated. A variety of communication links, including both line-of-sight (LOS) and non-line-of-sight (NLOS) scenarios, was considered for different electric power system environments: a 500 kV substation, an industrial power control room, and an underground network transformer vault. No control on the shape and amplitude of the applied power system transients was considered in this study. In [9], the interference between Zigbee channels and wireless local-area networks (WLANs) that is based on IEEE 802.11 specifications was discussed. The study evaluated the performance of ZigBee in coexistence with WiFi and proposed an energy detection approach along with an active scan for smart channel selection as a means of avoiding channel interference. As with residential, commercial, and business buildings, electrical substations and external high-voltage power system environments pose serious challenges with respect to the reliability of WSN communications in smart-grid applications [7]. Electric power systems may be subject to a wide range of disturbances that are generated during normal or abnormal system operating conditions. High-power disturbances (HPDs) may affect wireless communication systems that operate inside the 2.4 GHz industrial-scientific-medical (ISM) band as well as their electronic circuits [10]. Defining the limits of the power system transients that may interfere with or cause the failure of ZigBee networks is crucial for the effective operation of a smart grid. The goal of the research presented in this paper was to investigate the reliability of a ZigBee-based WSN when it is incorporated into a smart grid. In addition to examining the data size and real-time requirements of power systems, the study also explored the effect of HPD on ZigBee networks due to switching
0885-8977 © 2013 IEEE. Personal use is permitted, but republication/redistribution requires IEEE permission. See http://www.ieee.org/publications_standards/publications/rights/index.html for more information.
14
IEEE TRANSACTIONS ON POWER DELIVERY, VOL. 29, NO. 1, FEBRUARY 2014
TABLE I RADIO FRONT-END AND PHYSICAL LAYER SPECIFICATIONS
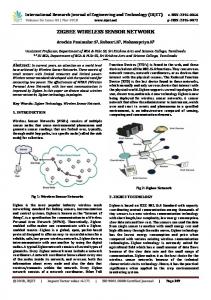
Fig. 1. Impulsive transients during a laboratory coil test: (a) winding voltages, (b) winding currents, and (c) current due to winding-to-ground failure.
transients. The results of this research will set the basis for and define the limits of deploying Zigbee WSNs in power systems. This paper is organized as follows. Section II discusses sources of disturbances in power systems and types of failures that may affect wireless communication systems. A brief introduction to ZigBee is presented in Section III. The ZigBee standard, the IEEE 802.15.4 standard, and the ZigBee throughput and delay constraints are brieflydiscussed in this section. The experimental setup and data collection are presented in Section IV. Section V is a report of the results of the use of ZigBee in a normal and an abnormal power system operation environment. The effect of the rise and delay times of impulsive transients, with different amplitudes, were examined through simulation, and discussed in this section. Discussion and recommendations are presented in Section VI, and Section VII contains the conclusion. II. SUSCEPTIBILITY OF ZIGBEE UNITS SYSTEM DISTURBANCES
TO
POWER
Electrical systems are subject to a variety of power system transients that can be generated externally and internally. External transients are typically more severe but less frequent and can result from lightning, power system switching, and the operation of overcurrent protective devices, such as circuit breakers, reclosers, and fuses. Internally generated transients typically result from switching, either unidirectional or oscillatory, or the operation of a protective device when opened in an inductive circuit [11]. Fig. 1 shows sets of voltages and current signals that result from high-power impulsive transient events due to simulated impulses generated in a high-voltage laboratory. The impulsive voltages applied to motor windings and the impulsive currents that were generated are presented in Fig. 1(a) and (b), respectively. Fig. 1(c) shows the impulsive and oscillatory nature of a current signal generated in a grounding conductor during impulse testing. These signals have a time domain in the range of microseconds or tens of microseconds. The signals also have oscillatory transients superimposed on the impulse and corrupted with noise. The transients mimic the overvoltages and currents that may be produced because of switching events and are characterized by rise time, decay time, and frequency of events. These HPDs can be mapped into the gigahertz frequency band, and their high amplitudes and powers should be seen as a serious threat for systems in their vicinity.
When HPDs exist in a power system, they often result in relatively high-magnitude, short-duration voltages being induced into nearby systems and may affect ZigBee units in one of the following ways [10], [12]: • Generated electromagnetic signals with a wide frequency band may cause communication interference with ZigBee devices and result in loss or delay of data packets. • The breakdown failure of a communication link and the system will return to function only after it is reset. • A destruction failure where physical damage occurs to the system and will not recover without hardware repair. Although radio propagation measurements exist in office buildings or factories, link-quality characterization of ZigBee networks in power system environments is yet to be seriously studied and addressed [7], and the performance of Zigbee wireless sensors under a variety of HPD events should therefore be investigated. For power systems operating under normal conditions, a ZigBee network also provides an effective level of real-time monitoring through the use of rms values, power, phase shift, temperature, and frequency. However, a ZigBee network has a serious limitation with respect to the real-time requirement for monitoring the raw data (voltage and current signals) associated with a high sampling rate. Due to the small size of a ZigBee packet payload, large amounts of raw data must be transferred as a series of packets, which might exceed the real-time requirements. This limitation should therefore be investigated and defined. III. ZIGBEE OVERVIEW The ZigBee Alliance has developed a specification for a reliable, cost-effective, low-power, low-data-rate wireless networking protocol that is built on top of the IEEE802.15.4 standard [13], [14]. The IEEE 802.15.4 standard defines the physical and MAC layers for low-cost, low-rate personal area networks, while ZigBee defines the network layer specifications for star, tree, and peer-to-peer network topologies and provides a framework for the application programming in the application layer. A. IEEE 802.15.4 Standard The IEEE 802.15.4 standard [14] defines the characteristics of the physical and MAC layers for low-rate wireless personal area networks (LR-WPANs). The physical layer supports three frequency bands for all of which the access mode is a direct sequence spread spectrum (DSSS). Table I summarizes the main features of the three bands. The physical layer also supports functionalities for channel selection, link quality estimation, energy detection measurement, and clear channel assessment.
SALLABI et al.: EVALUATION OF ZIGBEE WSNS
Two different types of devices can participate in an IEEE 802.15.4 network: a full-function device (FFD) and a reducedfunction device (RFD) [14]. An FFD can operate in three modes, serving as a personal-area network (PAN) coordinator, a coordinator, or a device. An FFD can talk to RFDs or other FFDs, while an RFD can talk only to an FFD. Two main types of network topology are considered in IEEE 802.15.4: a star topology and peer-to-peer topology. A star topology is based on a masterslave network model, in which an FFD fills the role of PAN coordinator, and the other nodes can be RFDs or FFDs that communicate only with the PAN coordinator. In a peer-to-peer topology, an FFD can talk to other FFDs within its radio range and can relay messages to other FFDs outside of its radio coverage through an intermediate FFD, thus forming a multi-hop network. A PAN coordinator is selected to administer the operation of the network [1].
15
Fig. 2. Impulse test of a 4 kV coil from an induction machine a—experimental setup and b—ZigBee device unit and measuring CT. TABLE II TECHNICAL SPECIFICATION OF THE XBEE UNIT
B. ZigBee Standard The ZigBee standard [4] specifies the higher layers of the protocol stack. The network layer (NWK) is in charge of organizing and providing routing over a multi-hop network (built on top of the IEEE 802.15.4 functionalities), and the purpose of the application layer (APL) is to provide a framework for distributed application development and communication. C. Real-Time Constraints of IEEE 802.15.4 Standard In some power system applications, a real-time response is considered a vital requirement. Power system protection requires a stringent real-time response, while asset management does not impose any real-time requirements. On the other hand, power system protection generates small amounts of data that might take only a few packets to send, but asset management usually generates large amounts of data that require many packet transmissions. Hence, the performance of WSNs based on IEEE 802.15.4, such as a ZigBee, should be investigated with consideration of these requirements. Hence the delay and throughput constraints that WSNs impose on data transmission should be analyzed. Using the data presented in the Appendix, the total time to send one frame is therefore equal to 7.168 ms. To find the effective data rate for the ZigBee device, the actual payload of the ZigBee device is divided by the total time. In this case, an XBee Series 2 module was used, which employs more header bytes for mesh networking and can send a maximum of a 72 byte payload. The effective data rate for transferring an XBee Series 2 payload is thus equal to 80.357 kb/s. IV. EXPERIMENTAL SETUP AND DATA COLLECTION To investigate the behavior of the ZigBee network, experiments were conducted under impulsive transients. The impulse transients were generated using a 600 kV, 30 kJ impulse generator that can produce a steep front fast impulse with less than 200 ns rise time, which mimics the transients due to the opening of the circuit breaker [15], [16]. The impulse waveform was measured using a 500 pF capacitor divider with a ratio of 600:1.4 and a 200 MHz bandwidth digital oscilloscope. The impulse test setup is shown in Fig. 2. The stator winding of
a 4 kV induction machine was subjected to turn-to-turn and turn-to-ground steep front impulse voltages with a rise time of 100 ns. The ZigBee device unit was located close to the current transformer (CT), and the quality of the communication quality was observed. The XBee Series 2 OEM RF modules [17] that were used in the research reported in this paper operate within the ZigBee protocol and fulfill the requirements for low-cost, low-power wireless sensor networks. The modules require minimal power and provide reliable delivery of data between remote devices. The modules operate within the ISM 2.4 GHz frequency band. To form a ZigBee network, a coordinator must be started on a channel and PAN ID. Once the coordinator starts, routers and the end device can join the network. Each router and coordinator can support up to eight end device units. The network formation is governed by the scan channels (SCs), PAN ID (ID), scan duration (SD), and node join time (NJ) commands. Table II presents the specifications of the ZigBee units used in this study. V. APPLICATION AND RESULTS In this application, two XBee Series 2 nodes were used, one as a coordinator unit and the other as a device unit. The distance between the units was varied, and the strength of the applied interruptions was varied. The data size, timeout rate, and quality of the communications were investigated by monitoring the number of good and bad data packets and the value of the received signal strength indicator (RSSI). The three different ways in which the performance of the ZigBee units may be affected were investigated. A fast Fourier transform (FFT) and the energy of the expansion coefficients of a wavelet transform were used to analyze
16
IEEE TRANSACTIONS ON POWER DELIVERY, VOL. 29, NO. 1, FEBRUARY 2014
the data captured and to monitor the energy distribution at a variety of frequency bands [18]. The FFT was computed using the following relation:
(1) where is a discrete signal of sampling points. The discrete wavelet transform (DWT) represents the signal as a series of approximate and detail expansion coefficients and as a combination of the scaling function and the wavelet function , as follows:
(2) where is the scaling factor and is the translation factor. The norm of the wavelet detail coefficients at different resolution levels is used for monitoring the distribution of the signal energy at different resolution levels (frequency bands) [18]. Fig. 3 shows the time domain signals of two current impulses [Fig. 3(a)] along with their FFT and the norm of the wavelet detail coefficients at different resolution levels. Due to the impulsive nature of the signals, the FFT provides a wide picture of the frequency of the signal spread over the whole band but does not easily quantify the impulse variation simultaneously at both low and high frequencies [Fig. 3(b)]. However, the norm maps the impulses into different frequency bands and quantifies the variations at either high or low bands, as shown in Fig. 3(c).
Fig. 3. Analysis of laboratory impulses in frequency and wavelet domains: (a) current impulses at 12 kV and 24 kV, (b) FFT of the current impulses, and (c) norm of the wavelet coefficients of the current impulses.
TABLE III ZIGBEE DEVICE UNIT 2 m FROM THE SOURCE
A. Experimental Analysis Impulsive transients have high power and may generate a high magnitude of electromagnetic waves that might influence the functionality of the ZigBee device and generate a destructive failure. To investigate the effect of power system transients on ZigBee performance, a set of high voltage impulses were applied on the stator windings of a 4 kV induction machine, as shown in Fig. 2. The amplitude of the applied impulses was varied in order to degrade the strength of the coil insulation to the point of complete failure. The distance between the ZigBee service unit and the route of the impulsive transient was also varied; however, the distance between the ZigBee coordinator and the service units was restricted by the grounded shield fence of the HV testing unit. The test was conducted with both aged and new coils, and the following scenarios were considered: Scenario 1: The ZigBee device unit was located 2.0 m from the current transformer (CT) that measures the impulsive current in an old coil winding, and the coordinator was located 3 m from the CT and the service unit. The RSSI was and the data receive timeout was set to 1000 ms. Forty data packets were communicated (loop) between the coordinator and device units, and the applied impulses were varied between 10 kV and 30 kV. As indicated in Table III, for applied impulses of 10 to 25 kV, no communication interference, breakdown failure of a communication link, or destruction failure was reported, and the 40 data
packets were communicated without a single packet loss. With a 30 kV applied impulse, only one data packet was lost. Scenario 2: In the second scenario, the ZigBee end unit was located 10 cm from the CT that was monitoring the old coil. The RSSI was , and the data receive timeout was 1000 ms. A series of data packets (40 to 44 packets) were communicated between the coordinator and the end unit, and the applied impulses were varied between 10 kV and 35 kV. No breakdown failure of a communication link or destruction failure was reported. However, communication interference was reported. As shown in Table IV, in cases in which the applied impulses were low, up to three data packets were lost, but no data packets were lost with higher applied impulses. These results indicate that the quality of the communication may be affected not only by the magnitude of the impulse but also by its shape. Scenario 3: This case is similar to the second scenario; however, the coil being tested was degraded and close to complete failure. A series of data packets (25 to 104) were communicated between the coordinator and the end unit, and the applied impulses were varied between 10 kV and 30 kV. Most of the applied impulses caused communication interference, and some data packets were lost. With a 30 kV impulse, the PER increased, and ZigBee lost communication due to breakdown
SALLABI et al.: EVALUATION OF ZIGBEE WSNS
17
TABLE IV ZIGBEE DEVICE UNIT 10 cm FROM THE SOURCE
TABLE V ZIGBEE DEVICE UNIT 10 CM FROM THE SOURCE (COIL DEFECT CASE)
failure (Table V). During this interruption, the received signal strength became very weak and the RSSI moved very quickly from 55 to 104. The coordinator was interrupted and was no longer integrated with the system. The ZigBee system returned to functioning status after resetting. No destruction failure was reported. B. Theoretical Analysis Fig. 4 shows the stages of the time domain waveforms of the current impulses in the degraded coil up to the complete failure of the winding. The data size is 2500 sampling points, which were captured at a sampling rate of 50 MHz. These current impulses were generated in the coil windings from applied impulsive voltages of 15, 25, 30, and 30 kV, as shown in Fig. 4(a)–(d), respectively. The impulsive current that caused the coil failure is shown in Fig. 4(d). These impulses are characterized by their rise and fall times and by their amplitudes. As the magnitude of the applied impulse increases, the rise time becomes faster. Oscillatory spikes in the nanosecond range also appear at the inception of the application of the impulses (close to 6 s). Enlarged images of these oscillatory spikes are inserted into each figure. The energy of the impulsive current signals is distributed on different frequency bands. This distribution is affected by the amplitude of the applied impulses, the rise and delay times, and the oscillatory spikes superimposed at the inception of the impulse. As the amplitude of the current impulse increases, more energy is generated at different frequency levels. Most of the energy is localized at low frequency bands; however, the fast rise time and the oscillatory spikes generate more energy at high frequency bands, which may interfere with the 2.4 GHz frequency band of the wireless sensors. The norm of the wavelet coefficients at different resolution levels was used to map the time domain impulses into a frequency domain and to localize and quantify their energy at different frequency bands. The norm of the wavelet coefficients of the four current impulses is shown in Fig. 5. The norm shows that most of the energy of the signal is localized at low resolution levels, that is, the 7th to 11th resolutions, which reflect a frequency band of less than 391 kHz. However, as the amplitude of the applied impulse increases, its rise time becomes faster, and more severe oscillatory spikes appear at the inception of the impulse. An increase in the energy of the signal detected
Fig. 4. Current impulses and their starting instant: (a) during a 15 kV impulse, (b) during a 5 kV impulse, (c)during a 30 kV impulse, and (d) during coil failure with a 30 kV impulse.
Fig. 5. Norm of the wavelet coefficients of the current impulses: (a) during a 15 kV impulse, (b) during a 25 kV impulse, (c) during a 30 kV impulse, and (d) during coil failure with a 30 kV impulse.
at the 1st and 2nd resolution levels covers the 6.25–12.5 MHz and 12.25–25 MHz high frequency bands, respectively. This analysis provided a preliminary view of the distribution of the energy of the impulsive currents at different frequency bands. However, the analysis is limited by the sampling rate in the data-capturing oscilloscope, which can map the time domain signal into a wavelet domain that covers only up to a 25 MHz frequency band, which is far removed from the 2.4 GHz frequency band of the wireless sensors. To overcome this problem, the theoretical analysis was extended to include similar impulses simulated at a high sampling rate that covered the 2.4 GHz frequency band.
18
IEEE TRANSACTIONS ON POWER DELIVERY, VOL. 29, NO. 1, FEBRUARY 2014
the very fast oscillatory distorted transients have a significant effect on the distribution of the energy of the signal. A significant amount of the energy of the distorted impulse is localized at the three frequency bands (868–2450 MHz) of the ZigBee units. VI. DISCUSSION AND RECOMMENDATIONS
Fig. 6. Simulated time domain impulses and their energy distribution in frequency domain: (a) fast and slow impulses, (b) norm of the wavelet coefficients of the fast and slow impulses, (c) distorted impulse, and (d) norm of the wavelet coefficients of the distorted impulse.
C. Simulation Analysis The impulsive currents were evaluated using simulated data generated from a PSCAD/EMTDC software simulator [19]. The impulses generated were characterized by features similar to those of the actual laboratory data. The rise and fall times were varied, and the impulses were further corrupted by fast oscillatory spikes that appear at the instant of the application of the impulses, as depicted in the actual laboratory data (Fig. 6). A simulation time step of 0.0001 s (sampling frequency 10 GHz) was selected to represent a data window of 0. 1 ms using sampling points. The wavelet coefficients of the impulsive simulated signals were extracted at different resolutions (frequency bands), and the norm was used to quantify their energy. The first resolution level covers the frequency band of 2.5–5.0 GHz while the second and third cover 1.25–2.5 GHz and 0.625–1.25 GHz, respectively. These three resolutions cover the three frequency bands (868–2450 MHz) of the ZigBee units, as indicated in Table I. Fig. 6 shows a time domain simulated impulse and wavelet domain analysis using the energy distribution for the different frequency bands. Fig. 6(a) and (b) shows the results of the tests conducted to investigate the effect of fast and slow rise and decay times. The of the coefficients [Fig. 6(b)] shows that as the rise and decay times become faster, more energy is localized at the low resolution levels (9th, 10th, and 11th) that cover 19.5–39.1 MHz, 4.9–9.8 MHz, and 9.8–19.5 MHz, respectively. While the fast impulse (red bars) shows a significant change in energy at the 10th resolution, negligible changes in the energy of its signals is detected at the first three resolution levels (0.625–5.0 GHz). Fig. 6(c) and (d) presents the effect of the fast oscillatory spikes that occur at the starting instant of the application of the impulse. The simulated time domain impulse of the slow transient is distorted with random noise, as shown in Fig. 6(c). The of the coefficients [Fig. 6(d)] shows that
High power impulsive transients create a problem with the quality of the operation of wireless sensors. In both aged and healthy coils, as shown in Figs. 4 and 5, when the applied impulse amplitude increases, the rise time becomes faster, and more energy spreads from the low frequency toward the high frequency bands. The oscillatory spikes that appear at the inception of the application of the impulse also become more severe and cause communication interference with the three frequency bands (868–2450 MHz) of ZigBee units. During coil failure, the amplitude of the impulsive current becomes large, and a high impulsive transient appears at the inception of the application of the impulse, which may cause a breakdown failure that requires the resetting of the ZigBee system. These observations are supported by a comparison of the impulse currents and their norm during a 30 kV impulse before and during failure [Fig. 4(c) and (d); Fig. 5(c) and (d); Table V]. The prefailure case shows more energy at the high frequency bands, which results in communication interference, with the loss and delay of many data packets. In the case during failure, [30 kV in Table V; Fig. 4(d); Fig. 5(d)], less energy is detected at high frequency bands. However, an increase in the signal’s power is detected at low frequency bands, which affects the ZigBee coordinator and causes a breakdown failure of a communication link, requiring resetting. No destruction failure was reported during this application. The features of the voltage impulses both prefailure and during failure were also investigated. Fig. 7 shows the laboratory data for an impulsive voltage applied to a healthy coil with extra turn-to-turn insulation. The time domains of the prefailure (40 kV) and of the during-failure (42 kV) impulses are presented in Fig. 7(a) and (b), respectively. The of the coefficients is presented in Fig. 7(c) and (d). Most of the impulse energy is localized at the low resolution levels before coil failure. However, during coil failure, a dramatic reduction in the energy of the voltage impulse at low and medium frequency bands is evident, and an increase in the energy of the signal can be detected at high frequency bands (resolution levels 1 and 2). The XBee Series 2 modules used in the laboratory can send a maximum payload of 72 bytes with a packet transfer time of 7.168 ms, as presented in Section III. Hence, a ZigBee network may provide a real-time monitoring service for applications that require 7.168 ms or more, such as the transmission of single values of rms voltages and currents, and power, phase shift, temperature, and frequency values. However, it may fail to provide real-time service for applications that require the transfer of raw data with a high sampling rate. A transient event data window of 0.1 ms and 2500 sampling points at a 0.04 s sampling interval therefore requires 35 packets, with a total transfer time of 250.88 ms. These specifications apply only if all packets are transferred without error. If the quality of the link is insufficient, some packets might need to be retransmitted, which adds to the transmission delay.
SALLABI et al.: EVALUATION OF ZIGBEE WSNS
19
TABLE VII RELATIONSHIP OF THE FREQUENCY BANDS AND THE RESOLUTION LEVELS OF THE SIMULATED AND LABORATORY SIGNALS
Fig. 7. Laboratory time domain impulses and their energy distribution in a wavelet domain: (a) prefailure voltage, (b) during failure voltage, (c) norm of the impulse coefficients of the prefailure impulse, and (d) norm of the impulse coefficients during failure.
TABLE VI CSMA-CA ALGORITHM PARAMETERS AS DEFINED IN IEEE 802.15.4
WSNs are adequate for monitoring a low data rate in real time, and they can overcome the effect of impulsive and oscillatory transients from HV equipment at the distribution level. However, as the sampling rate of the monitored data increases, then data loggers become essential. Integrating ZigBee units with data loggers and sensitive CTs/VTs can provide an excellent tool for transforming conventional systems into more intelligent ones for asset management and system condition monitoring and diagnosis where real-time data is not required. This study shows that wireless sensors can be implemented to upgrade the autoreclosers, sectionalizers, ring main units, distribution transformers, motors, and capacitor banks of 11 kV systems so that they are appropriate for smart grids. The laboratory experiments show that ZigBee unit location has important effect on the reliability. Defining the optimal locations of the wireless sensors around system’s equipment will enhance the reliability of ZigBee wireless sensors. VII. CONCLUSION This paper has investigated the reliability of ZigBee-based wireless sensor networks under severe interruption conditions that occur in an electric power distribution system. The effects
of impulsive transients were examined using controllable real laboratory data. High power impulsive transients create a problem related to the quality of the operation of the wireless sensors, as indicated by the tests conducted in this study. The oscillatory spikes that appear at the inception of the application of the impulse cause communication interference in the three frequency bands (868–2450 MHz) of ZigBee units, which might result in the loss or delay of data packets. High impulsive transients may cause breakdown failure of a communication link, which requires the resetting of the ZigBee system. This study reveals that ZigBee wireless sensors are adequate for monitoring low data rates in real time, can be integrated with data loggers and sensitive CTs/VTs in order to manage high-sampling-rate data. This can offer an excellent tool for incorporating additional intelligence into conventional distribution systems in the area of asset management where data of high sampling to be collected and real-time application is not essential. APPENDIX CSMA-CA algorithm parameters as defined in IEEE 802.15.4 IEEE 802.15.4 includes the use of two types of channel access mechanisms: non-beacon-enabled and beacon-enabled. Non-beacon-enabled mechanisms use an unslotted carrier sense multiple-access with collision avoidance (CSMA-CA) channel access mechanism, while beacon-enabled mechanisms use a slotted CSMA-CA channel access mechanism. In this study, ZigBee devices were configured to operate in a non-beacon mode using an unslotted CSMA-CA mechanism and transmission that requires acknowledgement. Table VI lists the variables and their values as defined in the IEEE 802.15.4 standard. The total time taken to transfer one frame from an end device to the coordinator, assuming a single hop, consists of the wireless channel access time, the data frame transfer time, the
20
IEEE TRANSACTIONS ON POWER DELIVERY, VOL. 29, NO. 1, FEBRUARY 2014
aTurnaroundTime as defined in Table VI, and the acknowledgement time. REFERENCES [1] P. Baronti, P. Pillai, V. W. C. Chook, S. Chessa, A. Gotta, and Y. F. Hu, “Wireless sensor networks: A survey on the state of the art and the 802.15.4 and ZigBee standards,” Comput. Commun., vol. 30, no. 7, pp. 1655–1695, May 2007. [2] A. Iwayemi, P. Yi, P. Liu, and C. Zhou, “A perfect power demonstration system,” presented at the Innovative Smart Grid Technol., Gaithersburg, MD, USA, Jan. 19–21, 2010. [3] I. F. Akyildiz, W. Su, Y. Sankarasubramaniam, and E. Cayirci, “Wireless sensor networks: A survey,” Comput. Netw., vol. 38, no. 4, pp. 393–422, 2002. [4] K. Ferens, L. Woo, and W. Kinsner, “Performance of ZigBee networks in the presence of broadband electromagnetic noise,” in Proc. Canadian Conf. Elect. Comput. Eng., 2009, pp. 407–410. [5] B. Lu, T. G. Habetler, and R. G. Harley, “A novel motor energy monitoring scheme using wireless sensor networks,” in Proc. 41st Ind. Appl. Soc. Annu. Meeting Ind. Appl. Conf., Tampa, FL, USA, Oct. 2006, pp. 2177–2184. [6] Dept. Energy, “2002 industrial wireless technology for the 21st century,” Washington, DC, USA, Office Energy Efficiency Renew. Energy Rep., 2002. [7] V. C. Gungor, B. Lu, and G. P. Hancke, “Opportunities and challenges of wireless sensor networks in smart grid—A case study of link quality assessments in power distribution systems,” IEEE Trans. Ind. Electron., vol. 57, no. 10, pp. 3557–3564, Oct. 2010. [8] Q. Shanl, I. A. Glover1, P. J. Moore, I. E. Portugues, M. Judd, R. Rutherford, and R. J. Watson, “Impulsive noise environment of high voltage electricity transmission substations and its impact of the performance of ZigBee,” in Proc. Int. Conf. Wireless Commun. Mobile Comput., 2008, pp. 859–863. [9] P. Yi, A. Iwayemi, and C. Zhou, “Frequency agility in a ZigBee network for smart grid application,” presented at the Innovative Smart Grid Technologies, Gaithersburg, MD, USA, Jan. 2010. [10] C. Klünder and J. L. Haseborg, “Effects of high-power and transient disturbances on wireless communication systems operating inside the 2.4 GHz ISM band,” in Proc. IEEE Int. Symp. Electromagn. Compat., 2010, pp. 359–363.
[11] IEEE Guide on Interactions Between Power System Disturbances and Surge-Protective Devices, IEEE Standard C62.48-2005 (Rev. IEEE Standard C62.48-1995). [12] D. Nitsch, M. Camp, F. Sabath, J. L. Haseborg, and H. Garbe, “Susceptibility of some electronic equipment to HPEM threats,” IEEE Trans. Electromagn. Compat., vol. 46, no. 3, pp. 380–389, Aug. 2004. [13] ZigBee Alliance, ZigBee Specifications, Version 1.0, Apr. 2005. [14] Wireless Medium Access Control (MAC) and Physical Layer (PHY) Specifications for Low Rate Wireless Personal Area Networks (LRWPANs), IEEE Standard 802.15.4-2003, Oct. 1, 2003. [15] IEEE Recommended Practice for the Evaluation of the Impulse Voltage Capability of Insulation Systems for AC Electric Machinery Employing Form-Wound Stator Coils, IEEE Standard 792-1995, 1998. [16] IEEE Guide for Testing Turn Insulation of Form-Wound Stator Coils for Alternating-Current Electric Machines, IEEE Standard 522-2004. [17] “Product Manual v1.x.2x—ZigBee Protocol for OEM RF Module,” MaxStream, Inc., 2007, Part nos. XB24-BxIT-00x. [18] A. M. Gaouda and M. M. A. Salama, “DSP wavelet-based tool for monitoring transformers inrush currents and internal faults,” IEEE Trans. Power Del., vol. 25, no. 3, pp. 1258–1267, Jul. 2010. [19] “PSCAD/EMTDC User’s Manual,” Manitoba HVDC Research Centre, Winnipeg, MB, Canada, 2005. F. M. Sallabi, photograph and biography not available at the time of publication.
A. M. Gaouda, photograph and biography not available at the time of publication.
A. H. El-Hag, photograph and biography not available at the time of publication.
M. M. A. Salama (F’02), photograph and biography not available at the time of publication.