for instrumentation, measurement, and analysis of parallel programs target- .... also given as brief introduction to its more advanced capabilities. ...... Seo,. J.: Perfsuite. http://perfsuite.ncsa.uiuc.edu/. 2. Bell, R., Malony, A., Shende, S.: A portable ...
Evolution of a Parallel Performance System Allen D. Malony, Sameer Shende, Alan Morris, Scott Biersdorff, Wyatt Spear, Kevin Huck, and Aroon Nataraj
R is an integrated suite of tools Abstract The TAU Performance System for instrumentation, measurement, and analysis of parallel programs targeting large-scale, high-performance computing (HPC) platforms. Representing over fifteen calendar years and fifty person years of research and development effort, TAU’s driving concerns have been portability, flexibility, interoperability, and scalability. The result is a performance system which has evolved into a leading framework for parallel performance evaluation and problem solving. This paper presents the current state of TAU, overviews the design and function of TAU’s main features, discusses best practices of TAU use, and outlines future development.
1 Introduction Scalable parallel systems have always evolved together with the tools used to observe, understand, and optimize their performance. Next-generation parallel computing environments are guided to a significant degree by what is known about application performance on current machines and how performance factors might be influenced by technological innovations. State-ofthe-art performance tools play an important role in helping us understand application performance and allowing us to focus our attention on future performance concerns. Therefore, performance technology must keep pace with the growing complexity of next-generation parallel platforms if they are to contribute to the present and future promises of high-end parallel computing (HEC). We will need a robust performance frameworks that can provide both flexible and portable empirical performance observation capabilities at all levels of a system. In short, mapping low-level behavior to high-level performance Performance Research Lab, University of Oregon, Eugene, OR, e-mail: {malony,sameer, amorris,scottb,wspear,khuck,anataraj}@cs.uoregon.edu
1
2
Allen D. Malony et al.
abstractions to be understood within a parallel programming paradigm. It will be a challenge to develop such a parallel performance systems. It will need to respond to new requirements for performance evaluation, problem diagnosis, and optimization as parallel computing technology extends it reach to high-end machines of massive scale. There are four design objectives for parallel performance systems that will allow then to keep pace with HEC advancement. First, a performance system should be flexible. It should give maximum opportunity for configuring performance experiments that are of interest. In general, flexibility in empirical performance evaluation implies freedom in experiment design and in the selection and control of experiment mechanisms. Using tools that otherwise limit the type and structure of performance mechanisms will restrict scope of the application that can be evaluated. Second, a performance system should be portable, to allow consistent cross-platform performance problem solving. To achieve Portability one should look for common abstractions in performance methods and how these techniques can be reused across different computing environments. Lack of a portable performance evaluation environment forces users to adopt different techniques on different systems, even for common performance analysis tasks. A third objective is integration. An integrated performance system, by using explicit interfaces and common data formats, can work together as a unified framework. Finally, an interoperable parallel performance system allows performance technology from other tool suites to be leveraged for extended capability. R The TAU Performance System [39, 22, 38, 44] is the product of fifteen years of development to create a robust, flexible, portable, and integrated framework and toolset for performance instrumentation, measurement, analysis, and visualization of large-scale parallel computer systems and applications. The success of the TAU project represents the combined efforts of researchers at the University of Oregon and colleagues at the Research Centre J¨ ulich and Los Alamos National Laboratory. This paper gives an overview of TAU’s system architecture and current suite of tools, as well as discussing ˙ the best practices when using TAUExamples will be drawn from recent work highlighting some of TAU’s new features. Given TAU’s continued evolution as a parallel performance system, the paper will also provide a forecast of what is on the horizon.
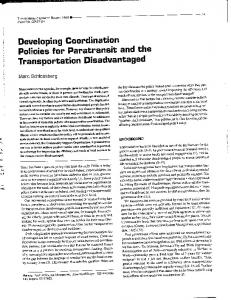
2 TAU Performance System Design and Architecture TAU is designed as a tool framework, wherein tool components and modules integrate and coordinate their operations using well-defined interfaces and data formats. The TAU framework architecture, shown in Fig. 1, is organized into three primary layers – instrumentation, measurement, and analysis – within each layer multiple modules are available and can be configured in
Evolution of a Parallel Performance System
3
a flexible manner by the user. The following sections discuss the layers in more detail, but now let us discuss the overall design decisions that governed TAU’s development.
Fig. 1 TAU framework architecture
TAU is a performance systems based on direct performance observation, whereby execution actions of interest are exposed as events to the performance system through direct insertion of instrumentation in the application, library, or system code, at locations where these actions arise. In general, these actions reflect some execution state, most commonly a result of a code location being reached (e.g., entry in a subroutine). However, it could also include a change in data. The key point is that the observation mechanism is direct. Generated events are made visible to the performance system in this way and contain implicit meta information about the associated action. Thus, for any performance experiment using direct observation, the performance events of interest must be decided beforehand and necessary instrumentation inserted. The role of the instrumentation layer in TAU is to provide support for generating events at the appropriate execution points in the code. Since performance events of interest can be found at different places in the code, TAU provides a range of instrumentation capabilities to gather events from all these locations. The instrumentation function is simple: to insert code that calls the TAU measurement system when a specific action occurs and to gather the appropriate performance data. TAU supports two classes of events: atomic events and interval events. An atomic event denotes a single action. When it occurs, the measurement system has the opportunity to obtain the performance data associated with that action at that time. In contrast, a interval event is really a pair of events: begin and end. The measurement system uses performance data obtained from each event to calculate a combined performance result (e.g., the time spent
4
Allen D. Malony et al.
in a subroutine from entry (beginning of the interval) to exit (end of the interval)). In addition to performance events, direct performance observation methods must obtain information about parallel execution context in order to interpret the parallel performance data. TAU was originally conceived [39] with the goal of supporting alternative models of parallel computation, from shared memory multi-threading to distributed memory message passing to mixed-mode parallelism. Instead of limiting attention to a sub-class of computation models, thereby reducing tool coverage, TAU defines an abstract computation model for parallel systems that captures general architecture and software features and can be mapped straightforwardly to existing complex system types [38]. The practical consequence is that TAU tags parallel performance measurements with node:context:thread information. In the model, a node is defined as a physically distinct machine with one or more processors sharing a physical memory system (i.e., a shared memory multiprocessor (SMP)). A context is a distinct virtual address space within a node providing shared memory support for parallel software execution. Multiple threads of execution can be active within a context. Given performance events and their parallel context, TAU supports the two dominant methods of measurement for direct performance observation: profiling and tracing. Profiling methods compute performance statistics at runtime based on measurements of atomic or interval events. Tracing, on the other hand, records the measurement information for each event (including when it occurred) in a file for future analysis. In profiling, the number of recorded events is fixed, whereas tracing will generate a record for every event occurrence. The TAU performance system supports both parallel profile and parallel trace analysis with profiling tools developed internally as well as tracing tools incorporated from other groups. Overall, TAU’s design has proven to be robust, sound, and highly adaptable to each generations of parallel systems. In recent years, we have extended the TAU performance system architecture to support kernel-level performance integration [29], performance monitoring [32, 30], and collaboration through the TAU Portal [45]. The extensions have been moderate, mainly in the development of new interfaces for performance data access and reporting. In the next sections, TAU’s instrumentation, measurement, and analysis technology is described in more detail. Description of basic TAU usage is also given as brief introduction to its more advanced capabilities.
3 TAU Instrumentation Instrumentation for direct performance observation involves inserting code (a.k.a. probes) to make performance events visible to the measurement substrate and to provide event control. From TAU’s perspective, the execution
Evolution of a Parallel Performance System
5
of a program is regarded as a sequence of significant performance events. As the events are triggered during execution, the probes engage the TAU performance measurement infrastructure to obtain the performance data. Logically, instrumentation is separated from measurement in TAU. The measurement options will determine what performance data is recorded and the type of measurement made for the events, whether profile or trace. On the other hand, instrumentation is focused primarily on event creation and code insertion, how the events are created, where instrumentation is generated, and how code gets placed in the program. 1
3.1 Event Interface Instrumentation is accomplished by inserting probes in the source code of an application. The probes are generated from the TAU event interface, which allows events to be defined, their visibility controlled, and their runtime data structures to be created. Each event has type (atomic, interval), is part of an event group, and has a unique event name represented as a character string. The event name is a powerful way of encoding event information. At runtime, TAU maps the event name to a efficient event ID which is used elsewhere in the event interface. It is important to understand the reasoning behind event names and IDs. IDs are integers that get generated on event creation and act as handles for events during measurement. However, assigning a uniform ID for the same event across node:context:thread boundaries is problematic. Event names make it possible to resolve different IDs to the same event. In addition, it makes dynamic event generation possible. In general, a new event can be created at any time during execution as long as the event name is unique for the thread of execution. This allows for instance, runtime context information to be used in forming an event name (context-based events), or values of routine parameters to be used to distinguish call variants, (parameter-based events). In addition to the atomic and interval event types we discussed above, TAU defines a phase event to identify program phases. This is a type of “logical event” in the sense that it associates logical program aspects with an event, and distinguishes it through separate interfaces routines to the measurement system. They are equivalent to interval events, but have different measurement results. We discuss phases further below. TAU also defines a sample event which is associated with an interruptbased, measurement sampling procedure. A sample event acts like an atomic event, but is set up through a separate interface which connects it to an interrupt handler. Once enabled, an interrupt handler is invoked when the 1
The TAU User’s Manual [46] gives full details on how to use the TAU instrumentation tools. Due to space limitations, we concentrate here instead on the instrumentation approach.
6
Allen D. Malony et al.
corresponding interrupts occur during program execution. Control of interrupt period and selection of system properties to track them are provided in the sample event interface. The purpose of the event control in TAU is to enable and disable a group of events at a coarse level. This allow the focus of instrumentation to be refined at runtime. All groups can be disabled and any set of groups can be selectively enabled. Similarly, all event groups can be enabled initially and then selectively disabled. It is also possible to individually enable and disable events. TAU uses this support internally to throttle high overhead events during measurement.
3.2 Instrumentation Mechanisms Instrumentation can be introduced in a program at several levels of the program transformation process. In fact, it is important to realize that events and event information can be between levels and a complete performance view may require contribution across levels [37]. For these reasons, TAU supports several instrumentation mechanisms based on the code type and transformation level: source (manual, preprocessor, library interposition), binary/dynamic, interpreter, component, and virtual machine. There are multiple factors that affect the choice of what level to instrument, including accessibility, flexibility, portability, concern for intrusion, and functionality. It is not a question of what level is ’correct’ because there are trade-offs for each and different events are visible at different levels. The goal in the TAU performance system is to provide support for several mechanisms that might together be useful.
3.2.1 Source Instrumentation Instrumenting at the source level is the most portable instrumentation approach. Source-level instrumentation can be placed at any point in the program and it allows a direct association between language-and program-level semantics and performance measurements. Using cross-language bindings, TAU implements the event interface in C, C++, Fortran, Java, and Python languages, and provides a higher-level specification in SIDL [20, 40] for cross-language portability and deployment in component-based programming environments[3]. Programmers can use the event API to manually annotate the source code of their program. For certain application projects, this may be the preferred way to control precisely where instrumentation is placed. Of course, manual instrumentation can be tedious and error prone. To address these issues, we have developed a powerful automatic source instrumentation tool,
Evolution of a Parallel Performance System
7
tau instrumentor, for C, C++, and Fortran, based on the program database toolkit (PDT) [21]. The TAU source instrumentor tool can place probes at routine and class method entry/exit, on basic block boundaries, in outer loops, and as part of component proxies. PDT’s robust parsing and source analysis capabilities enable the TAU instrumentor to work with very large and complex source files and inserts probes at all possible points. In contrast to manual instrumentation, automatic instrumentation needs direction on what performance events of interest should be instrumented for in a particular performance experiment. TAU provides support for selective instrumentation in all automatic instrumentation schemes. An event specification file defines which of the possible performance events to instrument by grouping the event names in include and exclude lists. Regular expressions can be used in event name specifiers and file names can be given to restrict instrumentation focus. Selective instrumentation in TAU has proven invaluable as a means to customize performance experiments and to easily “select out” unwanted performance events, such as high frequency, small routines that may generate excessive measurement overhead. Automatic source instrumentation is, in essence, a preprocessor style of instrumentation. There are other preprocessing instrumentation features implemented in TAU. For instance, we can instrument C malloc/f ree calls to use TAU’s memory allocation/deallocation tracking package by redirecting the references to invoke TAU’s corresponding memory wrapper calls with the added information about the line number and the file. The atomic event interface is used in this case. I/O instrumentation is also implemented in this manner. Library wrapping is a form of source instrumentation whereby the original library routines are replaced by instrumented versions which in turn call the original routines. The problem is how to avoid modifying the library calling interface. Some libraries provide support for interposition, where an alternative name-shifted interface to the native library is provided and weak bindings are used for application code linking. Here, library routines can be accessed with both its name shifted interface and the native interface. The advantage of this approach is that library-level instrumentation can be implemented by defining a wrapper interposition library layer that inserts instrumentation calls before and after calls to the native routines. It is also possible through interposition to access arguments passed to the native library. Like other tools, TAU uses MPI’s support for interposition (PMPI [13]) for performance instrumentation purposes. A combination of atomic and interval events are used for MPI. The atomic events allow TAU to track the size of messages in certain routines, for instance, while the interval events capture performance during routine execution. TAU provides a performance instrumented PMPI library for both MPI-1 and MPI-2. In general, automatic library wrapping, with and without interposition, is possible with TAU’s instrumentation tools.
8
Allen D. Malony et al.
Source instrumentation can also be provided in source-to-source translation tools. TAU uses the Opari tool [24] for instrumenting OpenMP applications. Opari rewrites OpenMP directives to introduce instrumentation based on the POMP/POMP-2 [24] event model. TAU implements a POMPcompatible interface that allows OpenMP (POMP) events to be instantiated and measured. In general, source-to-source translation systems can provide a powerful infrastructure for instrumentation support.
3.2.2 Binary / Dynamic Instrumentation Source instrumentation is possible only if the source code is available. TAU leverages other technologies to implement instrumentation support at the binary code level. In particular, DyninstAPI [8] is a dynamic instrumentation package that allows a tool to insert code snippets into a running program using a portable C++ class library. For DyninstAPI to be useful with the TAU measurement system, calls to the event API must be correctly constructed in the code snippets. TAU can then instrument a program at runtime, or alternatively it can re-write the executable image with instrumentation included. The current set of events available to TAU with DyninstAPI are limited to routine entry/exit. It is possible to use selective instrumentation for routine events. DyninstAPI creates a function mapping table to aid in efficient performance measurement. Code snippets are then inserted at entry and exit transition points in each routine. Dynaprof [26] is another tool that uses DyninstAPI for instrumentation and TAU for event creation and measurement.
3.2.3 Interpreter-Based Instrumentation Interpreted language environments present an interesting target for TAU integration. Often such environments support easy integration with native language modules. In this case, it is reasonable to attempt to recreate the source-based instrumentation in the interpreted language, calling through the native language support to the TAU measurement system. However, it is also true that interpreted language environment have built-in support for identifying events and monitoring runtime system actions. TAU has been integrated with Python by leveraging the Python interpreter’s debugging and profiling capabilities to instrument all entry and exit calls. By including a TAU package and passing the top level routine as a parameter to the package’s run method, all Python routines invoked subsequently are instrumented automatically at runtime. A TAU interval event is created when a call is dispatched for the first time. At routine entry and exit points, TAU’s Python API is invoked to start and stop the interval events. TAU’s measurement library is loaded by the interpreter at runtime. Since
Evolution of a Parallel Performance System
9
shared objects are used in Python, instrumentation from multiple levels see the same runtime performance data. Python is particularly interesting since it can be used to dynamically link and control multi-language executable modules. This raises the issue of how to instrument a program constructed from modules derived from different languages and composed at runtime. Because TAU supports multiple instrumentation mechanisms, it is possible to use a combination of them for these types of interpreter-based, dynamically-composed applications.
3.2.4 Instrumentation of Component Software Component technology extends the benefits of scripting systems and objectoriented design to support reuse and interoperability of component software, regardless of language and location [42]. A component is a software object that implements certain functionality and has a well-defined interface that conforms to a component architecture defining rules for how components link and work together [3]. It consists of a collection of ports, where each port represents a set of functions that are publicly available. Ports implemented by a component are known as provides ports, and other ports that a component is uses are known as uses ports. The Common Component Architecture (CCA) [9] is a component-based methodology for developing scientific simulation codes. The architecture consists of a framework which enables components (embodiments of numerical algorithms and physical models) to work together. Components are peers and derive no implementation from others. Components publish their interfaces and use interfaces published by others. Components publishing the same interface and with the same functionality (but perhaps implemented via a different algorithm or data structure) may be transparently substituted for each other in a code or a component assembly. Components are compiled into shared libraries and are loaded in, instantiated, and composed into a useful code at runtime. How should component-based programs be instrumented for performance measurement? The challenge here is in supporting an instrumentation methodology that is consistent with component-based software engineering. The approach taken with TAU for CCA was to develop a TAU performance component that other components could use for performance measurement. The TAU instrumentation API is thus recreated as the performance component’s interface, supporting event creation, event control, and performance query. There are two ways to instrument a component based application using TAU. The first requires calls to the performance component’s measurement port to be added to the source code. This is useful for fine-grained measurements inside the component. The second approach interposes a proxy component in front of a component, thus intercepting the calls to its provides port. In this case, for each edge that represents a port in the component connection
10
Allen D. Malony et al.
graph, we can interpose the proxy along that edge. A proxy component implements a port interface and has provides and uses ports. The provides port is connected to the caller’s uses port and its uses port is connected to the callee’s provides port. To aid in the construction of proxies, it is important to note that we only need to construct only one proxy component for each type of port. Different components that implement a given port use the same proxy component. To automate the process of creating a proxy component, TAU’s proxy generator uses PDT to parse the source code of a component that implements a given port. It infers the arguments and return types of a port and its interfaces and constructs the source code of a proxy component, which when compiled and instantiated in the framework allows us to measure the performance of a component without any changes to its source or object code. This provides a powerful capability to build performance-engineered scientific components that can provide computational quality of service [33] and allows us to build intelligent, performance-aware components.
3.3 Instrumentation Utilities To deliver the richness of instrumentation TAU provides for direct performance observation, it helps to have utilities to reduce the impact on users. Where this is most evident is in building applications with source instrumentation. To simplify the integration of the source instrumentor and the MPI wrapper library in the build process, TAU provides a set of compiler wrappers: tau cc.sh, tau cxx.sh and tau f90.sh that can be invoked instead of a regular compiler. For instance, in an application makefile, the variable F90=mpxlf90 is modified to be F90=tau_f90.sh. This tool invokes the compiler internally after extracting the names of source or object files and compilation parameters. During compilation, it invokes the parser from PDT, then the tau instrumentor for inserting measurement probes into the source code, and compiles the instrumented version of the source to generate the desired object file. It can distinguish between object code creation and linking phases of compilation and during linking, it inserts the MPI wrapper library and the TAU measurement library in the link command line. In this manner, a user can easily integrate TAU’s portable performance instrumentation in the code generation process. Optional parameters can be passed to all four compilation phases. Utilities are also helpful in reducing application reprogramming required just to get instrumentation enabled, such as when an external library must be instrumented without modifying its source. This may be necessary for libraries where the source is not available or for when the library is cumbersome to re-build. TAU’s wrapper generator, tau wrap may be used for such
Evolution of a Parallel Performance System
11
cases. This PDT-based tool will read header files of the original library and generate a new library wrapper header file with preprocessor DEFINE macros to change routine names to TAU routines names. A new wrapped library is created with these instrumented TAU routines, which then calls the original library. This is very similar to what is done for C malloc/free and I/O wrapping, except tau wrap can be used for any library.
4 TAU Measurement The measurement system is the heart and soul of TAU. It has evolved over time to a highly robust, scalable infrastructure portable to all HPC platforms. The instrumentation layer defines which events will be measured and the measurement system selects which performance data metrics to observe. Performance experiments are created by selecting the key events of interest and by configuring measurement modules together into a particular composition [11]. TAU provides portable timing support, integration with hardware performance counters, both parallel profiling and parallel tracing, runtime monitoring, and kernel-level measurement.
4.1 Measurement System Design As shown in Fig. 1, the design of the measurement system is flexible and modular. It is responsible for creating and managing performance events, making measurements from available performance data sources, and recording profile and trace data for each node:context:thread in the execution. Compile-time and execution-time options govern measurement operation. In addition, runtime support is implemented to control TAU measurement function and focus during execution. TAU implements a sophisticated runtime infrastructure for gaining both measurement efficiency and robustness. A core internal component is the runtime representation of the event callstack that captures the nesting relationship of interval performance events. The fact that the performance events are not required to be only routine entry/exit events makes the TAU event callstack a powerful measurement abstraction. In particular, the event callstack is key for managing execution context, allowing TAU to associate this context to the events being measured. The TAU measurement system implements another novel performance observation feature called performance mapping [37]. The ability to associate low-level performance measurements with higher-level execution semantics is important to understanding parallel performance data with respect to the application’s structure and dynamics. Performance mapping provides a mech-
12
Allen D. Malony et al.
anism whereby performance measurements, made for one instrumented event, can be associated with another (semantic) event at a different level of performance observation. TAU has implemented performance mapping as an integral part of its measurement system and uses it to implement sophisticated capabilities not found in other tools. The core measurement support for parallel profiling maintains internal performance data structures for atomic and interval events, called the profile table. New events are created in the profile table by creating a new table entry, recording the event name, and linking in the storage allocated for the event performance data. What is important to understand is the profile table is generic, able to be used for all atomic and interval events, regardless of their complexity. Event type and context information can be recorded in event names and the TAU measurement system hashes and maps these names to determine when a new event has been created or already exists. TAU’s tracing infrastructure focuses on providing efficient, portable, and scalable trace record buffering and I/O. In recent years, it has also become important to interface the measurement infrastructure with sophisticated tracing libraries provided by VTF3 [36], OTF [19], and EPILOG [25]. In contrast to parallel profiling, the measurement system must be concerned with aspects of node:context:thread parallel interactions, especially with regard to timestamp synchronization.
4.2 Performance Data Sources TAU provides access to various sources of performance data. Time is perhaps the most important and ubiquitous performance data metric, but it comes in various forms on different system platforms. TAU provides the user with a flexible choice of time sources based on system availability. At the same time, it abstracts the timer interface so as to insulate the rest of the measurement system from the nuances of different timer implementations. In a similar manner, TAU integrates alternative interfaces for access to hardware counters (PAPI [5] and PCL [4] are supported) and other system-accessible performance data sources. Through TAU configuration, all of the links to these packages are resolved. Within the measurement system, TAU allows for multiple sources of performance data to be concurrently active, making it possible for both profiling and tracing to record multiple performance data. TAU also recognizes that some performance data may come directly from the parallel program. This is supported in two ways. First, the TAU API allows the user to specify a routine to serve as a counter source during performance measurement. Second, the TAU measurement system supplies some internal events and counters that can be used to track program-related performance (e.g., tracking memory utilization and sizes of messages).
Evolution of a Parallel Performance System
13
4.3 Parallel Profiles Profiling characterizes the behavior of an application in terms of its aggregate performance metrics. Profiles are produced by calculating statistics for the selected measured performance data. Different statistics are kept for interval events and atomic events. For interval events, TAU computes exclusive and inclusive metrics for each event. The performance data here must be from monotonically increasing data sources (counter). Typically one source is measured (e.g., time), but the user may configure TAU with the -MULTIPLECOUNTERS configuration option and specify up to 25 metrics (by setting environment variables COUNTER[1-25]) to track during a single execution. For atomic events, the statistics measured include maxima, minima, mean, standard deviation, and the number of samples. When the program execution completes, a separate profile file is created for each node:context:thread instance. The profiling system is optimized to work with the target platform and the profiling operations are very efficient. The TAU profiling system supports several profiling variants. The most basic and standard type of profiling is called flat profiling. If A is an interval event, flat profiles record the exclusive performance for A (i.e., performance while in A). Any time spent in events nested within A will be represented in A’s profile as inclusive time, but it will not be differentiated with respect to the nested events. Flat profiles also keep information on the number of times A occurs and the number of times nested events occurs. TAU can also generate parallel profiles that show performance with respect to event nesting (callstack) relationships. In general, callpath profiling determines the distribution of performance with respect to dynamic event nesting (calling paths) of an application. We speak of the length of a callpath as the number of events represented in the callpath (nesting chain). A callpath profile of length one is a flat profile. A callpath profile of length two is often referred to as a callgraph profile. A callpath of length k represents a sequence of k − 1 nested events with an event, A, at the head of the callpath. The key concept to understand for callpath profiling is that a callpath itself is represented as a single performance event. TAU can generate a callpath profile of any length k (including k = ∞), producing a profile where every callpath of length ≤ k is represented. TAU’s callpath profiling will generate a profile for each callpath of a length designated by TAU CALLPATH DEPTH, not just those that include the topmost root event. For some performance evaluation studies, it is desired to see how the performance is distributed across program parts from a topdown, hierarchical perspective. Thus, a parallel profile that showed how performance data was distributed at different levels of an unfolding event call tree could help to better understand performance behavior. TAU’s implementation of calldepth profiling does just that. It allows the user to configure TAU with the -DEPTHLIMIT option and specify in the the environment variable TAU DEPTH LIMIT how far down the event call tree to observe performance.
14
Allen D. Malony et al.
In this case, the profiles created show performance for each callpath in the rooted call tree pruned to the chosen depth. While callpath profiling and calldepth profiling reveal the distribution of performance event based on nesting relationships, it is equally interesting to observe performance data relative to an execution state. The concept of a phase is common in scientific applications, its how developers think about the structural, logical, and numerical aspects of a computation, and therefore how performance can be interpreted. Phase profiling is an approach to profiling that measures performance relative to the phases of execution. TAU supports an interface to create phases (phase events) and to mark their entry and exit. Internally in the TAU measurement system, when a phase, P , is entered, all subsequent performance will be measured with respect to P until it exits. When phase profiles are recorded, a separate parallel profile is generated for each phase. Phases can be nested, in which case profiling follows normal scoping rules and is associated with the closest parent phase obtained by traversing up the callstack. When phase profiling is enabled, each thread of execution in an application has a default phase corresponding to the top level event. When phase profiling is not enabled, phases events acts just like interval events. Recently, we have implemented support in TAU for recording of the current values of parallel profile measurements while the program is being executed. We call such a profile a parallel profile snapshot. The objective is to collect multiple parallel profile snapshots to generate a time-sequenced representation of the changing performance behavior of a program. In this manner, by analyzing a series of profile snapshot, temporal performance dynamics are revealed. Figure 2 shows a high-level view of the performance profile snapshot workflow. TAU measurement
parallel profile snapshots ..
..
..
{ { {
...
application run on parallel system
tn
t2
Fig. 2 Parallel profile snapshot process
t1
ParaProf
Evolution of a Parallel Performance System
15
4.4 Tracing Parallel profiling aggregates performance metrics for events, but cannot highlight the time varying aspect of the parallel execution. TAU implements robust, portable, and scalable parallel tracing support to log events in timeordered tuples containing a time stamp, a location (e.g., node, thread), an identifier that specifies the type of event, event-specific information, and other performance-related data e.g., hardware counters). All performance events are available for tracing. With tracing enabled, every node:context:thread instance will generate a trace for instrumented events. TAU will write these traces in its modern trace format as well as in VTF3 [36], OTF [19], and EPILOG [25] formats. TAU writes performance traces for post-mortem analysis, but also supports an interface for online trace access. This includes mechanisms for online and hierarchical trace merging [7, 6].
4.5 Measurement Overhead The performance events selected for observation depend mainly on those aspects of the execution that must be measured to satisfy the requirements for performance analysis. However, choice of performance events also depends on the scope and resolution of the performance measurement desired, as this impacts the accuracy of the measurement. The greater the degree of performance instrumentation in a program, the higher the likelihood that the performance measurements will alter the way the program behaves, an outcome termed performance perturbation [23]. In general, most performance tools, including TAU address the problem of performance perturbation indirectly by reducing the overhead of performance measurement. We define performance intrusion as the amount of performance measurement overhead incurred during a performance experiment. We define performance accuracy as the degree to which our performance measures correctly represent “actual” performance. That is, accuracy is associated with error. If we are trying to measure the performance of small events, the error will be higher because of the measurement uncertainty that exists due to the relative size of the overhead versus the event. If we attempt to measure a lot of events, the performance intrusion may be high because of the accumulated measurement overhead, regardless of the measurement accuracy for that event. Performance experiments should be concerned with both performance intrusion and performance accuracy, especially in regards to performance perturbation. TAU is a highly-engineered performance system and delivers excellent measurement efficiencies and low measurement overhead. However, it is easy to naively construct an experiment that will result in significant performance intrusion. TAU implements support to help the user manage
16
Allen D. Malony et al.
the degree of performance instrumentation as a way to better control performance intrusion. The approach is to help the user identify performance events that have either poor measurement accuracy (i.e., they are small) or a high frequency of occurrence. Once these events are identified, the event selection mechanism described above can be used to reduce the instrumentation degree in the next experiment, thereby reducing performance intrusion in the next program run. In addition, TAU implements two runtime techniques for profiling to address performance overhead. The first is event throttling. Here TAU regulates the active performance events by watching to see if performance intrusion is excessive. Environment variables TAU THROTTLE PERCALL and TAU THROTTLE NUMCALLS can be set to disable events that exceed these thresholds at runtime. The second is overhead compensation. Here TAU estimate how much time is spent in various profiling operations. TAU will then attempt to compensate for these profiling overheads while these events are being measured. This is accomplished by subtracting the estimated amount of time dedicated to profiling when calculating time spent for an event. TAU can also compensate for metric besides time (e.g. floating-point operations). To enable measurement compensation the TAU measurement library must be configured with the -COMPENSATE option.
5 TAU Analysis As the complexity of measuring parallel performance increase, the burden falls on analysis and visualization tools to interpret the performance information. If measurement is the heart and soul of the TAU performance system, the analysis tools bring TAU to life. As shown in Fig. 1, TAU includes sophisticated tools for parallel profile analysis and leverages existing trace analysis functionality available in robust external tools, including the Vampir [28] and Expert [49] tools. Let us focus on our work in parallel profile analysis and parallel performance data mining. The S3D [41] parallel application, a high-fidelity finite difference solver for compressible reacting flows, is used as an example.
5.1 Parallel Profile Management The TAU performance measurement system is capable of producing parallel profiles for thousands of node:context:thread instances consisting of hundreds of events. Scalable analysis tools are required to handled this large amount of detailed performance information. Figure 3 shows TAU’s parallel profile analysis environment. It consists of a framework for managing parallel profile
Evolution of a Parallel Performance System
17
data, PerfDMF [17] (expanded in the right figure), and the parallel profile analysis tools, ParaProf [2]. The complete environment is implemented in Java.
Fig. 3 TAU parallel profiling environment: ParaProf and PerfDMF
PerfDMF provides a common foundation for parsing, storing, and querying parallel profiles from multiple performance experiments. It supports the importing profile data from tools other than TAU through the use of embedded translators. These are built with PerfDMF’s utilities and target a common, extensible parallel profile representation. Currently supported profile formats include gprof[15], TAU profiles[38], dynaprof[26], mpiP[47], HPMtoolkit (IBM)[10], and Perfsuite (psrun)[1]. Profile data can also exported as a common XML file. The profile database component is the center of PerfDMF’s persistent data storage. It builds on robust SQL relational database engines, including PostgreSQL[35], MySQL[27], Oracle[34], DB2[18] and Derby [14]. The database component must be able to handle both large-scale performance profiles, consisting of many events and threads of execution, as well as many profiles from multiple performance experiments. To facilitate performance analysis development, the PerfDMF architecture includes a well-documented data management API to abstract query and analysis operation into a more programmatic, non-SQL, form. This layer is intended to complement the SQL interface, which is directly accessible by the analysis tools, with dynamic data management and higher-level query functions. It is anticipated that many analysis programs will utilize this API for implementation. Access to the SQL interface is provided using the Java Database Connectivity (JDBC) API.
18
Allen D. Malony et al.
5.2 Parallel Profile Analysis The ParaProf parallel profile analysis tool included in TAU is capable of processing the richness of parallel profile information produced by the measurement system, both in terms of the profile types (flat, callpath, phase, snapshots) as well as scale. ParaProf provides the users with a highly graphical tool for viewing parallel profile data with respect to different viewing scopes and presentation methods. Profile data can be inputed directly from a PerfDMF database and multiple profiles can be analyzed simultaneously. To get a brief sense of what ParaProf can produce, consider the S3D [41] parallel application as an example. Recently, we investigated the performance of S3D on a hybrid Cray system consisting of XT3 and XT4 processing nodes. Parallel performance profiles were produced when S3D ran on 6400 cores. ParaProf analyzed the full profile and generated the three-dimensional view shown in Fig. 4, left display. Due to the XT3 and XT4 memory performance differences, imbalances resulted in the S3D computation. These are clearly apparent in the ParaProf display. The right display in the figure is a ParaProf scatterplot showing clustering relationships for three significant events, colorcode by processing core type.
Fig. 4 ParaProf displays of S3D performance on hybrid Cray XT3/XT4 system
This example shows just a part of ParaProf’s capabilities. ParaProf can shows parallel profile information in the form of bargraphs, callgraphs, scalable histograms, and cumulative plots. In addition, ParaProf can use these views to display profile snapshots (see Fig. 2, including with animation. ParaProf is also capable of integrating multiple performance profiles for the same performance experiment but using different performance metrics for each. Phase profiles are also fully supported in ParaProf. Users can navigate easily through the phase hierarchy and compare the performance of one phase with another. Figure 5 shows a phase profile display for the Uintah application. Here grid patches were used to identify different computational phases. ParaProf is able to extend its analysis functionality in two ways. First, it is capable of calculating derived statistics from performance metrics. A simple
Evolution of a Parallel Performance System
19
Fig. 5 Parallel profile phases for Uintah grid patches
example of this is “floating point operations per second” derived from two metrics, “floating point counts” and “time.” Second, ParaProf analysis can be programmed with Python, using the Jython scripting interface.
5.3 Parallel Performance Data Mining To provide more sophisticated performance analysis capabilities, we developed support for parallel performance data mining in TAU. PerfExplorer [16] is a framework for performance data mining motivated by our interest in automatic parallel performance analysis and by our concern for extensible and reusable performance tool technology. PerfExplorer is built on PerfDMF and targets large-scale performance analysis for single experiments on thousands of processors and for multiple experiments from parametric studies. PerfExplorer addresses the need to manage large-scale data complexity using techniques such as clustering and dimensionality reduction, and the need to perform automated discovery of relevant data relationships using comparative and correlation analysis techniques. Such data mining operations are engaged in the PerfExplorer framework via an open, flexible interface to statistical analysis and computational packages, including WEKA [48], the R system [43], and Octave [12]. A performance data mining framework should support both advanced analysis techniques as well as extensible meta analysis of performance results. Important components for productive performance analytics are: 1. process control : for scripting analysis processes 2. persistence: for recording results of intermediate analysis
20
Allen D. Malony et al.
3. provenance: mechanisms for retaining analysis results and history 4. metadata: for encoding experiment context 5. reasoning/rules: for capturing relationships between performance data However, the framework must support application developers in the performance discovery process. The ability to engage in process programming, knowledge engineering (metadata and inference rules), and results management allows data mining environments to be created specific to the developer’s concerns. PerfExplorer is being reengineered as shown in Fig. 6 to support these goals.
Fig. 6 TAU PerfExplorer data-mining architecture and component interaction
6 Conclusion and Future Work R has undergone several incarnations in purThe TAU Performance System suit of its objectives: flexibility, portability, integration, interoperability, and scalability. The outcome is a robust technology suite that has significant coverage of the performance problem solving landscape for high-end computing. TAU follows a direct performance observation methodology. We feel this approach is best suited for parallel performance instrumentation, measurement, and analysis since it is based on the observation of effects directly associated with the program’s execution, allowing performance data to be interpreted in the context of the computation. However issues of instrumentation scope and measurement intrusion have to be addressed, but we have pursued these aggressively and enhanced the technology in several ways during TAU’s lifetime. TAU is still evolving. Although not reported here, we are adding support for performance monitoring to TAU which is built on scalable monitoring infrastructure from Supermon and MRNet [32, 30]. The goal here is to en-
Evolution of a Parallel Performance System
21
able opportunities for dynamic performance analysis by allowing global performance information to be accessed at runtime. We are also extending our performance perspective to include observation of kernel operation and its effect on application performance [31]. This perspective will broaden to include parallel I/O and other sub-systems. Our vision here is to evolve TAU to do whole performance evaluation for petascale optimization. With the extreme scale and high integration in petascale platforms, it is difficult to see how reductionist approaches to performance evaluation will be able to support optimization and productivity objectives. Performance of petascale applications and systems should be evaluated in toto, to understand the effects of performance interactions and identify opportunities for optimization based on fully informed decisions. We intend to continue to evolve TAU to do so. Acknowledgements This research is supported by the U.S. Department of Energy, Office of Science, under contracts DE-FG03-01ER25501 and DE-FG02-03ER25561. It is also supported by the U.S. National Science Foundation, Software Development for Cyberinfrastructure (SDCI), under award NSF-SDCI-0722072. The work is further supported by U.S. Department of Defense, High-Performance Computing Modernization Program (HPCMP), Programming Environment and Training (PET) activities through Mississippi State University under the terms of Agreement No. #GSO4TO1BFC0060. The opinions expressed herein are those of the author(s) and do not necessarily reflect the views of the DoD or Mississippi State University.
References 1. Ahn, D., Kufrin, R., Raghuraman, A., Seo, J.: Perfsuite. http://perfsuite.ncsa.uiuc.edu/ 2. Bell, R., Malony, A., Shende, S.: A portable, extensible, and scalable tool for parallel performance profile analysis. In: Proc. EUROPAR 2003 Conference (EUROPAR03) (2003). URL http://www.cs.uoregon.edu/research/paracomp/papers/ parco03/parco03.pdf 3. Bernholdt, D.E., Allan, B.A., Armstrong, R., Bertrand, F., Chiu, K., Dahlgren, T.L., Damevski, K., Elwasif, W.R., Epperly, T.G.W., Govindaraju, M., Katz, D.S., Kohl, J.A., Krishnan, M., Kumfert, G., Larson, J.W., Lefantzi, S., Lewis, M.J., Malony, A.D., McInnes, L., Nieplocha, J., Norris, B., Parker, S.G., Ray, J., Shende, S., Windus, T.L., Zhou, S.: A Component Architecture for High-Performance Scientific Computing. Intl. Journal of High-Performance Computing Applications ACTS Collection Special Issue (2005) 4. Berrendorf, R., Ziegler, H., Mohr, B.: PCL — The Performance Counter Library. http://www.fz-juelich.de/zam/PCL/ 5. Browne, S., Dongarra, J., Garner, N., Ho, G., Mucci, P.: A Portable Programming Interface for Performance Evaluation on Modern Processors. International Journal of High Performance Computing Applications 14(3), 189–204 (2000) 6. Brunst, H., Malony, A.D., Shende, S., Bell, R.: Online Remote Trace Analysis of Parallel Applications on High-Performance Clusters. In: Proceedings of the ISHPC Conference (LNCS 2858), pp. 440–449. Springer (2003) 7. Brunst, H., Nagel, W.E., Malony, A.D.: A Distributed Performance Analysis Architecture for Clusters. In: Proceedings of the IEEE International Conference on Cluster Computing (Cluster 2003), pp. 73–83. IEEE Computer Society (2003)
22
Allen D. Malony et al.
8. Buck, B., Hollingsworth, J.: An API for Runtime Code Patching. Journal of High Performance Computing Applications 14(4), 317–329 (2000) 9. CCA Forum: The Common Component Architecture Forum. http://www.ccaforum.org 10. DeRose, L.: The Hardware Performance Monitor Toolkit. In: Proceedings of the European Conference on Parallel Computing (EuroPar 2001, LNCS 2150), pp. 122–131. Springer (2001) 11. Dongarra, J., Malony, A.D., Moore, S., Mucci, P., Shende, S.: Performance Instrumentation and Measurement for Terascale Systems. In: Proceedings of the ICCS 2003 Conference (LNCS 2660), pp. 53–62 (2003) 12. Eaton, J.W.: Octave home page. URL http://www.octave.org/. Http://www.octave.org/ 13. Forum, M.P.I.: MPI: A Message Passing Interface Standard. International Journal of Supercomputer Applications (Special Issue on MPI) 8(3/4) (1994) 14. Foundation, T.A.S.: Apache derby. URL http://db.apache.org/derby/. Http://db.apache.org/derby/ 15. Graham, S., Kessler, P., McKusick, M.: gprof: A Call Graph Execution Profiler. SIGPLAN ’82 Symposium on Compiler Construction pp. 120–126 (1982) 16. Huck, K., Malony, A.: PerfExplorer: A performance data mining framework for largescale parallel computing. In: Conference on High Performance Networking and Computing (SC’05) (2005) 17. Huck, K., Malony, A., Bell, R., Morris, A.: Design and Implementation of a Parallel Performance Data Management Framework. In: Proc. International Conference on Parallel Processing, ICPP-05 (2005) 18. IBM: IBM DB2 Information Management Software. http://www.ibm.com/software/data 19. Kn¨ upfer, A., Brendel, R., Brunst, H., Mix, H., Nagel, W.E.: Introducing the Open Trace Format (OTF). In: Proceedings of the 6th International Conference on Computational Science, Springer Lecture Notes in Computer Science, vol. 3992, pp. 526–533. Reading, UK (2006) 20. Kohn, S., Kumfert, G., Painter, J., Ribbens, C.: Divorcing Language Dependencies from a Scientific Software Library. In: Proceedings of the 10th SIAM Conference on Parallel Processing (2001) 21. Lindlan, K.A., Cuny, J., Malony, A.D., Shende, S., Mohr, B., Rivenburgh, R., Rasmussen., C.: A Tool Framework for Static and Dynamic Analysis of Object-Oriented Software with Templates. In: Proceedings of SC2000: High Performance Networking and Computing Conference (2000) 22. Malony, A., Shende, S.: Distributed and Parallel Systems: From Concepts to Applications, chap. Performance Technology for Complex Parallel and Distributed Systems, pp. 37–46. Kluwer, Norwell, MA (2000) 23. Malony, A.D.: Performance Observability. Ph.D. thesis, University of Illinois at Urbana-Champaign (1990) 24. Mohr, B., Malony, A.D., Shende, S., Wolf, F.: Towards a Performance Tool Interface for OpenMP: An Approach Based on Directive Rewriting. In: Proceedings of Third European Workshop on OpenMP (2001) 25. Mohr, B., Wolf, F.: KOJAK - A Tool Set for Automatic Performance Analysis of Parallel Applications. In: Proceedings of the European Conference on Parallel Computing (EuroPar 2003, LNCS 2790), pp. 1301–1304. Springer (2003) 26. Mucci, P.: Dynaprof. http://www.cs.utk.edu/ mucci/dynaprof 27. MySQL: MySQL: The World’s Most Popular Open Source Database 28. Nagel, W., Arnold, A., Weber, M., Hoppe, H.C., Solchenbach, K.: VAMPIR: Visualization and Analysis of MPI Resources. Supercomputer 12(1), 69–80 (1996) 29. Nataraj, A., Malony, A.D., Shende, S., Morris, A.: Integrated parallel performance views. Cluster Computing 11(1), 57–73 (2008). DOI http://dx.doi.org/10.1007/ s10586-007-0051-6
Evolution of a Parallel Performance System
23
30. Nataraj, A., Morris, A., Malony, A.D., Arnold, D., Miller, B.: A Framework for Scalable, Parallel Performance Monitoring using TAU and MRNet. Under submission 31. Nataraj, A., Morris, A., Malony, A.D., Sottile, M., Beckman, P.: The Ghost in the Machine: Observing the Effects of Kernel Operation on Parallel Application Performance. In: ACM/IEEE SC2007. Reno, Nevada (2007) 32. Nataraj, A., Sottile, M., Morris, A., Malony, A.D., Shende, S.: TAUoverSupermon : Low-Overhead Online Parallel Performance Monitoring. In: Europar’07: European Conference on Parallel Processing (2007) 33. Norris, B., Ray, J., McInnes, L., Bernholdt, D., Elwasif, W., Malony, A., Shende, S.: Computational quality of service for scientific components. In: Proceedings of the International Symposium on Component-based Software Engineering (CBSE7). Springer (2004) 34. Oracle Corporation: Oracle. http://www.oracle.com 35. PostgreSQL: PostgreSQL: The World’s Most Advanced Open Source Database. http://www.postgresql.org 36. Seidl, S.: VTF3 - A Fast Vampir Trace File Low-Level Management Library. Tech. Rep. ZHR-R-0304, Dresden University of Technology, Center for High-Performance Computing (2003) 37. Shende, S.: The Role of Instrumentation and Mapping in Performance Measurement. Ph.D. thesis, University of Oregon (2001) 38. Shende, S., Malony, A.D.: The TAU parallel performance system. The International Journal of High Performance Computing Applications 20(2), 287–331 (2006). URL http://www.cs.uoregon.edu/research/tau 39. Shende, S., Malony, A.D., Cuny, J., Lindlan, K., Beckman, P., Karmesin, S.: Portable Profiling and Tracing for Parallel Scientific Applications using C++. In: Proceedings of the SIGMETRICS Symposium on Parallel and Distributed Tools, SPDT’98, pp. 134–145 (1998) 40. Shende, S., Malony, A.D., Rasmussen, C., Sottile, M.: A Performance Interface for Component-Based Applications. In: Proceedings of International Workshop on Performance Modeling, Evaluation and Optimization, International Parallel and Distributed Processing Symposium (2003) 41. Subramanya, R., Reddy, R.: Sandia DNS code for 3D compressible flows - Final Report. Tech. Rep. PSC-Sandia-FR-3.0, Pittsburgh Supercomputing Center, PA (2000) 42. Szyperski, C.: Component Software: Beyond Object-Oriented Programming. AddisonWesley (1997) 43. The R Foundation for Statistical Computing: R project for statistical computing (2007). URL http://www.r-project.org. Http://www.r-project.org 44. University of Oregon: TAU Portable Profiling. http://tau.uoregon.edu 45. University of Oregon: TAU Portal. http://tau.nic.uoregon.edu 46. University of Oregon: Tuning and Analysis Utilities User’s Guide. http://www.cs.uoregon.edu/research/paracomp/tau 47. Vetter, J., Chambreau, C.: mpiP: Lightweight, Scalable MPI Profiling. http://www.llnl.gov/CASC/mpip/ 48. Witten, ., Frank, E.: Data Mining: Practical Machine Learning Tools and Techniques. Morgan Kaufmann (2005). URL http://www.cs.waikato.ac.nz/∼ml/weka/ 49. Wolf, F., Mohr, B., Dongarra, J., Moore, S.: Efficient Pattern Search in Large Traces through Successive Refinement. In: Proceedings of the European Conference on Parallel Computing (EuroPar 2004, LNCS 3149), pp. 47–54. Springer (2004)