Sep 14, 1998 - (Received 12 May 1998). We investigate extremal dynamics on random networks. In the quenched case, after a transient time the dynamics is ...
VOLUME 81, NUMBER 11
PHYSICAL REVIEW LETTERS
14 SEPTEMBER 1998
Evolution of Random Networks Kim Christensen,1,2, * Raul Donangelo,1 Belita Koiller,1 and Kim Sneppen3 1
Instituto de Fı´sica, Universidade Federal do Rio de Janeiro, CP 68528, 21945-970 Rio de Janeiro, Brazil 2 Department of Mathematics, Imperial College, 180 Queen’s Gate, London SW7 2BZ, United Kingdom 3 NORDITA, Blegdamsvej 17, DK-2100 Copenhagen Ø, Denmark (Received 12 May 1998) We investigate extremal dynamics on random networks. In the quenched case, after a transient time the dynamics is localized in the largest cluster. The activity in the largest cluster is nonergodic, with hot spots of activity typically centered around nodes with a high coordination number. The nonergodicity of the activity opens for models of evolving networks, which can self-organize into fractal geometries. [S0031-9007(98)07126-9] PACS numbers: 64.60.Lx, 05.40. + j, 05.50. + q, 87.10. + e
The arrangement of units which interacts with one another is of general concern in a variety of fields, ranging from economy to biology and physics. One may think of networks of interdependent technologies, interacting macromolecules [1], genes within a biological organism [2], or species in a coevolutionary framework [3–7], to mention some examples. Such networks may be highly connected, or may consist of many isolated units or small groups, or lie in an intermediate case, forming a marginally connected network. It seems particularly interesting to discuss marginally connected networks, because they represent a regime where the dynamics on the network is conducting with a minimum overall activity [2]. In this paper we first investigate critical quenched random networks. However, it is not a simple task to obtain such a marginally connected network from a static approach, as this demands fine-tuning. Next, we consider extremal dynamics on random networks, as defined in the Bak-Sneppen (BS) model [5], to represent the many diverse forms in which complex systems may interact. Finally, we develop a dynamic of networks, which allows them to evolve into configurations of critical connectivity. When studying networks of interacting units, the usual approach is to arrange the units in some fixed configuration (e.g., in a D-dimensional hypercubic lattice) and let them interact with their neighborhood, which is normally defined as consisting of the nearest units. In a realistic network, it is very unlikely that the neighborhood can be mapped into a regular D-dimensional lattice. It seems more natural to select the neighborhood of a unit freely and not to constrain it to any regular lattice. This will be the general situation whenever the interaction among units under consideration is not determined by the underlying space. Moreover, to keep a fixed configuration in such a situation is also a very strong assumption, which may be unphysical in many cases. Thus it is much more satisfying to relax these two constraints and let the interaction between units be defined on a random network which, eventually, is allowed to evolve by itself.
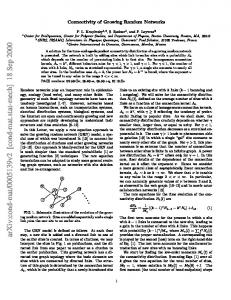
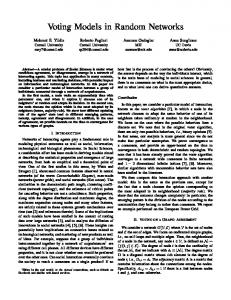
In order to fix ideas we consider a system modeling a biological ecology, but one should keep in mind that the results may as well concern other types of networks. The initial configuration of the ecology consists of N species, each of which has zi neighbors, where zi is a random number with a Poisson distribution with mean kzl. This is done by randomly selecting Nkzly2 bonds among the NsN 2 1dy2 possible ones. In this way we restrict ourselves to a symmetric neighbor relation: if a species i is a neighbor of another j, then j is also a neighbor of i. The N species in the ecology separate, in general, into noninteracting subecologies of sizes n1 , . . . , nm with P m k1 nk N. In the small kzl limit, there are many isolated clusters (m large) which are small in size (nk ø N ; k). In the large kzl limit there are only a few isolated clusters (m small) and the largest cluster contains most of the species. We have measured the strength P maxk hnk yNj of the largest cluster as a function of kzl. Taking an ensemble average, we find, as shown in Fig. 1(a), a phase transition at kzlc 1.00 6 0.01, above which P becomes finite. Indeed, we find that P ~ skzl 2 kzlc db with b 1.00 6 0.05; see Fig. 1(b). The phase transition can also be followed in the inset of Fig. 1(a), where one observes that the average connectivity in the largest cluster kzllargest remains fairly constant when kzl is close to the critical point. The connectivity of the largest cluster at the critical point kzllargest 1.9998 6 0.0005 corresponds to the demand that in a critical branching process on the cluster, the process should be marginally transmitted through each node. At the critical point the distribution of subecologies is a power law Psnd ~ n2tn with tn 2.50 6 0.10 as displayed in Fig. 1(c). This suggests that the phase transition is in the universality class of meanperc field percolation, where b perc 1 and tn 5y2 [8]. We now study evolution on a quenched random network defined by the extremal dynamics of the BS model [5]. In this model one views an ecology as a dynamical system which consists of many species that interact locally with each other. Each species i 1, . . . , N is
2380
© 1998 The American Physical Society
0031-9007y98y81(11)y2380(4)$15.00
VOLUME 81, NUMBER 11
PHYSICAL REVIEW LETTERS
1.0
(a) 0.8 4.0
0.6 largest
P
3.5
0.4
3.0 2.5 2.0 1.5 0.0
0.2
0.0
0
1
2
1.0
2.0
3
3.0
4.0
4
5
10
0
P
(b)
10
10
-1
-2
-3
10
-2
10
10
-1
10
-
0
10
1
c
10 10
P(n)
10 10 10 10 10
-1
(c)
-3 -5 -7 -9
-11 -13 0
10
10
1
10
2
10
n
3
10
4
5
10
14 SEPTEMBER 1998
assigned a fitness parameter Bi , which reflects its overall survival capability. These parameters are initially uniformly distributed between 0 and 1, and the system is allowed to evolve as follows. At each step, the species imin with minimal fitness is located, and it undergoes a mutation: The procedure consists of reassigning a random value for the fitness of imin . This mutation affects the fitnesses of all the species with which it interacts (its neighborhood), so they are also assigned new random fitnesses. The scenario emerging from the BS model is a self-organized critical steady state: regardless of the initial conditions, the fitness distribution of the ecology evolves into a steplike function characterized by a threshold fitness Bc . Furthermore, in the statistically stationary state various physical quantities are power-law distributed. In particular, the size s of an avalanche with threshold B , Bc , defined as the number of successively located minimumsite fitnesses Bimin , such that all Bimin , B. When B ! Bc the avalanche size distribution is a power law: PB ssd ~ s2ts . In standard studies on regular lattices it is found that the power-law avalanche size distribution is robust and depends only on the dimensionality of the lattice. The first- and all-return times of activity to a given species are also characteristic quantities which are power-law distributed [6]. Other studies of the BS dynamics under various regular geometries can be found in [9–13]. When we let the species on a quenched random network evolve according to the BS rules, we observe that, after a transient, changes typically occur only in the largest subecology. In fact, the minimal fitness remaining in a cluster as a function of its size nk can be obtained by noting that the gap Gstd maxt 0 ,t fBmin st 0 dg increases fastest for small clusters [6]. Therefore the minimal fitness in smaller clusters becomes higher than for large clusters, and, thus, in the long time limit, only the largest cluster will be visited. However, some exceptions might exist, for example, if a small cluster has a very high coordination number compared to that of the largest cluster. FIG. 1. (a) The strength P maxk hnk yNj of the largest cluster as a function of the mean coordination number kzl. There is a phase transition at kzlc 1.00 6 0.01 above which a macroscopic number of the species will be interconnected. The inset shows how the average coordination number in the largest cluster kzllargest increases with kzl and reaches a value of 1.9998 6 0.0005 at kzlc . Both curves were obtained with an ensemble average over 100 systems with N 106 . ( b) The strength P of the largest cluster increases with the distance from the critical coordination number kzlc like a power law P ~ skzl 2 kzlc db where b 1.00 6 0.05. The displayed dashed line has a slope b 1. The data represent an ensemble average over 100 systems with N 106 . The excess of P when kzl 2 kzlc # 1022 is an effect of using a finite N. (c) The distribution of cluster sizes Psnd at kzlc displayed in a log-log plot. The data represent an average over 1000 systems of sizes N 106 . The dashed line has a slope of 2tn 22.5.
2381
VOLUME 81, NUMBER 11
PHYSICAL REVIEW LETTERS
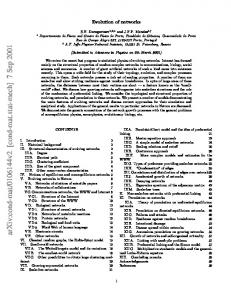
We have simulated the evolution on a quenched random network with neighbor numbers zi selected, as described above, so as to have a mean kzl kzlc . The results are collected after the transient at the statistically stationary state. The avalanche size distribution is displayed by the circles in Fig. 2(a). We find that as B approaches Bc 0.525 6 0.005 from below, the avalanche sizes become power-law distributed. The exponent that emerges when kzl kzlc is ts 1.20 6 0.05.
10
P(s)
10
10
10
10
-1
(a)
-3 -5 -7
= 1 = 2 = 3
-9
-11
10
0
1
10
2
10
10
10
3
4
5
10
10
6
10
7
10
s 60
Relative no. mutations [%]
(b) = 1 = 2 = 3
50
40
30
20
10
0
0
1
2
3
4
5
6
7
8
9
10 11 12 13
z
FIG. 2. (a) The avalanche-size distribution Pssd for the BS model on a quenched random network with a critical coordination number kzl 1 with Bc 0.525 (circles) and above kzl 2 with Bc 0.3446 (squares), and kzl 3 with Bc 0.2575 (triangles). After a transient of 109 mutations, the data were obtained by averaging over 109 mutations in a system of the size of N 217 . The dashed lines correspond to power laws with exponents ts 1.2 and ts 1.5; i.e., one observes different scalings for critical and overcritical networks, respectively. (b) The average number of times that a site becomes active as a function of its coordination number. The graphs refer to a critical kzl 1 (black) and super critical kzl 2 (light grey) and kzl 3 (dark grey) networks, respectively. In each case, simulations were performed in a network of the size of N 217 .
2382
14 SEPTEMBER 1998
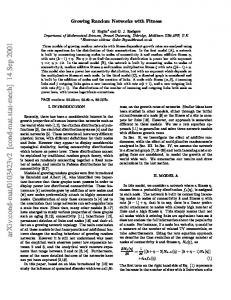
We have also studied the model with kzl . kzlc . Of course, Bc depends on kzl. Increasing the connectivity lowers the threshold fitness Bc [5]. With increasing kzl we observe a crossover to the mean-field value ts 3y2, which is also seen in other versions of the BS model [9,12,13]. This is illustrated in Fig. 2(a), where the avalanche size distribution is given for kzl 2 with Bc 0.3446 and kzl 3 with Bc 0.2575. The different behavior can be explained by looking at the geometry of the network. Starting from a given site, we have measured the total number of units Ms,d within , bonds from a given site. With kzl kzlc we find Ms,d ~ ,Df , with Df 1.88 6 0.05. Thus the dimensionality of the largest cluster in this critical quenched random network is indeed close to 2 which might explain why the critical exponents are close to the 2D exponents. However, when kzl . kzlc , Ms,d increases exponentially and mean-field behavior is to be expected. Finally we have measured, both at and above kzlc , how often different nodes on the largest cluster are visited as a function of the coordination number. In contrast to the BS dynamics on cubic lattices (where zi 2D, independent on i), the BS dynamics on quenched random networks is strongly nonergodic. Thus, although the first- and allreturn-time exponents for all sites are the same, the overall frequency of visits to different species on the largest cluster varies considerably, as seen in Fig. 2(b). There are “hot spots” on the cluster, which are visited much more frequently than the rest of the network. Furthermore, these hot spots are associated with species with the highest number of neighbors, which makes them the most vulnerable ones. The tendency of the BS dynamics to select highly connected regions as the most active ones suggests that extremal dynamics may be an efficient way to dynamically evolve networks to a statistically stationary state of finite connectivity (i.e., .0 and of the order of ,1 independent of the system size N). If modifications in the network are associated to updates in the BS model, then the network should undergo changes especially at the hot spots. To illustrate this point we have considered an updating algorithm where, with a small probability p, one bond is removed (added) from the active site when its number of neighbors zi exceeds (is less than) the local average connectivity. Within a coevolutionary framework, this would represent the possibility that a species might look for isolation from predators, or search for additional food sources, by approaching the average connectivity of its immediate environment. Figure 3 displays the time evolution of the average coordination number in the largest cluster as a function of p. Independent of the initial connectivity of the network, the system selforganizes into a network with average connectivity in the largest cluster kzllargest 2, and cluster size distribution Psnd ~ n22.5 . We note that the present dynamic network model generates networks with a connectivity distribution somewhat narrower than a Poissonian. Accordingly, the
VOLUME 81, NUMBER 11
PHYSICAL REVIEW LETTERS
14 SEPTEMBER 1998
FIG. 3. Evolution of the average coordination number in the largest cluster with the number of mutations. The graphs correspond to the initial conditions kzl 2 (circles) and kzl 3 (squares) with a probability to make local adjustments p 1022 (open) and p 1023 (solid). A statistically stationary attractor for the network is obtained in each case, independent of the initial coordinations and independent of the value of p.
ral solution to memory storage in early life development, it has been shown that ecological feedback circuits are unstable towards evolution of parasitic behaviors [15]. Thus ecological networks driven by population dynamics and occasional mutations typically break down into a few dominant species, as can be easily tested numerically. It has been suggested [15] that some sort of compartmentalization is a prerequisite to obtain some minimal level of complexity. Parametrizing evolution in terms of fitness parameters, instead of population sizes, emphasizes compartmentalization and other natural barriers. We think that modeling ecological networks evolution constrained by barrier dynamics may be a way to add this minimal level of structure into the dynamical evolution of the system. K. C. is grateful for financial support from the Conselho Nacional de Desenvolvimento Cientı´fico e Tecnológico (CNPq–Brazil) and from the European Union Human Capital and Mobility Program Contract No. ERBFMBICT961215. R. D. and B. K. acknowledge partial financial support from CNPq, FAPERJ, FINEP, and FUJB.
observed value of kzl in the total network differs from the value 1.00 obtained, at the critical point, in the case of quenched networks prepared with a Poisson connectivity distribution. In conclusion, we have studied the BS evolution model on random networks. In quenched networks where the coordination numbers are distributed according to a Poisson distribution, we recover, for high average connectivity between the nodes, the infinite dimension (mean-field) result. For a critical average connectivity kzlc 1.00 6 0.01, we find scaling similar to the 2D BS model, and thus consistent with a direct measurement of a dimension 1.88 of the largest cluster. Observing that extremal dynamics on quenched networks tends to concentrate on highly connected nodes, we utilized this to let the network geometry evolve dynamically. We have demonstrated that with a simple dynamical rule the network can self-organize into a critical geometry. Critically connected networks have been suggested by Kauffman as a natural attractor for the genetic networks of living organisms [2,14]. The present study exemplifies how an NK network of N genes, each of them coupled to K neighboring genes, may evolve towards critical geometries (K z , 2). A crucial step in this process is to define the fitness of the network as the corresponding parameter value for the least fit of the N genes, and not, as in the standard NK model [2,14], by the sum of all the fitnesses in the ecology. We should also mention that the use of extremal dynamics may have some advantages over population dynamics approaches to ecological modeling on large time scales. Since Eigen proposed hypercycles [1] as a natu-
*Permanent address: The Blackett Laboratory, Imperial College, Prince Consort Road, London SW7 2BZ, United Kingdom. [1] M. Eigen, Naturwissenschaften 64, 541 (1971). [2] S. A. Kauffman, The Origins of Order (Oxford University, New York, 1993). [3] G. Weisbuch, Complex System Dynamics, Lecture Notes, Santa Fe Institute Vol. II (Addison Wesley, Reading, 1989). [4] S. A. Kauffman and S. J. Johnsen, J. Theor. Biol. 149, 467 (1991). [5] P. Bak and K. Sneppen, Phys. Rev. Lett. 71, 4083 (1993). [6] M. Paczuski, S. Maslov, and P. Bak, Phys. Rev. E 53, 414 (1996). [7] R. V. Solé and S. C. Manrubia, Phys. Rev. E 54, R42 (1996). [8] D. Stauffer and A. Aharony, Introduction to Percolation Theory (Taylor and Francis, London, 1994). [9] S. Boettcher and M. Paczuski, Phys. Rev. Lett. 76, 348 (1996). [10] I. Mróz, A. P¸ekalski, and K. Sznajd-Weron, Phys. Rev. Lett. 76, 3025 (1996). [11] N. Vandewalle and M. Ausloos, Europhys. Lett. 32, 613 (1995); J. Phys. I (France) 5, 1011 (1995); Physica (Amsterdam) 90D, 262 (1996); J. Phys. I (France) 6, 599 (1996). [12] H. Flyvbjerg, K. Sneppen, and P. Bak, Phys. Rev. Lett. 71, 4087 (1993). [13] J. de Boer, B. Derrida, H. Flyvbjerg, A. D. Jackson, and T. Wettig, Phys. Rev. Lett. 73, 906 (1994). [14] S. A. Kauffman, J. Theor. Biol. 22, 437 (1969); J. Theor. Biol. 44, 167 (1974); Physica (Amsterdam) 10D, 145 (1984); Physica (Amsterdam) 42D, 135 (1990); At Home in the Universe (Oxford University, Oxford, 1995). [15] J. M. Smith, Nature (London) 280, 445 (1979).
3.5
-2 = 2, p = 10 -3 = 2, p = 10 -2 = 3, p = 10 -3
largest
3.0
= 3, p = 10
2.5
2.0
1.5
0
1
2
9
3
4
No. mutations [x 10 ]
2383