Recently, we have used the local correlation tracking (LCT) method for mapping horizontal velocity fields in the solar photosphere [Å vanda et al, 2005]. ..... Barry J.: GEOMPACK â a Software Package for the Generation of Meshes Using ...
WDS'05 Proceedings of Contributed Papers, Part III, 457–462, 2005.
ISBN 80-86732-59-2 © MATFYZPRESS
Experiences with the Use of the Local Correlation Tracking Method when Studying Large-Scale Velocity Fields ˇ M. Svanda Charles University, Faculty of Mathematics and Physics, Astronomical Institute, Prague, Czech Republic Academy of Sciences of the Czech Republic, Astronomical Institute, Observatory Ondˇrejov, Czech Republic
M. Sobotka, and M. Klvaˇ na Academy of Sciences of the Czech Republic, Astronomical Institute, Observatory Ondˇrejov, Czech Republic
Abstract. Recently, we have used the local correlation tracking (LCT) method ˇ for mapping horizontal velocity fields in the solar photosphere [Svanda et al, 2005]. The method was applied to processed full-disc dopplergrams acquired by the MDI instrument on board the SoHO observatory. Now, the reliability of this method is verified on synthetic dopplergrams obtained by a very simple numerical simulation of the supergranular pattern. A series of synthetic dopplergrams was stretched by the known vector field and the LCT was applied. The results were compared with the original vector field. Applying the LCT method on synthetic data we got an important experience in the behaviour of this method when used on full-disc dopplergrams. On the basis of the described tests we assume that the use of LCT on full-disc dopplergrams provides sufficiently reliable results, so that method could be used for mapping the large-scale velocities with resolution 60′′ and an accuracy 10 m s−1 .
Introduction The Sun is a very complicated system and we still have rather scarce knowledge about its physics. Many questions concern the dynamics of the visible surface of the Sun – the photosphere. Already the first observers convinced themselves about an irregular temporal variability of the photosphere at the beginning of the 17th century. Migration of the sunspots gave some ideas about both a period and a character of the solar rotation and also about an inclination of the solar rotational axis. First observed velocity structure in the photosphere was the differential rotation in a half of 19th century [Carrington, 1859]. More evidences about an incredible dynamical and maybe chaotic character of motions of observed structures (sunspots, granules and other features) came with the evolution of the observing tools and techniques. The dynamics in the photosphere is in a considerable degree driven by the behaviour of mass in the subsurface convection zone. Motions in the photosphere have, due to the convective feedback, many things in common with magnetic fields; their mutual interaction was not reliably explained yet. The large-scale velocity structures are important for the theory of the global dynamo (the mechanism of generation and transport of the magnetic flux). Many papers were published investigating large-scale structures in the solar photosphere (like giant-cell convection) but it is still difficult to say what are we seeking. Not many systematic studies were done in this topic. An exception are the works by Ambroˇz [2001a, 2001b, and 2002] concerning the large-scale velocity fields derived on the basis of tracking of the magnetic structures. Velocity fields can be obtained also by the local helioseismology (time-distance) method (reviewed by Murdin, [2001]). This method provides generally the full velocity vector. The method is very modern and comparing studies [Ambroˇz, 2005] show that the results obtained when using magnetic structures tracking and when using the time-distance method have a very similar character; on the contrary, we cannot talk about a full match. This discrepancy doesn’t have to mean that one of used methods provides wrong results. It is also possible that both used approaches have many drawbacks.
457
ˇ SVANDA ET AL.: LARGE-SCALE PHOTOSPHERIC VELOCITY FIELDS AND THE LCT METHOD
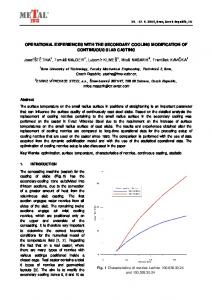
Figure 1. Comparison of the real dopplergram (left, measured by MDI instrument on board the SoHO observatory) and the simulated one (right). Both images are visually very similar.
Data analysis For the study of the large-scale velocity field we decided to use the local correlation tracking (LCT) method. The method was originally designed for removing the seeing-induced distortions in image sequences [November, 1986] and later used for the study of granular motions [November et al, 1988]. For its correct function it needs an existence of distinct structures, serving as tracers carried by the velocity field under study. The algorithm works on the principle of the best match of two frames that record the tracked structures in two different instants. For each pixel in the first frame a small correlation window is chosen and this window is compared with the window of the same size in the second frame. A vector of displacement is then defined as a difference of coordinates of centers of both windows when the best match is found. From this displacement then velocity vector is calculated. For the calculation we use a fast algorithm that was implemented in IDL language by MolownyHoras et al [1994]. The algorithm has limitation in the range of displacements that are checked for each pixel. The quality of correspondence (in our case the sum of absolute differences of both correlation windows) is computed in nine discrete points, then the biquadratic surface is fitted through these nine points and an extremum position [Darvann, 1991] is calculated. The final velocity vector is equivalent to the position of the extremum. In our case the traced structure is the supergranulation pattern in the full-disc dopplergrams. The supergranulation has very suitable properties for tracking (characteristic size 32 Mm, lifetime in order of 10 hours, practically horizontal internal velocity field – see e. g. Wang & Zirin [1989]). Especially a high temporal stability and a good definition almost on the whole solar disc (except for the central area of the disc, where the mostly horizontal internal velocity field does not contribute to the line-of-sight velocity component) makes the supergranulation an excellent tracer. Primary dopplergrams cannot be used for tracking directly because they contain too much noise and other disturbing effects. This effects are removed by a complicated reduction routine containing the elimination of five-minute oscillation using the weighted temporal average [Hathaway, 1988] and elimination of the residual noise by a filtration in a Fourier domain [Hirzberger et al, 1997]. ˇ We got some experience with the application of the LCT method on real data [Svanda et al, 2003, ˇ Svanda et al, 2005]. Properties and behaviour of resulting velocity field had to be taken as a fact and we had to analyze whether the results can correspond to reality. Until now we didn’t have a tool for testing the behaviour of the LCT method on used data. For this purpose we designed and realised a simple simulation with the help of which we can reproduce the supergranulation pattern in full-disc dopplergrams. The simulation is not based on physical principles taking place in the origin and evolution of supergranulation. It is based on a reproduction
458
ˇ SVANDA ET AL.: LARGE-SCALE PHOTOSPHERIC VELOCITY FIELDS AND THE LCT METHOD
Figure 2. Comparison of the amplitude spectra of the real dopplergram (left) and the simulated one (right). For the better visibility of the spectral structures the histogram equalization was applied. 1 px = 2 318 km. When one looks apart from the thick spidery lines coming out from the bottom left corner of the spectrum of real data (caused by a unidentified instrumentation effect near the edge of the real data), both the amplitude spectra would be almost identical. of known parametres that can describe it. Individual synthetic supergranules are characterised as centrically symmetric features described by their position, lifetime (randomly selected according to the measured distribution function of the supergranular lifetime [DeRosa et al, 2000]), maximal diameter (randomly according to its distribution function [Wang & Zirin, 1989]) and characteristic values of their internal horizontal and vertical velocity components (randomly according to their distribution function [Hathaway et al, 2002]). The most important approximation in the whole simulation is the fact that individual supergranules do not influence each other – they simply overlap. New supergranules can arise inside the triangle of neighbouring supergranules (identification of such triangles is done by the Delaunay triangulation – algorithm by Barry [1991]) only if the triangle is not fully covered and if any of the supergranules located at the vertexes of the triangle is not too young (so, in the future it could fully cover the triangle). The position of the origin of the new supergranule is the centroid of the triangle; each vertex is weighted by the size of its supergranule. The simulation is done in the pseudocylindrical Sanson (also Sanson-Flamsteed) coordinate grid1 [Calabretta and Greissen, 2002] and in each step an appropriate part of the simulated supergranular field is transformed into spherical coordinates – the output of the routine is a synthetic dopplergram of the solar hemisphere in the orthographical projection to the disc. The input velocity field is included according to the assumption of the velocity analysis: The supergranules are carried by the velocity field of a larger scale. So, in the simulation only the position of individual supergranules is influenced, no other phenomena are taken into account. The resulting synthetic dopplergrams are visually similar to the measured dopplergrams (Fig. 1). As the demonstration of this fact, we constructed amplitude spectra of both images (Fig. 2) whose character is also similar (this means the occurrence of structures of alike sizes). In the amplitude spectra of the measured dopplergram, a soft asymmetry between the horizontal and vertical direction is visible. It is probably caused by the fact that in general supergranules are not roundish, which is one of the assumptions of the simulation. The disagreements between both amplitude spectra are consequences of simplifications in the simulation and also due to the presence of various noisy phenomena in the real data, which of course were not simulated. The thick spidery lines coming out from the upper left edge of the spectrum of real data are cause by some unidentified instrumentation effect near the edge of the disc in the measured dopplergrams. 1x
= ϑ cos ϕ, y = ϕ, where ϑ and ϕ are heliographic coordinates originating in the centre of the disc.
459
ˇ SVANDA ET AL.: LARGE-SCALE PHOTOSPHERIC VELOCITY FIELDS AND THE LCT METHOD
Figure 3. Results of the reproduction of simple vector fields on a regular pattern. Left – purely zonal flow, right – purely meridional flow. Plotted data correspond to slits along the central meridian. Thick line – original data, solid – velocities obtained using correlation window with FWHM 100 px (200′′ ), dotted – FWHM 50 px (100′′ ), dashed – FWHM 30 px (60′′ ). Arbitrary units means “pixel/lag”, where lag is the time interval between two correlated frames. In our case lag was 16 (4 hours).
Results The ability of the LCT method for the computation of the horizontal velocity field was tested on two types of data: First on a regular texture to estimate the error of the measurement and then on the simulated supergranulation. Tests on a regular texture The regular texture was constructed on the same basis like the synthetic supergranulation. Individual cells were positioned in a regular rectangular grid and the properties of all the cells were equal. Centres of individual supergranules were shifted according to the chosen vector field. We modelled many variants of simple velocity fields (purely zonal from rigid to various differential rotations, purely meridional with various relations to the heliographic latitude, and also various combination of previously described possibilities). Examples of the test results can be seen in Fig. 3. One can clearly see that in case of simple velocity fields the model is very well reproduced. The limitations of the method are clearly seen from the results. When using smaller correlation window the resolution of the result increases and on the other hand also the sensitivity to the numerical noise increases. This is proven especially in areas of small velocities. The value of maximal searched shift was set to 1 px, therefore the magnitudes of bigger velocities (Fig. 3 left) are badly reproduced (the algorithm extrapolates). According to the experience of other authors, it is approved that the best reliability of the LCT algorithm is for displacements below the half of the maximal shift. The asymmetry between computed meridional flows in negative and positive latitudes is very interesting. However, it is no clear yet what can cause this effect, since both the input data and the included vector fields are symmetric with respect to the equator. We estimated the accuracy of the calculation on the regular pattern from the difference of the calculated velocities and their model: 5 m/s. Tests on a synthetic supergranulation When running tests on synthetic supergranulation, the computation was always started from the regular grid. Properties of “supergranules” were chosen randomly according to their real distribution functions. The simulation was performed with the step of 15 minutes and the first 1000 steps were “empty” – no vector velocity field was included and no synthetic dopplergram was calculated. This starting interval was taken for the stabilisation of the supergranular pattern. In the next steps, the vector velocity field was already included (this field influenced only the positions of individual cells) and 96 synthetic dopplergrams were calculated; this corresponds to one observational day in real data. The dopplergrams are calculated with the resolution 2′′ per pixel; the real data from the MDI instrument are provided in this resolution. The series of dopplergrams was then transformed back to the equidistant pseudo-cylindrical coordinate system (Sanson projection) with the same routine that is used for the processing of the real data.
460
ˇ SVANDA ET AL.: LARGE-SCALE PHOTOSPHERIC VELOCITY FIELDS AND THE LCT METHOD
Figure 4. Left – model vector velocity field. Right – velocity field that was computed applying the LCT method on the synthetic supergranulation pattern. The arrow lengths have the same scale.
Figure 5. Left – ratio of the magnitudes of the calculated velocity vectors and the corresponding model. Right – differences in directions of corresponding vectors in degrees. Then, the LCT method was applied on calculated data with the correlation window of 30 pixels FWHM. The lag between a pair of correlated images corresponded to 4 hours in real data. Except for ˇ the FWHM of the correlation window, the routine parametres were equal to those used earlier [Svanda et al, 2005]. From the test it becomes clear that a different quantity of the match has to be used – the sum of absolute differences of both correlation windows instead of the sum of squared differences. Comparing the appearance of the calculated displacement maps with the model (Fig. 4), we can qualify how much is the LCT method successfull with its reproduction. This conclusion can be exactly quantified (Fig. 5); two important quantities characterising the relation between calculated and the model velocity field can be chosen: The ratio of the magnitudes of the corresponding vectors and the difference of their directions. It can be clearly seen from Fig. 5 that significant differences in direction as well as in magnitude can be found only in areas with small velocities (cf. Fig. 4). In these areas, this result can be expected because the signal-to-numerical-noise ratio is very low there – the magnitudes of velocities are
461
ˇ SVANDA ET AL.: LARGE-SCALE PHOTOSPHERIC VELOCITY FIELDS AND THE LCT METHOD
located below the quarter of the maximal shift. The numerical noise has its origin in the way how the extremal value of the correlation is calculated. In case of small velocities, the inaccuracy of the search of extremal value is very high. We used areas of small velocities to estimate the inaccuracies of calculated velocities: When using the described parametres, this inaccuracy is approximately 10 m/s.
Conclusion According to the tests the LCT method is sufficiently usefull for mapping of large-scale velocity fields down to 60′′ . We estimated inaccuracies in the determination of the horizontal velocities – 10 m/s. The estimate of inaccuracy gives us a knowledge of how reliable the calculated velocities are in given areas. It is also clear that the velocities of which the magnitudes are comparable with the inaccuracy have to be treated as unreliable. The situation is the same when velocities are calculated, magnitudes of which are bigger than the limits given by the program. The experience of other authors [Sobotka et al, 1999, Sobotka et al, 2000, and others] who use the LCT method on other kind of data show that the reliability of the direction determination is much better than the velocity magnitude determination. The inaccuracy of the magnitude can be up to 50 % in specific situations. The results of tests applied on the synthetic data will be used when applying the LCT method on real data to study the real vector velocity fields in the solar photosphere in various phases of the solar cycle. Acknowledgments. This work was done thanks the efficient support of the grant projects Czech Science ˇ Foundation (GA CR) 205/03/H144, and 205/04/2129.
References Ambroˇz, P.: Large-Scale Transport of Magnetic Flux on the Sun, Solar Physics, 198, 253–277, 2001a. Ambroˇz, P.: Semiempirical Modeling of Large-Scale Flow on the Sun, Solar Physics, 199, 251–266, 2001b. Ambroˇz, P.: Large-scale Magnetic Field Evolution on Different Time Scales, ESA SP-506: Solar Variability: From Core to Outer Frontiers, 827–830, 2002. Ambroˇz, P.: Large-scale Transport of Magnetic Flux and Flows in Solar Convection Zone, in Large Scale Structures and their Role in Solar Activity, ASP Conference Series, 2005 (accepted). Barry J.: GEOMPACK – a Software Package for the Generation of Meshes Using Geometric Algorithms, Advances in Engineering Software, 13, 325–331, 1991. Calabretta, M. R. and Greissen, E. W.: Representations of Celestial Coordinates in FITS, Astronomy & Astrophysics, 395, 1077-1122, 2002. Carrington, R. C.: On certain Phenomena in the Motions of Solar Spots, Monthly Notices of the Royal Astronomical Society, 19, 81–84, 1859. Darvann, T. A.: Solar Horizontal Flows and Differential Rotation Determined by Local Correlation Tracking of Granulation, Ph.D. thesis, University of Oslo, 1991. DeRosa, M.L., Lisle, J.P., Toomre, J.: Evolving Dynamics of the Supergranular Flow Field, SPD Meeting at Lake Tahoe, article 1.06, 2000 Hathaway, D. H.: Temporal Filters for Isolating Steady Photospheric Flows, Solar Physics, 117, 1–12, 1988. Hathaway, D. H., Beck, J. G., Han, S., Raymond, J.: Radial Flows in Supergranules, Solar Physics, 205, 25–38, 2002. Hirzberger, J., V´ azquez, M., Bonet, J. A., Hanslmeier, A., and Sobotka, M.: Time Series of Solar Granulation Images. I. Differences between Small and Large Granules in Quiet Regions, The Astrophysical Journal, 480, 406–419, 1997. Molowny-Horas, R., Yi, Z.: Internal Report No. 31, Institute of Theoretical Astrophysics, University of Oslo, 1994. Murdin, P.: Helioseismology, Encyclopedia of Astronomy and Astrophysics, Edited by Paul Murdin, article 5128, Bristol: Institute of Physics Publishing, 2001. November, L. J.: Measurement of geometric distortion in a turbulent atmosphere, Applied Optics, 25, 392–397, 1986. November, L. J., and Simon, G. W.: Precise Proper-motion Measurement of Solar Granulation, The Astrophysical Journal, 333, 427–442, 1988. Sobotka, M., V´ azquez, M., Bonet, J. A., Hanslmeier, A., Hirzberger, J.: Temporal Evolution of Fine Structures in and around Solar Pores, The Astrophysical Journal, 511, 436–450, 1999. Sobotka, M., V´ azquez, M., Cuberes, M. S., Bonet, J. A., Hanslmeier, A.: Infrared Photometry of Solar Photospheric Structures. I. Active Regions at the Center of the Disk, The Astrophysical Journal, 544, 1155–1168, 2000. ˇ Svanda, M., Klvaˇ na, M., Sobotka, M.; Bumba, V.: Dynamics of Motions in the Quiet Photosphere, ESA SP-535: Solar variability as an input to the Earth’s environment, 149–152, 2003. ˇ Svanda, M., Klvaˇ na M.; Sobotka, M.: Motions of Supergranular Structures on the Solar Surface, Hvar Observatory Bulletin, 29, 39–48, 2005. Wang, H. and Zirin, H.: Study of Supergranules, Solar Physics, 120, 1–17, 1989.
462