Experiment #5 Amplitude Modulation and Demodulation
Recommend Documents
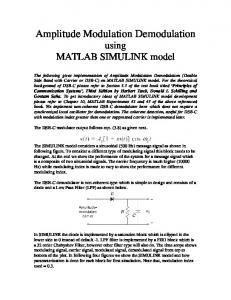
background of DSB-C please refer to Section 3.3 of the text book titled 'Principles of. Communication Systems', Third Edition by Herbert Taub, Donald L Schilling ...
Amplitude Modulation Demodulation using. MATLAB SIMULINK model. The
following gives implementation of Amplitude Modulation Demodulation (Double.
PreLab3. 1/6. Amplitude Modulation and Demodulation Lab#3. Objective. To
observe amplitude modulation/demodulation in the time and frequency domain.
Page 1. LAB - 1. AMPLITUDE MODULATION AND DEMODULATION. 1.1
OBJECTIVE. In this lab, you will learn how to perform the amplitude modulation
and ...
S. BASK. (f) = 1/2 j. ) = 1/2 j (S baseband. (f – f. C. ) + S baseband. (f + f. C. ) ) The
analytical signal for the baseband binary PAM signal is: s baseband. (t) = s.
carrier is discussed from the point of view of optimal demodulation. ... transformation (1) as amplitude modulation of the chaotic carrier x(t), similar to amplitude ...
11 Apr 2012 ... This principle is at the heart of amplitude modulation ... of demodulation, to
recover the original baseband signal from the received version. Fi-.
Emit the signal. – Given the station frequency, a receiver follows a demodulation
... Type of modulation. – Amplitude Modulation -- analog to holography.
Apr 11, 2012 - magnetic waves. To send these electromagnetic waves across long distances in free space, ... bandwidth of about 4 kHz. The typical ... poses, including 802.11b/g (WiFi), various cordless telephones, baby monitors, etc. From.
Sep 4, 2008 - Bennet and Blackstock [3] in 1975 showed the actual ex- istence of ..... [6] Thomas D. Kite, John T. Post, Mark F. Hamilton, âParamet- ric Array in ...
classical amplitude demodulation, but traditional algorithms fail to re- alise the ... 1 s); phonemes (â¼ 10â1 s); glottal pulses (â¼ 10â2 s); and formants (â¼ 10â3 s.
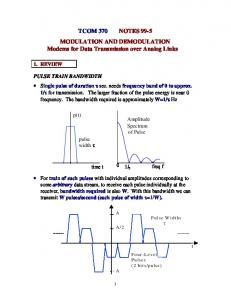
NOTES 99-5. MODULATION AND DEMODULATION .... and DEModulation,
performed by modems. ... FREQUENCY SHIFTING BY AMPLITUDE
MODULATION.
on the various aspects of modulation and demodulation. 16.1 Radio
Broadcasting .... In India, amplitude modulation is used in radio broadcasting.
However, in ...
Amplitude Modulation and Demodulation. By: Prof.G.Kumar, B.E,M.S. Sona
College of Technology,. Electronics and Communication Engineering,. Sona
Nagar ...
AM is one of the modulation techniques where the amplitude of the carrier signal
is ... AM demodulation or detection is a process to detect or to get back the ...
modulation is tested in NI USRP RIO 2920 as transmitter. The carrier frequen- cy used is 555-1650 KHz for amplitude modulation and the carrier frequency is.
two papers published in 1974 by Simon and Smith which concentrated on ..... the topic, in the context of the Global System of Mobile Communications known as GSM ... Further important references are the monograph by Haykin [55], the relevant ...... in
Frequency Modulation, Amplitude Shift Keying, Phase Shift Keying and Frequency Shift. Keying systems. Each of these examples is modeled in Acumen, ...
4.2.2 Demodulation . ... Amplitude Modulation: The amplitude of a sinusoidal
signal with fixed frequency and phase is varied in proportion to a given signal.
Sep 9, 2016 - blocks of complex communication signals produced by humans, animals, ... Human speech is rich in dynamic amplitude modulation (AM) and ...
Novel amplitude and frequency demodulation algorithm for virtual dynamic atomic force microscope. J Kokavecz1,3, Z Tóth2, Z L Horváth3, P Heszler2 and ´A.
Abstract. Rotating modulation collimator (RMC) is an important imaging technique in hard X-ray astronomy. With traditional inversion techniques, the sensitivity, ...
Amplitude modulation of a sine or cosine carrier results in a variation of the .... A sudden, large reduction in the amplitude of the input AM wave means that ...... Related to but not a true form of pulse modulation is pulse code modulation (PCM).
A square law n-channel FET (Field Effect Transistor) will pass a drain-source current. (. )2 p .... will be just one-half of the carrier amplitude (voltage). ..... Charge carriers can't ...... This brings the two frequencies together, and removes thi
Experiment #5 Amplitude Modulation and Demodulation
Amplitude Modulation and Demodulation. Goal. Study of amplitude modulator
and detector circuits and build a tuned RF radio to receive AM broadcast signals.
Indian Institute of Technology Kanpur EE 381 Electrical Engineering Lab-II
2003 – 04; Semester II
Experiment #5 Amplitude Modulation and Demodulation Goal Study of amplitude modulator and detector circuits and build a tuned RF radio to receive AM broadcast signals. Amplitude Modulation and Detection: Amplitude modulated signal can be represented by the following equation: v(t ) = Vc (1 + vm (t )) cos ωc t . Where vm (t ) is the message signal that is modulating the carrier Vc cos ωc t . For simplicity, let us assume that the message signal is a monotone given by the following equation: vm (t ) = Vm cos ωm t The amplitude modulated signal can now be written as: VV v(t ) = Vc (1 + Vm cos ωm t ) cos ωc t = Vc cos ωc t + c m {cos(ωc − ωm )t + cos(ωc + ωm )t} 2 The following figure shows the modulated signal in both time and frequency domains. 2
v(t )
1.5
V 1
Vc
0.5
L1
0
L2
-0.5
VcVm 2
-1 -1.5 -2 0
0.5
1
1.5
2 -3
x 10
fc − f m
t
fc + f m
fc
f
Figure 1: Amplitude modulated signal in time and frequency domains.
The modulation index (m) of an amplitude modulated signal is defined by the following equation V L −L m= m = 2 1 , Vc L2 + L1 which can also be used to calculate the modulation index from the oscilloscope display of the amplitude modulated signal. In this experiment, a Gilbert multiplier cell (MC1496) is used to generate amplitude modulated signal. Figure 2 shows the schematic of MC1496 along with the external components required to realize an amplitude modulator. The potentiometer is used to set the DC level of the modulating signal, which can be used to adjust the modulation index. An envelope detector is used to demodulate the signal. R2
5.6k
R1
5.6k
1k
1k
10k
RB
DC Bias Levels V6=V12=8V V8=V10=4V I5=1mA
-12V Figure 2: Schematic of MC1496 and circuit diagram of an amplitude modulator
Pre-lab tasks: 1. Study the operation of the Gilbert cell multiplier.
Expt5_Amplitude_Modulation
1 of 2
Indian Institute of Technology Kanpur EE 381 Electrical Engineering Lab-II
2003 – 04; Semester II
References: Analysis and design of analog integrated circuits, Gray and Meyer Data sheet of MC1496 (http://onsemi.com) Application Note AN531/D MC1496 Balanced Modulator (http://onsemi.com) 2. Calculate the values of RB, R1, R2, and RL for the bias conditions shown in the figure 2. 3. Design an envelope detector using the diode OA79. Radio Receiver: Figure 3 shows the schematic of a simple radio receiver. The antenna is a long piece of wire. The length of the wire is small compared to the wavelength and hence is not critical in the design. The tuner circuit consists of a parallel combination of variable inductor and capacitor. It is possible to increase (decrease) the inductance by moving the ferrite core in to (out of) the coil. The envelope detector consists of a germanium diode (OA79) and a capacitor connected to ground. The input impedance of the gain stage itself forms the discharge path for the capacitor. The gain stages are realized using ua741 opamps operating in the inverting mode. The output of the second stage can be directly connected to the headphone. Wire Antenna
OA79 Headphone
AM Signal for tuning (output of the circuit shown in Fig. 2)
10k Gain Stages
L
C
Ce
Figure 3: Schematic of a Radio Receiver
Pre-lab work: 1. Study the techniques to measure the resonant frequency and quality factor of tuned circuit. Since the capacitance of the tuner is in the range of 30pF – 300pF, use a coupling element to connect the oscilloscope to the parallel resonant circuit. 2. Design the gain stages to have an input impedance of 10kΩ and a reasonable gain. How do you choose the value of the capacitor used in the envelope detector? You may need to adjust the values of the capacitor and the gain by observing the output on an oscilloscope and listening to the received signal. Laboratory Work Please Note: It is very useful to keep the modulator and the receiver chain as far away as possible. Make sure that the coil and the antenna are as far away as possible from the lines carrying the modulated carrier signal. A suggestion, use the top portion of the board to make the modulator, and make the receiver in the bottom half of the board. Part (a): Amplitude Modulator 1. Assemble the circuit as shown in Fig. 2 and verify the bias conditions without either signal sources connected. 2. Apply the carrier signal (fc=1.4MHz) and the modulating signal (fc=1kHz) from the signal generators and display the AM signal on the oscilloscope. You may have to use a DC blocking capacitor for the modulating signal too. 3. Adjust the potentiometer for different values of the modulation index and plot the AM signal for m=0.2, 0.5, 1.0. 4. Adjust the potentiometer for AM with m=0.5 and connect a diode detector to the modulator output. Display and plot both modulating signal versus modulated and demodulated outputs. You can use these plots to identify if the modulator and detector are linear or not. Part (b): LC Network 1. Set the signal generator to 1.4MHz and connect it to the LC parallel network through a coupling element. 2. Connect the CRO to the LC network using a coupling element. 3. Set a value of inductance by inserting the ferrite rod into the coil and adjust the capacitance until resonance is observed. Measure the quality factor. Measure the Q of the LC network with the inductance at maximum and minimum values. Calculate the 3dB bandwidth for these two cases. 4. Repeat step 3 with the antenna connected to the LC network. Part (c): Radio Receiver 1. Assemble the circuit as shown in Fig. 3. Inject the amplitude modulated signal obtained in part (a) at the LC network through a large resistance. Adjust the inductance and the capacitance until you hear the monotone in the headphone. 2. By now you should be receiving the signals from the AIR Kanpur station. 3. Detune the carrier, and adjust the capacitance so that you can listen in to the broadcast signals. You may need to adjust the values of the capacitor used in the envelope detector and the gain of the amplifier to get the best possible reception. 4. Change the inductance of LC network to the minimum and maximum values and tune in to the broadcast signal. Do you observe any difference? Comment.