Plants 2013, 2, 750-768; doi:10.3390/plants2040750 OPEN ACCESS
plants ISSN 2223-7747 www.mdpi.com/journal/plants Article
Experimental Measurements and Mathematical Modeling of Cytosolic Ca2+ Signatures upon Elicitation by Penta-N-acetylchitopentaose Oligosaccharides in Nicotiana tabacum Cell Cultures Kalina Mrozek, Karsten Niehaus and Petra Lutter * Department of Proteome and Metabolome Research, Faculty of Biology, Bielefeld University, Universit¨atsstr. 25, Bielefeld 33615, Germany; E-Mails:
[email protected] (K.M.);
[email protected] (K.N.) * Author to whom correspondence should be addressed; E-Mail:
[email protected]; Tel.: +49-(0)-521-106-5617. Received: 29 September 2013; in revised form: 4 November 2013 / Accepted: 8 November 2013 / Published: 27 November 2013
Abstract: Plants have developed sophisticated recognition systems for different kinds of pathogens. Pathogen-associated molecular patterns (PAMPs) can induce various defense mechanisms, e.g., the production of reactive oxygen species (ROS) as an early event. Plant defense reactions are initiated by a signal transduction cascade involving the release of calcium ions (Ca2+ ) from both external and internal stores to the plant cytoplasm. This work focuses on the analysis of cytosolic Ca2+ signatures, experimentally and theoretically. Cytosolic Ca2+ signals were measured in Nicotiana tabacum plant cell cultures after elicitation with penta-N-acetylchitopentaose oligosaccharides (Ch5). In order to allow a mathematical simulation of the elicitor-triggered Ca2+ release, the Li and Rinzel model was adapted to the situation in plants. The main features of the Ca2+ response, like the specific shape of the Ca2+ transient and the dose-response relationship, could be reproduced very well. Repeated elicitation of the same cell culture revealed a refractory behavior with respect to the Ca2+ transients for this condition. Detailed analysis of the obtained data resulted in further modifications of the mathematical model, allowing a predictive simulation of Ch5-induced Ca2+ transients. The promising results may contribute to a deeper understanding of the underlying mechanisms governing plant defense. Keywords: plant defense; calcium; modeling
Plants 2013, 2
751
1. Introduction Plants, as virtually all living organisms, are confronted with pathogens that try to get access to the resources of their hosts. Consequently, plants evolved sophisticated recognition systems in order to sense the pathogen attack and initiate defense mechanisms. From the host point of view, a fast and correct recognition of the pathogen attack is essential. Moreover, the signal transduction machinery of the host has to evaluate incoming signals and generate a decision for or against the onset of the defense mechanisms. This decision is of principle importance to the plant fitness, since plant defense reactions are costly [1]. On the other hand, no defense against a pathogen could be lethal. For this reason, plants evolved a signal transduction machinery that optimizes its defense reactions when confronted with pathogens. One strategy focuses on the recognition of compounds of pathogens (microbial elicitors) on the external face of the host cell [2]. The elicitors, described as pathogen associated molecular patterns (PAMPS), are recognized by pattern recognition receptors (PRRs), and their perception activates the defense machinery of the plant [3]. Parts of the initiation of the plant defense include, e.g., the activation of ion fluxes across the plant cell membrane, rapid changes in protein phosphorylation, production of reactive oxygen species (ROS), along with several more activities, which have been described more extensively in the literature [4,5]. ROS are toxic to the invading pathogen and contribute to the crosslinking of plant cell wall compounds, resulting in a reinforced barrier against infection. Prior to that, the release of calcium ions (Ca2+ ) from internal compartments is mediated, generating a spike of the cytosolic Ca2+ concentration [5–7]. These Ca2+ ions act as a second messenger and are involved in different interactions within the initiation of the plant defense. The cytosolic Ca2+ level is an essential part of the signal transduction network making the decision for or against defense. A common strategy to measure the cytosolic Ca2+ signatures is to use the Ca2+ -sensitive luminescent aequorin system [8]. The detected Ca2+ signals differ in lag period, amplitude and duration, depending on the type of elicitor [9]. Chitin fragments are among some well-known elicitors [10], and Ca2+ measurements using chitooligosaccharides as elicitors are already published, for instance, for parsley, tobacco and soybean cell suspension cultures [7,11,12]. In the course of these experiments, it was observed that a second elicitation with the same elicitor resulted in considerably reduced Ca2+ signals for soybean suspension cells [12]. In contrast to the experimental analysis of Ca2+ signals, only a few mathematical models for plant systems involving Ca2+ transporters are available. Simulations for action potential generation in vascular plant cells [13] and simulations of plant Ca2+ signatures, which are triggered by temperature decrease and the exchange of cytosolic and vacuolar pools [14] are exemplary models. This work focuses on the combination of experimental and mathematical work. For the experimental part, Nicotiana tabacum plant cell cultures were treated with penta-N-acetylchitopentaose oligosaccharides (Ch5) and the observed Ca2+ signatures were recorded. For the modeling part the minimal version of the De Young-Keizer model [15] for agonist-induced Ca2+ oscillations involving the IP3 Rkinetics, reduced by Li and Rinzel [16], was modified in order to achieve a system mimicking the situation in plants. Ca2+ simulations were generated based on the adapted Li and Rinzel model, and different features were analyzed in detail.
Plants 2013, 2
752
2. Materials and Methods 2.1. Measurement of Cytosolic Calcium Concentration in Tobacco Plant Cell Cultures Five milliliters of aequorin-expressing tobacco suspension cultures [17], cultivated in the dark, were, three to four days after subcultivation, incubated with 50 µL coelenterazine (1.2 mM in ethanol) on a rotary shaker (orbital rotation, 125 rpm) for 5 h in the dark. Afterwards, 200 µL of these cells were transferred to a cuvette in a single tube luminometer (Berthold Detection Systems, Pforzheim, Germany) and 10 µL of Ch5 of different concentrations in water were added to the sample. Ch5 was obtained from Seikagaku Corporation (Tokyo, Japan). For the refractory measurements, varying quantities of Ch5 concentrations were added to the sample at two different time points, whilst taking into account that the second elicitation had to be done after the first Ca2+ response had ended. All measurements were performed at room temperature, and the elicitor add-on to the sample was done after monitoring a base-line of luminescence. After each measurement, the residual aequorin was completely discharged by adding 200 µL of 1 M CaCl2 in 10% ethanol. This discharge was used for transforming the luminescent light units into the final Ca2+ concentration, based on the mathematical relationship between the ratio Li /Lmax and the final Ca2+ concentration, described in the model B of Allen et al. [18]. In this relationship, Li represents the light intensity at time point i, and the light intensity, Lmax , is determined by calculating Ltot − (L1 + L2 + . . . + Li ). Ltot covers the light intensity induced by the complete discharge at the end of the experiment. This formula also includes three constants, which were experimentally fitted by Brini et al. [19] (KR = 7.23 × 10⁶ M−1 , KT R = 120 and n = 2.99). The tobacco cell cultures used in our work were transformed with a cytoplasmic-targeting apoaequorin expression vector pMAQ2 (A-6793, in the past Molecular Probes). Therefore, the detection focuses on the cytoplasmic localization. The aequorin-system used in this study was already employed for a number of similar experiments [8,12,17]. Due to the size of the aequorin-protein, we cannot rule out that the protein can enter the plants’ nucleus, and part of the signal arises from this location. Recently, Mehlmer et al. [20] developed a set of aequorin expression plasmids for the generation of transgenic plant lines to measure calcium levels in different cellular subcompartments. To allow a direct comparison to the already published studies, the pMAQ2 vector-based transformants were used. 2.2. Model Description (Adaptation of the Li and Rinzel Model [16]) Cytosolic Ca2+ oscillations of pituitary gonadotrophs can be described and simulated by the Li and Rinzel model. Due to some similar characteristics of the Ca2+ transients in plants, we adapted this approach for further study. Generally, the two-variable model of Li and Rinzel reduces the nine-variable De Young-Keizer model [15] for agonist-induced Ca2+ oscillations, involving IP3 and Ca2+ in the activation process of the receptor channels in the ER. The activation with Ca2+ is defined as the calcium-induced calcium release (CICR). Additionally, a term for a Ca2+ inactivation process of the channels in the ER is included. In contrast to an animal system, the mechanisms of this described Ca2+ release are not yet affirmed for the situation in plants. The molecular identity of, e.g., IP3 -activated channels at the vacuolar and
Plants 2013, 2
753
endoplasmic reticulum membranes has not been described so far [21]. Different studies are available that support the existence of ligand-gated channels at these membranes [21–23], though. Additionally, there is evidence for the involvement of inositol phosphates in triggering the oxidative burst within the plant defense signal transduction chain [24]. Furthermore, there are published APT-driven Ca2+ pumps that refill the plant Ca2+ stores again [21]. In the following, the Li and Rinzel model will be described more precisely. First of all, it constitutes an analogy to the Hodgkin-Huxley equations for neuronal electrical excitability [25]. This analogy refers to a Ca2+ excitability of the ER membrane, which triggers cytosolic Ca2+ oscillations in response to agonist stimulation, shown, e.g., in pituitary gonadotrophs [26,27]. In the Li and Rinzel model, the cytosolic Ca2+ balance is defined by three different fluxes: a Ca2+ cytosol-inward flux through the IP3 receptor channels, an inward leak flux and an outward Ca2+ pump flux. The Ca2+ pump flux into the ER is defined by the Hill equation term: Jpump =
υer Ci2 2 + C2 ker i
The variable Ci (µM) represents the cytosolic Ca2+ concentration. In the Li and Rinzel model, the fraction of free Ca2+ ions in the cytosol and in the ER is involved with scaling the volumes of these compartments. As we could not distinguish between free and bound Ca2+ ions in our experiments, we skipped this scaling parameter in our model. For symbiotic Ca2+ oscillations, it could be shown by Granqvist et al. [28] that an increase in buffering capacity in the nucleoplasm would cause a variation in the oscillation patterns of plant root hair cells. However, for the Li and Rinzel model, buffering reduces the Ca2+ fluxes of the cytosol and the ER by several orders of magnitude [26]. Even if we took buffering into account, we would not see the same effects as described by Granqvist et al. [28]. The constant υer (µMs−1 ) defines the maximal Ca2+ uptake of the pump, and ker (µM) represents the activation constant for this pump. The leak current into the cytosol is defined by a permeability coefficient, pL (s−1 ), times the Ca2+ gradient across the membrane of the ER, with CER (µM) being the Ca2+ concentration of the ER: Jleak = c1 pL (CER − Ci ) The total Ca2+ concentration, C0 , in a cell is described as: C0 = Ci + c1 CER , with c1 being the ER/cytoplasm volume ratio. (The volume of the ER is regarded as a subvolume of the cytosolic volume.) The CER concentration is then expressed as CER = [C0 − Ci ]/c1 . Therefore the leak flux can be modified in the following way: Jleak = pL (C0 − (1 + c1 )Ci ) A last term describes the Ca2+ flux into the cytosol through the IP3 (representing any inositol phosphates in a plant cell as a second messenger) receptor channels situated in the membrane of the ER: Jchan = pIP3 O(IP3 , Ca2+ , h)(C0 − (1 + c1 )Ci )
Plants 2013, 2
754
The constant pIP3 (s−1 ) describes the maximal permeability of the membrane for the IP3 receptor channels, the variable, IP3 (µM), marks the IP3 concentration, and the expression O(IP3 ,Ca2+ ,h) represents the channel open probability at equilibrium with: O=(
Ci IP3 )3 ( )3 h3 IP3 + dip3 Ci + dact
This channel open probability has been fitted to experimental data, revealing that a power close to three is the best choice [15,29]. The two dissociation constants, dip3 (µM) for IP3 -binding and dact (µM) for Ca2+ -binding to the IP3 channel, are involved in this expression, as well as a dimensionless variable, h, describing channel inactivation. The whole differential equation for the cytosolic Ca2+ balance can be summarized by: d Ci = Jchan + Jleak − Jpump dt Additionally, the variable, h, for the gating process for inactivation of the IP3 channels is described by: d dinh h = a(Ci + dinh )( − h) dt Ci + dinh This second differential equation was also simplified by Li and Rinzel and represents the inactivation of the IP3 channels by Ca2+ , including the two parameters, a (s−1 ) and dinh (µM). The parameter, a, influences the corresponding time scale for the described process, and the parameter, dinh , defines the corresponding dissociation constant. Apart from the cytosolic Ca2+ balance equation and the added expression term for inactivation, the Li–Rinzel model considers a Ca2+ exchange between the cell and the extracellular medium. It is possible to define additional assumptions for the Ca2+ transporters at the plasma membrane. For our further analysis, a small and constant Ca2+ influx into the cell is sufficient. It is defined by the term, Jin (µMs−1 ), and in the following, we will include it in the cytosolic Ca2+ balance equation: d Ci = Jchan + Jleak − Jpump + Jin dt Setting Jin to zero corresponds to the situation of an isolated cell. 2.3. Summary of Model Modifications We have modified the original Li and Rinzel model to make it suitable for tobacco cells. The ER is confirmed as an inner Ca2+ store in the Li and Rinzel model. In plants, we regard the vacuole as the main inner Ca2+ store. The Ca2+ channels in the membrane of the vacuole are not well described. Although stimulation by IP3 is reported in vivo [30], IP3 , receptor genes in the Arabidopsis thaliana genome have not been found so far [31]. As the involvement of inositol phosphates is confirmed, an IPx variable was adopted. The adaptation of other parameters is listed in Table 1. As for the parameter values, we stuck to the animal data in the first place. When values had to be modified, we usually found suitable values for our plant system through optimization procedures. Setting the c1 constant to 0.1, we found that it not only improved our simulation results, it also resembles the corresponding vacuole/cytosol volume ratio
Plants 2013, 2
755
in plants [14]. Additionally, the IPx concentration was altered into a stimulus function, described more precisely in the following. The IPx concentration variable was modified in order to use it as a stimulus function related to the elicitation in the experiments. This theoretical stimulation is directly effective at the entrance of the inner Ca2+ store. The part of signal transduction between elicitor recognition and the activation of Ca2+ release in the plant system (Figure 1) still needs to be described. To overcome this “black box”, we have, firstly, chosen to define normalized values, between 0 and 1, for our simulated stimulus. Secondly, a transfer function had to be installed to convert the normalized values into the elicitor concentration (Ch5) values used in the experiments. We identified [0-1]-Ch5 value pairs corresponding to the identical cytosolic Ca2+ release, both in the simulations, as well as in the experiments. These value pairs were further used as reference points to build a transfer function converting the normalized [0-1] values of the theoretical stimulus into the Ch5 values of the elicitation applied in the experiments. The use of a normalized stimulus function has the advantage that it can be easily adapted to different elicitors as used in experiments. The signal’s way from the receptor of a plant cell to the entrance of the inner Ca2+ store can then be described by a transfer function being specific for this elicitor. For our elicitations with penta-N-acetylchitopentaose oligosaccharides (Ch5), the function y(x) = 8328.75(x − 0.06)3.57 (x represents a normalized value), being the result of a fitting process performed with MATLAB [32], served our purposes well (see Figure A1 in the Appendix). Figure 1. Minimal model for the generation of calcium transients in plant cells upon stimulation by pathogen-associated molecular patterns (PAMPs). Elicitor recognition triggers the influx of Ca2+ ions from outside the cell (illustrated as the transition from a closed to an open channel in the figure) and the production of inositol phosphates (IPx ) by phospholipase C activity, which are responsible for the release of Ca2+ ions from inner stores into the cytosol. The molecular identity of, e.g., IP3 -activated channels at the membranes of the inner compartments in plants has not been confirmed so far [21]. (Analogously, the Li and Rinzel model considers the activation of the cytosolic Ca2+ release via IP3 and Ca2+ . The activation process through Ca2+ is defined as calcium-induced calcium release (CICR).) This figure was made with CellDesigner [33].
Plants 2013, 2
756
2.4. Model Simulation Differential equations were solved with MATLAB [32] using the ode45 solver, based on an explicit Runge–Kutta formula. 3. Results and Discussion 3.1. Cytosolic Calcium Increase upon Elicitation by Penta-N-acetylchitopentaose Oligosaccharides Measured in Tobacco Plant Cell Cultures In order to directly compare elicitor-induced Ca2+ transients in tobacco cell cultures and the mathematical simulation of these experiments, the effect of penta-N-acetylchitopentaose oligosaccharides (Ch5) was first analyzed in vivo. Aequorin-transformed tobacco cell cultures were treated with selected elicitor concentrations in the range of 48 pM to 480 µM, and the Ca2+ transients were recorded (Figure 2). The maximum of every single Ch5-induced Ca2+ curve was reached in about one to 2 min after elicitation, depending on the elicitor concentration. The overall duration of the signal was about 7 min, while the delay time took about 50 s, independently of the elicitor concentration. The signal curve is asymmetric. The observed increase of the Ca2+ curve was always faster than the decrease, an important feature considered for the mathematical model. Related cytosolic Ca2+ elevations could be observed with transgenic soybean cells treated with chitotetraose oligosaccharides (Ch4). Fast responses, which peaked within 2–2.5 min, could be detected, and the monophasic behavior of the Ca2+ signal was monitored [12]. 3.2. Qualitative and Quantitative Simulations of Cytosolic Calcium Signals Induced by Penta-Nacetylchitopentaose Oligosaccharides It was intended to establish a mathematical model in order to simulate the Ca2+ signature measured in elicitor-treated cell cultures. Special emphasis was put on the simulation of the asymmetric shape of the “on”- versus “off”-kinetics. Additionally, the simulation should show the adequate intensity of the Ca2+ response, influenced by the corresponding stimulus activation. To this end, our modified version of the Li and Rinzel model underwent various simulations with different sets of parameters to find matching values that could reproduce a consistent simulation result for a Ch5-induced Ca2+ response in a plant system. In comparison to the parameter-set of the original Li and Rinzel model, the following parameters were observed to be most sensitive: the IP3 permeability (pIP3 ), the dissociation constant, dinh , and the time scale parameter, a, both involved in the Ca2+ inactivation of the channels, the dissociation constant, dact (Ca2+ activation of the channels), and the total Ca2+ concentration, C0 . C0 was calculated by CER = [C0 − Ci ]/c1 . The constant, c1 , is defined by the ER/cytosol volume ratio in the Li and Rinzel model. In order to achieve the appropriate store size in plants, we used the vacuole/cytosol volume ratio of 0.1 [14]. All utilized parameters are listed in Table 1.
Plants 2013, 2
757
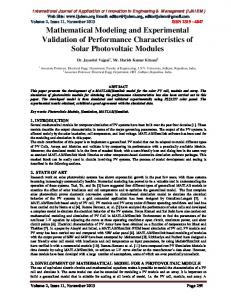
Figure 2. Measurement and quantification of cytosolic Ca2+ concentrations in tobacco cell cultures upon elicitation with N-acetylchitopentaose oligosaccharides. (A) Dose-dependent Ca2+ kinetics for the acetylchitopentaose oligosaccharides (Ch5) elicitor measured in tobacco plant cell cultures. The elicitor concentration was chosen in the range of 48 pM to 480 µM. Each cytosolic Ca2+ curve has a delay time of 50 s and a faster increase than decrease. Three replicates of every single concentration were taken. The cytosolic Ca2+ curves shown constitute the calculated mean of the three replicates. Error bars indicate standard deviation. (B) Dose-response diagram of the measured Ch5-induced Ca2+ transients. The maxima of cytosolic Ca2+ responses are recorded for each concentration. The resulting curve shows a clear rise; higher elicitor concentrations lead to stronger Ca2+ responses. Error bars indicate standard deviation.
The parameters, pIP3 and C0 , turned out to be essential for achieving a cytosolic Ca2+ concentration of 6 µM. Both parameters had to be increased to get appropriate Ca2+ responses in the plant system compared to the observed Ca2+ oscillations in pituitary gonadotrophs [16]. The modified parameters, a and dact , were important to trigger a single Ca2+ response, due to their influence on the channel kinetics of the IP3 receptor channels in the membrane of the ER in analogy to the gating processes in the membrane of an internal store in a plant cell. Their decrease slows down the two gating processes involved in the Ca2+ interaction. The parameter, dinh , played an important role regarding the refractory behavior of the measured Ca2+ transients and will be discussed later on. In summary, simulations using the parameters given in Table 1 resulted in a qualitative and quantitative output very comparable to the measurements in plant cell cultures. An exemplary simulation result for a Ch5 concentration of 480 µM (solid blue curve) is shown in Figure 3A. It is compared favorably to a single measured Ca2+ signature (dashed red curve). Both curves showed the typical asymmetric structure of the Ca2+ response, the simulation curve’s increase was a little bit stronger. Additionally, a second simulation result (solid green line), including the external influx of Ca2+ ions (defined as Jin ) is shown in this figure. In comparison to the simulation result without the Jin flux, the general behavior is not strongly influenced. In plant cells, the elicitor detection triggers a primary influx of Ca2+ ions from outside the cell. This can also be included in the model by introducing a dependency of the Jin flux. If Jin is then chosen as zero, the other Ca2+ fluxes will not be triggered. For further analysis, the dependency of Jin was not considered,
Plants 2013, 2
758
as the Ca2+ simulations with and without the Jin flux do not considerably differ. Figure 3B shows the IPx stimulus for the simulated activation of the Ca2+ release (see Figure 3A) with a time period of seven minutes. The length of the simulated Ca2+ response can be varied according to stimulus length (see Figure A2 in the Appendix). In addition, Figure 3C shows the inactivation process of the channels in the membrane of the internal store in the plant cell (in analogy to the IP3 - and Ca2+ -activated channels in the membrane of the ER). Table 1. List of parameters for the Li and Rinzel model (left), the adapted parameters for the Ca2+ simulations in a plant system induced by Ch5 (middle) and the used values for the simulations in arbitrary units (right). L-RParameter (Unit)
Adapted parameter
Value
υ1 → pIP3 (s−1 ) υ2 → pL (s−1 ) υ3 → υER (µMs−1 ) ker (µM) dip3 (µM) dact (µM) dinh (µM) a (s−1 ) IP3 (µM) C0 (µM) c1 Jin (µMs−1 ) Initial Ci (µM) Initial h
pIPx pL υstore kstore dipx dact dinh a IPx C0 c1 Jin ci0 h0
140 0.05 0.5 0.4 0.1 0.02 0.04 0.001 stimulus 7.5 0.1 0.1 2 0.1562
In the next step, the model’s dose-response behavior was tested to quantitatively adjust the simulation results. The stimulus used was a normalized function with values between zero and one. With the help of a transfer function (y(x) = 8328.75(x − 0.06)3.57 ), these values can be converted into the Ch5 concentration as used in the experiments. The maximal concentration of every single Ch5 stimulus is set in relation to the peak of the corresponding Ca2+ answer (Figure 4A, blue line). A theoretical curve similar to the experimental dose-response behavior (Figure 4A, red line) could be achieved. Figure 4B exemplarily shows three Ca2+ simulations treated with reduced stimulus activation. These reduced answers were among those used for the calculation of the dose-response curve given in Figure 4A.
Plants 2013, 2 Figure 3. Qualitative comparison of measured Ca2+ transients and simulations of Ca2+ transients with the adapted Li and Rinzel model. (A) Comparison of measured cytosolic Ca2+ concentration in tobacco plant cells treated with 480 µM of Ch5 (dashed red line) and simulation with modified values for adapted parameters (solid blue curve), as listed in Table 1 (without the Jin flux). A second simulation (solid green line) is shown under the same circumstances, additionally containing a constant influx, Jin , through the plasma membrane. (B) IPx stimulus used for the activation of the system. The value of one of the normalized input corresponds to a Ch5 concentration of 480 µM. (C) The inactivation process of the channels in the membrane of the internal store in the plant cell (in analogy to the IP3 - and Ca2+ -activated channels in the membrane of the ER in the Li and Rinzel model).
Figure 4. Quantitative comparison of measured Ca2+ transients and simulations of Ca2+ transients with the adapted Li and Rinzel model. (A) Comparison of experimental (red curve) and simulated (blue curve) dose-response relationship for the Ch5 elicitor. (B) Simulations of single Ca2+ curves in answer to treatment with reduced stimulus activation, in analogy to the reduced Ch5 concentrations as used in the experiments.
759
Plants 2013, 2
760
3.3. Analysis of Calcium Transients Induced by Penta-N-acetylchitopentaose Oligosaccharides at Two Different Consecutive Time Points Tobacco cell cultures were stimulated with different concentrations of Ch5 as described before. After about 7 min, the Ca2+ signal almost reached its initial value recorded before stimulation. At this time point, a second elicitation of the already stimulated cell cultures was applied. The second Ch5 concentration was constantly kept at 240 µM. The Ca2+ responses recorded in vivo showed the following behavior. In the case of two consecutive strong stimuli of 480 µM and 240 µM of Ch5, the second Ca2+ response was nearly completely suppressed, like already described in published experiments [12,34]. The tobacco cell cultures showed a refractory behavior, i.e., the system was unable to respond to the same stimulus until a certain time had elapsed. In the next experiments, the first Ch5 concentration was gradually reduced, while keeping the second Ch5 concentration constant at 240 µM. With the aid of this approach, it was possible to observe that the first Ca2+ response decreased, while the second Ca2+ response increased. A diagram of the corresponding dose-response relationship shows this in more detail (Figure 5B). Interestingly, the curves show a different behavior. The dose-response curve of the second elicitation shows a moderate decrease, while the dose-response curve covering the first elicitation shows the typical distinct rise. Figure 5. Measurement of cytosolic Ca2+ concentrations in tobacco cell cultures upon elicitation with chitopentaose oligosaccharides at two time points. (A) Tobacco cell cultures were elicited with 480 µM, 4.8 µM and 48 pM of Ch5. Approximately 7 min later, a second elicitation with a Ch5 stimulus of 240 µM was carried out. The Ca2+ transients induced by the first and second elicitation were recorded. Error bars indicate standard deviation. (B) Dose-response diagram of the first and second response of Ch5 treated Ca2+ signals, shown exemplarily in (A). The Ch5 concentration of the first elicitation was reduced (black curve), while the second Ch5 elicitation was constantly held at 240 µM (red curve). Ca2+ answers are always set in relation to the stimulus level of the first stimulation. Error bars indicate standard deviation.
Plants 2013, 2
761
Thereafter the analysis of Ca2+ simulations with a modified IPx stimulus was started. This IPx stimulus permitted activation of the system at two consecutive time points, in analogy to the experimental setup. This stimulus could be transferred into the corresponding Ch5 concentration of the experiments by using a transfer function, like mentioned before. With the help of a suitable parameter set, it was possible to simulate two consecutive Ch5-induced Ca2+ responses, with the second stimulus directly applied after the end of the first reaction (Figure 6B–F). Before a direct comparison between the experimental observations and the model simulations was possible, a detailed analysis of the Ca2+ simulations, in addition to the simulations for the inactivation process of the channels in the inner compartments of the plant cell, was necessary (Figure 6B,C). For this analysis, Ca2+ simulations with different values for the dinh parameter were performed (see Figure 6B). It turned out that the dinh parameter is very sensitive. Increasing its value provokes the second stimulated Ca2+ response, such that it is not suppressed anymore. The corresponding inactivation processes are shown in Figure 6C. With the help of the dinh parameter sensitivity, it was also possible to find an agreement of experimental and simulated Ca2+ signatures (Figure 6D–F). Figure 6D shows the comparison between the experimental and simulated Ca2+ response elicited at two time points with 480 µM and 240 µM. Furthermore, for the simulated Ca2+ signatures, the second signal is nearly completely suppressed. Figures 6E,F show the simulation results for the elicitation pairs 480 nM–240 µM (Figure 6E) and 480 pM–240 µM (Figure 6F) in comparison to the experimental data. For all simulations, the parameter set-up was chosen as listed in Table 1, except υ1 = 200 and Jin = 0. The parameter, dinh , was always set to 0.04. The aequorin-transformed tobacco suspension cultures reacted to the stimulation by N-acetylchitopentaose as already described for soybean cells [9,12]. In comparison to temperature-induced Ca2+ signals [14], a characteristic lag-phase of about 50 s was observed. Obviously, the measured Ca2+ signal is preceded by other signal transduction events, such as protein phosphorylation, other ion fluxes and probably by the activation of phospholipase C [4]. Since the precise structure of the plant signal transduction network triggered by pathogen derived elicitors is not known so far, a reduced model to simulate Ca2+ transients was established. This reduced model is based on the Li and Rinzel model for agonist-induced Ca2+ release in pituitary gonadotrophs [16]. An analogy between the cytosolic Ca2+ release from internal compartments in plant and animal cells was assumed. The Li and Rinzel model [16] considers a Ca2+ release of the ER via IP3 , thereby resulting in Ca2+ activation processes leading to cytosolic Ca2+ transients. In the plant cell, we mainly regard the vacuole as the inner Ca2+ compartment. The involvement of inositol phosphates, which are responsible for the cytosolic Ca2+ release after elicitor recognition, is confirmed [24]. Nevertheless, IP3 receptor genes in plants remain to be identified. A physiological role of IP3 , or even IP6 in guard cells, could be shown in vivo [31]. After the adaptation of the Li and Rinzel model [16], different simulation results were analyzed in detail. Ch5-induced Ca2+ simulations were achieved with modified values for the adopted parameters to make reasonable comparisons with the experiments possible. The simulated Ca2+ curve strongly resembled the experimental Ca2+ signature. The values for the identified parameter-set were not determined in vivo, and they are given in arbitrary units. It is a difficult task to identity ligand-gated channels in the vacuolar membrane of plants. A putative two-pore Ca2+ channel, TPC1, in the
Plants 2013, 2
762
vacuolar membrane of Arabidopsis thaliana has been postulated to be involved in abiotic or biotic stress responses, but it could not be affirmed [35]. Figure 6. Simulation of Ca2+ signatures with the adapted Li and Rinzel model and qualitative comparison to experimental Ca2+ signatures, focusing on the stimulation at two different time points. (A) Normalized IPx stimulus function for the activation of the simulations in Figure 6B–D. The first elicitation was set to one as a normalized value, and the second elicitation was set to 0.5, related to stimulations with 480 µM and 240 µM of Ch5, respectively. In Figure 6E,F, the stimulus strength was changed. In Figure 6E, the first elicitation was set to 0.11 (corresponding to 480 nM) and in Figure 6F, to 0.06 (480 pM), while the second elicitation remained constant at 0.5 (240 µM). (B) Three different Ca2+ simulations of the adapted Li and Rinzel model, activated by the same stimulus function as shown in Figure 6A. Only the parameter variation of dinh provoked different simulation results. The values of the other parameters were set as listed in Table 1, except υ1 = 200 and Jin = 0. (C) The corresponding inactivation processes for the Ca2+ simulations in Figure 6B are shown. The parameter set-up was the same as for the simulations in Figure 6B. The time interval of 2.5 h was chosen for a better illustration of process evolution. (D) + (E) + (F) Comparison of experimental (dashed red curve) and simulated (solid blue curve) Ca2+ signatures upon elicitation with two consecutive Ch5 stimuli (6D: 480 µM and 240 µM, 6E: 480 nM and 240 µM and 6F: 480 pM and 240 µM).
Thereafter, the analysis of quantitative simulation results in comparison to the experiments in vivo was started. With the normalized IPx stimulus function, the treatment of varying Ch5 concentrations in the experiments was reproduced, and a typical dose-response behavior could be shown. In the simulations, a transfer function converted the normalized values for the IPx stimulus into the Ch5 concentrations used in the experiments. The transfer function expresses the early events before cytosolic Ca2+ increase, covering elicitor recognition and the generation of inositol phosphates.
Plants 2013, 2
763
Further on, we focused on the refractory behavior of Ca2+ signals induced by repeated stimulation with Ch5. The repeated stimulation of the same cell culture resulted in significantly reduced Ca2+ transients in response to the second elicitation. To exclude the possibility of osmotic effects, the concentration of the first elicitation was gradually reduced. Most interestingly, the dose-response curves for the first and second elicitation did not sum up to the same value. In other words, a low first elicitation has an over proportional negative effect on the outcome of the second one. Since this outcome is specific for the particular elicitor, the inhibitory effect must target the receptor. A cooperative effect between the receptors or specific modifications of receptor clusters could be a possible explanation [36]. The refractory behavior was integrated into the model by the variable, h, describing the inactivation process of the channels in the membrane of the inner plant Ca2+ compartments. Reasonable simulation results were achieved for a parameter-set with a dinh parameter of 0.04. A general parameter sensitivity was identified for this parameter. It could be shown that there is a general dependency between the curve shape of h and the corresponding Ca2+ simulation. In the case of a flat curve shape, a second stimulation for the corresponding Ca2+ simulation was not possible. Only if h was allowed to increase, the second stimulation resulted in a second Ca2+ signal. In general, there are different model approaches for certain plant cell functions. Four major modeling tools to describe different processes in plant cells are exemplarily summarized by Liu et al. [37], including differential equations, Boolean networks, network inference and reconstruction and flux balance analysis. The adapted Li and Rinzel model is based on a differential equation approach for Ca2+ transporters, applied to plant cells. Other plant models based on differential equations, including Ca2+ transporters, were developed, e.g., for the generation of action potentials in vascular plants for the cytosolic pool [13], based on the plasmalemma electrical process model by Gradmann [38]. A further differential equation approach for Ca2+ signals, which are triggered by temperature decrease and the exchange of cytosolic and vacuolar pools, was established by Liu and coworkers [14]. They developed a compartment model for ion and growth dynamics in the tip and shank combined in a pollen tube [39]. The major four ion fluxes (Ca2+ , K+ , H+ and Cl− ) are part of the balance equations for the cytosolic and vacuolar pools. The description includes the calcium-induced calcium release (CICR) for the Ca2+ channels in the vacuolar membrane, a buffering component for Ca2+ and H+ ions within the cytosol and the influence of the temperature on the ATP/ADP ratio and the H+ concentration. The values of the parameters are unknown for the different simulations. Anyhow, it was possible to simulate all four ion fluxes and to compare experimental Ca2+ data with the Ca2+ simulations, based on only assumed parameters. Good results were achieved for a rapid temperature decrease. In summary it can be said that Ca2+ transients induced by mechanical stress [40], temperature or elicitors show some similarities with respect to their shape and absolute concentration of calcium in the cytoplasm. Nevertheless, we can assume that there are marked differences in the underlying signal transduction network, as indicated by the delayed Ca2+ transient that is characteristic for the elicitor perception. For this reason, it could be beneficial to establish different modeling approaches, based on differential equations, as well as other modeling tools, to compare their application to different scenarios. Within this work, a successful adaptation of the Li and Rinzel model to elicitor-induced Ca2+ was carried out. The adapted parameter-set could reproduce Ca2+ simulations, especially focusing on the curve’s shape, dose-response behavior and the activation with two consecutive stimuli.
Plants 2013, 2
764
4. Future Perspectives and Conclusions Pharmacological studies in plant cell cultures have shown that the Ca2+ transients are an essential part of the signal transduction network, allowing the plant to adapt to different environmental situations [41]. Here, the emphasis is set on the network. Other signals have to be transmitted and processed in parallel in order to trigger the specific reaction of the cell [7]. Further studies will clarify the network topology and relations between the network nodes. A still difficult task is to figure out how the dynamics of a calcium transient is transmitted into further signals. Upon the identification and quantitative characterization of further parts of the signal transduction network, more complete models can be established. For the modeling part, the identification of functional modules within the network topology will be of interest, e.g., to find out, whether calcium ions are a hub in the signal transduction machinery of plant defense. Universal functional modules that are not restricted to the description of a specific organism might help to identify general rules. Instead of focusing on specific models based on individual parameters, “scale-free” network models that display general characteristics of information processing systems [42] are an interesting alternative. Acknowledgments We thank Mohamed Amine El Ymlahi for assistance in the lab and all persons of the working group, Proteome and Metabolome Research, for helpful discussion. The research was founded by the Bielefeld University and was part of the Graduate School “Bioinformatics of Signaling Networks”. Conflicts of Interest The authors declare no conflict of interest. References 1. Meldau, S.; Ullman-Zeunert, L.; Govind, G.; Bartram, S.; Baldwin, I.T. MAPK-dependent JA and SA signalling in Nicotiana attenuata affects plant growth and fitness during competition with conspecifics. BMC Plant Biol. 2012, 12, doi:10.1186/1471-2229-12-213. 2. Dodds, P.N.; Rathjen, J.P. Plant immunity: Towards an integrated view of plant-pathogen interactions. Nat. Rev. Genet. 2010, 11, 539–548. 3. Boller, T.; Felix, G. A renaissance of elicitors: Perception of microbe-associated molecular patterns and danger signals by pattern-recognition receptors. Annu. Rev. Plant Biol. 2009, 60, 379–406. 4. Garcia-Brugger, A.; Lamotte, O.; Vandelle, E.; Bourque, S.; Lecourieux, D.; Poinssot, B.; Wendehenne, D.; Pugin, A. Early signaling events induced by elicitors of plant defenses. Mol. Plant Microbe Interact. 2006, 19, 711–724. 5. Yang, Y.; Shah, J.; Klessig, D.F. Signal perception and transduction in plant defense responses. Genes Dev. 1997, 11, 1621–1639. 6. Ma, Y.; Walker, R.K.; Zhao, Y.; Berkowitz, G.A. Linking ligand perception by PEPR pattern recognition receptors to cytosolic Ca2+ elevation and downstream immune signaling in plants. Proc. Natl. Acad. Sci. USA 2012, 109, 19852–19857.
Plants 2013, 2
765
7. Lecourieux, D.; Ranjeva, R.; Pugin, A. Calcium in plant defence-signalling pathways. New Phytol. 2006, 171, 249–269. 8. Knight, M.R.; Campbell, A.K.; Smith, S.M.; Trewavas, A.J. Transgenic plant aequorin reports the effects of touch and cold-shock and elicitors on cytoplasmic calcium. Nature 1991, 352, 524–526. 9. Aslam, S.N.; Erbs, G.; Morrissey, K.L.; Newman, M.A.; Chinchilla, D.; Boller, T.; Molinaro, A.; Jackson, R.W.; Cooper, R.M. Microbe-associated molecular pattern (MAMP) signatures, synergy, size and charge: Influences on perception or mobility and host defence responses. Mol. Plant Pathol. 2009, 10, 375–387. 10. Shibuya, N.; Minami, E. Oligosaccharide signalling for defence responses in plant. Physiol. Mol. Plant Pathol. 2001, 59, 223–233. 11. Blume, B.; N¨urnberger, T.; Nass, N.; Scheel, D. Receptor-mediated increase in cytoplasmic free calcium required for activation of pathogen defense in parsley. Plant Cell Online 2000, 12, 1425–1440. 12. Mith¨ofer, A.; Ebel, J.; Bhagwat, A.A.; Boller, T.; Neuhaus-Url, G. Transgenic aequorin monitors cytosolic calcium transients in soybean cells challenged with beta-glucan or chitin elicitors. Planta 1999, 207, 566–574. 13. Sukhov, V.; Vodeneev, V. A mathematical model of action potential in cells of vascular plants. J. Membrane Biol. 2009, 232, 59–67. 14. Liu, J.; Knight, H.; Hurst, C.H.; Knight, M.R. Modelling and experimental analysis of the role of interacting cytosolic and vacuolar pools in shaping low temperature calcium signatures in plant cells. Mol. BioSyst. 2012, 8, 2205–2220. 15. Young, G.W.D.; Keizer, J. A single-pool inositol 1,4,5-trisphosphate-receptor-based model for agonist-stimulated oscillations in Ca2+ concentration. Proc. Natl. Acad. Sci. USA 1992, 89, 9895–9899. 16. Li, Y.X.; Rinzel, J. Equations for InsP3 receptor-mediated [Ca2+ ]i oscillations derived from a detailed kinetic model: A hodgkin-huxley like formalism. J. Theor. Biol. 1994, 166, 461–473. 17. Meyer, A.; P¨uhler, A.; Niehaus, K. The lipopolysaccharides of the phytopathogen Xanthomonas campestris pv. campestris induce an oxidative burst reaction in cell cultures of Nicotiana tabacum. Planta 2001, 213, 214–222. 18. Allen, D.; Blinks.; Prendergast, F. Aequorin luminescence: Relation of light emission to calcium concentration—A calcium-independent component. Science 1977, 195, 996–998. 19. Brini, M.; Marsault, R.; Bastianutto, C.; Alvarez, J.; Pozzan, T.; Rizzuto, R. Transfected aequorin in the measurement of cytosolic Ca2+ concentration ([Ca2+ ]c): A critical evaluation. J. Biol. Chem. 1995, 270, 9896–9903. 20. Mehlmer, N.; Parvin, N.; Hurst, C.H.; Knight, M.R.; Teige, M.; Vothknecht, U.C. A toolset of aequorin expression vectors for in planta studies of subcellular calcium concentrations in Arabidopsis thaliana. J. Exp. Bot. 2012, 63, 1751–1761. 21. Kudla, J.; Batistiˇc, O.; Hashimoto, K. Calcium signals: The lead currency of plant information processing. Plant Cell 2010, 22, 541–563.
Plants 2013, 2
766
22. Martinec, J.; Feltl, T.; Scanlon, C.H.; Lumsden, P.J.; Mach´acˇ kov´a, I. Subcellular localization of a high affinity binding site Ford-Myo-Inositol 1,4,5-Trisphosphate from chenopodium rubrum. Plant Physiol. 2000, 124, 475–483. 23. Lommel, C.; Felle, H.H. Transport of Ca2+ across the tonoplast of intact vacuoles from Chenopodium album L. suspension cells: ATP-dependent import and inositol-1,4,5-trisphosphateinduced release. Planta 1997, 201, 477–486. 24. Gonorazky, G.; Laxalt, A.M.; de la Canal, L. Involvement of phospholipase C in the responses triggered by extracellular phosphatidylinositol 4-phosphate. J. Plant Physiol. 2010, 167, 411–415. 25. Hodgkin, A.L.; Huxley, A.F. The components of membrane conductance in the giant axon of Loligo. J. Physiol. 1952, 116, 473–496. 26. Li, Y.X.; Keizer, J.; Stojilkovic, S.S.; Rinzel, J. Ca2+ excitability of the ER membrane: An explanation for IP3-Induced Ca2+ oscillations. Am. J. Physiol. Cell Physiol. 1995, 269, C1079–C1092. 27. Li, Y.X.; Rinzel, J.; Keizer, J.; Stojilkovi´c, S.S. Calcium oscillations in pituitary gonadotrophs: Comparison of experiment and theory. Proc. Natl. Acad. Sci. USA 1994, 91, 58–62. 28. Granqvist, E.; Wysham, D.; Hazledine, S.; Kozlowski, W.; Sun, J.; Charpentier, M.; Martins, T.V.; Haleux, P.; Tsaneva-Atanasova, K.; Downie, J.A.; et al. Buffering capacity explains signal variation in symbiotic calcium oscillations. Plant Physiol. 2012, 160, 2300–2310. 29. Watras, J.; Bezprozvanny, I.; Ehrlich, B.E. Inositol 1,4,5-trisphosphate-gated channels in cerebellum: Presence of multiple conductance states. J. Neurosci. 1991, 11, 3239–3245. 30. Peiter, E. The plant vacuole: Emitter and receiver of calcium signals. Cell Calcium 2011, 50, 120–128. 31. Krinke, O.; Novotn´a, Z.; Valentov´a, O.; Martinec, J. Inositol trisphosphate receptor in higher plants: Is it real? J. Exp. Bot. 2007, 58, 361–376. 32. MATLAB version 7.9.0.529 (R2009b); The MathWorks Inc.: Natick, MA, USA, 2009. 33. Kitano, H.; Funahashi, A.; Matsuoka, Y.; Oda, K. Using process diagrams for the graphical representation of biological networks. Nat. Biotechnol. 2005, 23, 961–966. 34. Price, A.H.; Taylor, A.; Ripley, S.J.; Griffiths, A.; Trewavas, A.J.; Knight, M.R. Oxidative signals in tobacco increase cytosolic calcium. Plant Cell Online 1994, 6, 1301–1310. 35. Ranf, S.; W¨unnenberg, P.; Lee, J.; Becker, D.; Dunkel, M.; Hedrich, R.; Scheel, D.; Dietrich, P. Loss of the vacuolar cation channel, AtTPC1, does not impair Ca2+ signals induced by abiotic and biotic stresses. Plant J. 2008, 53, 287–299. 36. Bray, D.; Levin, M.D.; Morton-Firth, C.J. Receptor clustering as a cellular mechanism to control sensitivity. Nature 1998, 393, 85–88. 37. Liu, J.; Grieson, C.S.; Webb, A.A.; Hussey, P.J. Modelling dynamic plant cells. Curr. Opin. Plant Biol. 2010, 13, 744–749. 38. Gradmann, D. Impact of apoplast volume on ionic relations in plant cells. J. Membr. Biol. 2001, 184, 61–69. 39. Liu, J.; Piette, B.M.A.G.; Deeks, M.J.; Franklin-Tong, V.E.; Hussey, P.J. A compartmental model analysis of integrative and self-regulatory ion dynamics in pollen tube growth. PLoS One 2010, 5, e13157.
Plants 2013, 2
767
40. Trewavas, A.; Knight, M. Mechanical signalling, calcium and plant form. Plant Mol. Biol. 1994, 26, 1329–1341. 41. Cessna, S.G.; Low, P.S. Activation of the oxidative burst in aequorin-transformed Nicotiana tabacum cells is mediated by protein kinase- and anion channel-dependent release of Ca2+ from internal stores. Planta 2001, 214, 126–134. 42. Barab´asi, A.L. Scale-free networks: A decade and beyond. Science 2009, 325, 412–413. Appendix Figure A1. Transfer function that converts normalized values into Ch5 values.
This transfer function was used to convert the normalized values (x) of the theoretical stimulus function into the elicitor concentration (Ch5) values (y) used in the experiments.
Plants 2013, 2
768
Figure A2. Comparison of simulated Ca2+ transients with the adapted Li and Rinzel model.
Shown are two Ca2+ transients, simulated under the same conditions, only stimulus length has been varied. The blue curve shows the reaction to a stimulus being 10 min longer as the input stimulus for the green curve.
© 2013 by the authors; licensee MDPI, Basel, Switzerland. This article is an open access article distributed under the terms and conditions of the Creative Commons Attribution license (http://creativecommons.org/licenses/by/3.0/).