2010 Eighth ACIS International Conference on Software Engineering Research, Management and Applications
Experimental Study Using Functional Size Measurement in Building Estimation Models for Software Project Size Nelly Condori-Fernandez
Maya Daneva
Universitad Politecnica de Valencia Valencia, Spain
[email protected]
University of Twente Enschede, The netherlands
[email protected]
Luigi Buglione
Olga Ormanjieva
ETS/Engineering.IT. Rome, Italy
[email protected]
Concordia University Montreal, Canada
[email protected]
variables on which the effort estimation depends, we will be able to eventually reduce the gap between estimated effort and actual effort.
Abstract — This paper reports on an experiment that investigates the predictability of software project size from software product size. The predictability research problem is analyzed at the stage of early requirements by accounting the size of functional requirements as well as the size of non-functional requirements. The experiment was carried out with 55 graduate students in Computer Science from Concordia University in Canada. In the experiment, a functional size measure and a project size measure were used in building estimation models for sets of web application development projects. The results show that project size is predictable from product size. Further replications of the experiment are, however, planed to obtain more results to confirm or disconfirm our claim.
We have identified the functional size, the main variable in effort estimation formulas, as one of the possible factors contributing the above gap. Functional size measurement (FSM) methods [1] have been proposed as solutions to this problem. However, using a FSM method in the early requirements stage of a project poses a number of risks. First, contemporary ISO-standardized FSM approaches, as [2,3,4] take as inputs the functional requirements only and translate them into a (product) functional size. This, more often than not, leads to a larger Magnitude of Relative Error (MRE) in the early phases; that is, to the ‘cone of uncertainty’ phenomenon [11] where the earlier the estimation, the larger the MRE as compared to the final results. Second, the exclusion of the nonfunctional requirements (NFR), such as reliability and security, from the sizing process also contributes to the ‘cone of uncertainty‘ phenomenon; indeed, in non-MIS projects, implementing the NFRs on a project can represent up to 50% of the overall project effort [6]. Third, the current effort estimation techniques use the product functional size of software and not the size of a software project as an independent variable [7]. Because the goal of the project manager is to take care of the whole project boundary, as per prominent Scope Management approaches [8], it makes good sense to evaluate a complementary view on the way a project can be sized. In this paper, we make a fist step developing a deeper understanding of the possible relationship which might exist between software project size and software product size. An important unique aspect of this research is that the notion of product size, which we use, includes both functional and nonfunctional requirements. Furthermore, we apply the guidelines proposed by Wohlin [9] to design an experimental study. As research methodologists in SE suggest [18], analyzing the results of experiments involves learning and encapsulation of
Keywords: functional size measurement; experiment; empirical software engineering; software project estimation
I. INTRODUCTION Project effort estimation at the stage of early requirements has been recognized as one of the most challenging processes in software engineering (SE). This challenge may aggravate in the context of software product development, as the commitment of product managers (and, ultimately, the product market success) depends on the project managers’ ability to provide accurate estimates. While the IT industry has developed numerous effort estimation methods, it is a wellknown fact that a huge gap exists between the initial effort estimation and the actual effort which has been required in reality for software projects. Moreover, to the best of our knowledge, almost no research has been done in the area of exploring the relationship which might exist between software product attributes and software project attributes at the requirements stage. The lack of knowledge about this relationship motivated the research that we present in the present paper. We make a step towards understanding the possible links between software product and project attributes. We think that if we increase our knowledge of the project 978-0-7695-4075-7/10 $26.00 © 2010 IEEE DOI 10.1109/SERA.2010.42 10.1109/SERA.2010.32
298 276
knowledge, which in turn increases the researchers’ ability to change and refine their solution proposals over time. In this paper, we report on an experiment which we performed, aiming at developing a solution to the above three issues.
counting is based on the WBS project tasks by three types: management (M), quality (Q) and technical (T) tasks. The Ttasks refer to the primary processes, while the M/Q-tasks refer to the organizational and support processes. Each task is characterized by its complexity, which is measured by the effort that this task requires. The greater the effort required for a task, without any control/milestone in the middle, the more complex and consequently, the riskier it is. ‘Riskier’ means that there is a higher probability to request a re-plan during the project lifetime. So, the tactic during the drafting for a WBS is to refine it at the right level trying to minimize high-complexity tasks as much as possible and balancing the distribution of the forecasted effort against the several possible views (for example, by Software Life Cycle phase; by effort type; by task type, etc.). The PSU formula can be summarized as follows:
The rest of the paper is organized as follows. Section II provides background on the concepts used and formulates our research hypotheses. Section III presents the plan and the execution of the experiment. Section IV reports on validity threats. Section V concludes the paper. II.
BACKGROUND ON PROJECT SIZE AND PRODUCT SIZE
The research in this paper draws on previously published results by other authors who suggest that if we allow for an early and project-tuned prediction of the product size, this could reduce the effect of the ‘cone of uncertainty’[20][21]. Below, we describe the concepts of project size and product size and discuss possible relationships between these concepts.
PSU =
∑ ∑
taski * weight j
(1)
i = M ,Q ,T j = H ,M , L
where the weights’ ranges can vary according to the organizational style and definition for creating projects’ WBS and can be easily derived by regularly applying the Pareto Analysis on the PHD. For detailed procedures, we refer interested readers to the PSU Measurement Manual [15]. By taking care of two main groups of requirements: functional user requirements (FURs) and NFRs, it is also possible to derive the final number of PSU as the sum of the PSUFUR (calculated from the tasks derived by FURs) and PSUNFR (calculated from the tasks derived by NFRs). A recent case study using 33 projects that were also sized with IFPUG FPA v4.2 and COSMIC v2.2 [16] showed a good PSU prediction capability using a standard weighting system. The periodical update of the weights (see formula (1)) results in obtaining a better fit for newer estimates, moving away from the way estimators within the organization previously obtained results and further reducing episodes of the ‘cone of uncertainty’ as described above. Again, since the input for calculating PSU are the tasks composing the project WBS, it is possible, as opposed to the FSM method, to automate its calculation within any project management software tool that also helps elicitation and refinement of FUR [14]. For example, a first implementation under an Open Source Software (OSS) was done with GanttProject (www.ganttproject.org) v2.0.3 [13]. We make the note that plenty of project data and attributes stored within the software project management tool can be managed with an export utility in XML/CVS format in order to facilitate the creation and maintenance of the organizational PHD, moving progressively from experience/analogy-based estimates towards regression analysis-based ones.
A. Project Size Systematic reviews [Jor] on the topic of software estimation indicate that expert judgment is still the dominant estimation technique in practice today for software project size and effort. Estimation experts are often supported by means of checklists and group discussions. Recently, attempts were made to complement expert judgments with point-based techniques, for example, the Project Size Unit [15], to add up to a more objective project estimation process. In this paper, we use the PSU model as the approach to project sizing. From a project management viewpoint, it means considering the total sum of activities included in a work breakdown structure (WBS), trying to estimate the total amount of effort from the requirements in an early stage. As Figure 1 shows, the goal of the PSU design was to define a new measure at the project level for approximating overall “project size” in the early stages. We make the note that “Project Size” is a term not yet defined in the ISO/IEEE/PMI glossaries [8, 17, 19]. A proposal, according to the above premise, is to define it as “the size of a software project, derived by quantifying the (implicit/explicit) user requirements referable to the scope of the project itself” [7].
Figure 1. STAR Taxonomy: measurable entities
B. Product Size In this research, we exploit sizing procedures which include both FURs and NFRs. Specifically, the sizing methods we use in this experiment are COSMIC [2] and the newly proposed COSMIC-extension, the so-called COSMIC-NFSM [12], which includes the NFRs on a project.
Unlike a FSM method, PSU needs an experiential/analogous estimate to produce a more refined estimate, compared with the ‘organizational memory’, that is the organization’s project historical database (PHD). The PSU-
In COSMIC, the unit of measurement is the data movement, which is a base functional component that moves one or more data attributes belonging to a single data group. It is denoted by the symbol CFP (Cosmic Function Point). Data
277 299
movements can be of four types: Entry, Exit, Read or Write. The functional process is an elementary component of a set of user requirements triggered by one or more triggering events, either directly or indirectly, via an actor. The COSMIC is applicable to NFRs decomposable into operationalizations which provide both design solutions for achieving the NFR goals and the basis for defining their indicators [12].
method based on the ISO 19761 standard with the purpose of evaluating its ability to predict software project size; from the viewpoint of the researcher in the context of SE undergraduate students in their third year of studies enrolled in the 2008 and 2009 “Software Measurement” and “Software Project” undergraduate SOEN courses at Concordia University, Montreal, Canada. The experiment addresses the following two research questions (RQ):
C. Predicting Project Size using CFP Prediction determines the likely future values of product measures based on existing measures of the same product. For the purpose of early size prediction we need to define a relationship between product size CFP and project size PSU by requirements type, that is, FUR and NFR.
RQ1: In what extent does the product non-functional size determine the project size? RQ2: In what extent does the product functional size determine the project size? A. Selection of subjects The selected subjects were 55 third-year Computer Science students enrolled in both 2008 and 2009 SOEN337 “Software Measurement” and SOEN390 “Software Project” undergraduate courses at Concordia University, Montreal, Canada). Prior to these courses, students have taken several courses on SE subjects. The experiment was organised as mandatory part of the SOEN337 “Software Measurement” course. The subjects received lectures on the COSMIC method, including its application to NFRs (according to the measurement procedure presented in [12]). The duration of the students training prior to the experiment was 8 hours. The teaching process of the both courses included group work by students. This meant that student groups were responsible for carrying out a group project and executing life cycle activities ranging from project planning, specification, analysis and design. The students were organized in eleven groups, each of which included 5 students.
The hypotheses formulated from our research question are the following: Hypothesis 1. In relation to functional requirements: Null hypothesis, H10. Project Functional Size cannot be estimated from Product Functional Size. Alternative hypothesis, H11. Project Functional Size can be estimated from Product Functional Size. Hypothesis 2: In relation to non-functional requirements: Null hypothesis, H20. Project Non-Functional Size cannot be estimated from Product Non-Functional Size. Alternative hypothesis, H21. Project Non-Functional Size can be estimated from Product Non-Functional Size. We think, that knowledge on these relationships will allow for: (1) reducing the size measurement effort at this early stage; and (2) improving the accuracy of size prediction of all NFR, including those which are not (yet) stated in measurable terms. As stated in section 2.1, PSU respects the additive property, thus the following equation is valid theoretically from the representational-theory-of-measurement point of view: PSU=PSUFUR + PSUNFR hence the scale type of the PSU is at least interval (see [6] for more details on scale types and their characteristics). On the other side, the addition of the CFP size values (CFP=CFPFUR + CFPNFR) is also theoretically valid because COSMIC size has a unique unit of measurement, the CFP. Thus the COSMIC size measure is at least on the ratio scale. Consequently, the admissible transformation between the size units CFP and PSU is of type PSU=k*CFP+b (k>0), which justify the following relations:
PSU
FUR
= weight FUR _ Size * CFPFUR _ Size + bFUR _ Size
B. Identification of variables As research methodologists recommend [5,9], planning an experiment include the identification of (i) response variables (outcomes of the experiment as per Wohlin [9]), (ii) factors which might impact the response variables, and (iii) parameters, which we do not want to influence the experiment’s results. Project size and product size were identified as response variables. As these outcomes should be measurable, project size and product size were expressed in PSU and CFP units respectively. Furthermore, two variables were identified as factors that could affect the response variables. These are: first, the chosen project size measurement method, namely PSU; and second, the product size measurement method. With respect to the latter, two treatments were considered: the COSMIC method [2] and the COSMIC-NFSM method [12]. Last, three variables were identified as parameters: (i) application domain: our study is carried out in the web-application domain only, (ii) experience using size measurement methods, and (iii) quality of requirements specification.
(2)
PSU NFR = weight NFR _ Size * CFPNFR _ Size + bNFR _ Size (3) Theoretically, equations (2) and (3) mean that if we can run a regression analysis process, then we should be able to identify the relationships between the CFPFUR, PSUFUR and weightFUR_Size as well as between CFPNFR, PSUNFR and weightNFR_Size . III.
C. Instrumentation The instruments used in this experiment included the training materials and the experimental object. The training materials were the following: a set of instructional slides on COSMIC [2], COSMIC-NFSM [12], COSMIC case studies,
THE EXPERIMENTAL STUDY
The goal of our study, according to the goal-driven approach [10][22], is to analyze the software size measurement
278 300
and the COSMIC manual [2]. The experimental object was the Use-Case Model document that described in natural language the structure of an online exam management system. Each group worked on a subsystem of this system. The exam management application is meant to be used by instructors, students, coordinators, exam-markers, and administrators. Among other services, this software application allows (i) instructors to manage the question pool, the grades, and conduct exams, (ii) students to write real and practice exams, view marks, and register for an exam, (iii) markers to grade specific sections of an exam, and (iv) administrators to manage courses and user accounts.
allocated for this assignment, the students mostly worked the last night before the due date. TABLE I.
D. Experimental procedure The experiment was initiated by training the subjects in both the COSMIC and the COSMIC-NFSM methods. The time used for training was 8 hours (4 lecture hours and 4 hours of tutorials) distributed over 4 days. After the training process, each group was given the same problem statement describing the respective subsystem of the online exam management system. The experimental procedure is presented in Fig 2. It says that eleven student groups used both the COSMIC CFP and COSMIC NFSM to size the functional and non-functional requirements in their projects.
Group 1
Group2
Group 3
Documentation
Groups 2008
PSUNFR
CFPNFR
PSUFUR
CFPFUR
Total PSU
Total CFP
A
60
5
53
75
113
80
B
43
3
99
220
142
223
C
29
5
85
204
114
209
D
25
9
162
168
187
177
E Groups 2009
56
5
115
152
171
157
F
250
27
133
133
383
160
G
63
3
103
115
166
118
H
55
26
69
109
124
135
I
70
11
70
103
140
114
J
44
3
43
139
87
142
K
108
8
127
147
235
155
The software requirements and the WBSs have been provided to an expert, namely the third author of this paper, who calculated the PSUFUR and PSUNFR values for each group (See Table I.). We must note that the expert and the students worked independently, without any communication between each other. The expert did not know the students. The students were unaware of the work of the expert.
Group 11
IV.
Measurement
DATA SAMPLE
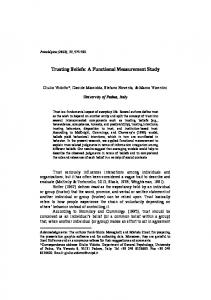
To answer our research questions, hypotheses H1 and H2 were formally tested by using the linear regression analysis. The data used for the regression analysis is presented in Table I. With respect to the project size estimation, based on nonfunctional size our results are shown in Table II and Table III. The data is plotted in Figure 3.
Applying CFP and NFSM , Requirement Design and Analysis Applying PSU
Work-Breakdown Structure
SUMMARY OF THE STUDENT PROJECT DATA
The coefficient of determination (R2) indicates that the 41% of the variation in the project non functional size (PSUNFR) can be explained by the variation in the non functional size of the product (CFPNFR).
Expert
TABLE II. Figure 2. Illustration of the experimental procedure
As is shown in Fig 2, a WBS project and software requirements documentation were created by each group. In the initial planning activity step the students were asked to estimate the effort for each task entry in their WBS charts and, later, to record the corresponding actual effort. The documentation was written iteratively in the Software Project course (SOEN390) as part of the 6-milestones' deliverables of the students.
REGRESSION ANALYSIS MODEL: CFPNFR AND PSUNFR
R
R2
0.64
0.415
TABLE III.
Each group of students also used both the COSMIC-CFP and COSMIC-NFSM methods to size the FR and the NFRs in their respective projects (See Table I.). The measurement was performed as an assignment in the Software Measurement class (SOEN337). We make the note that although two weeks were
Constant CFPNFR
279 301
Std. Error of the Estimate
0.033
50.64
REGRESSION ANALYSIS: COEFFICIENTS.
Unstandard. Coefficients Std. Error B 29.04 23.16 4.6
Significance
1.824
Standard Coeff. Beta 0.644
t
Sig.
1.25
0.24
2.52
0.03
TABLE V. PSU non functional
300 250
R2
R
200
0.712
150 100
Std. Error of the Estimate
0.507
Significance
30.42
0.031
Therefore, we can conclude that the 50.7% of the variation in the project functional size (PSUFUR) can be explained by the variation in the functional size of the product (CFPFUR).
50 0 0
5
10
15
20
25
30
CFP non functional
TABLE VI.
Figure 3. Possible relationship between CFPnf and PSUnf
As the level of significance of the linear regression analysis is medium (p