Explicit Use of Term Occurrence Probabilities for Term Weighting in ..... weighting scheme having linear contour lines for text categorization. 0. 0.1. 0.2. 0.3. 0.4.
JOURNAL OF INFORMATION SCIENCE AND ENGINEERING 27, 819-834 (2011)
Explicit Use of Term Occurrence Probabilities for Term Weighting in Text Categorization* ZAFER ERENEL, HAKAN ALTINÇAY AND EKREM VAROĞLU Department of Computer Engineering Eastern Mediterranean University Famagusta, Northern Cyprus via Mersin 10, Turkey E-mail: {zafer.erenel; hakan.altincay; ekrem.varoglu}@emu.edu.tr In this paper, the behaviors of leading symmetric and asymmetric term weighting schemes are analyzed in the context of text categorization. This analysis includes their weighting patterns in the two dimensional term occurrence probability space and the dynamic ranges of the generated weights. Additionally, one of the newly proposed term selection schemes, multi-class odds ratio, is considered as a potential symmetric weighting scheme. Based on the findings of this study, a novel symmetric weighting scheme derived as a function of term occurrence probabilities is proposed. The experiments conducted on Reuters-21578 ModApte Top10, WebKB, 7-Sectors and CSTR2009 datasets indicate that the proposed scheme outperforms other leading schemes in terms of macro-averaged and micro-averaged F1 scores. Keywords: text categorization, supervised term weighting, symmetric schemes, term occurrence probabilities, support vector machines
1. INTRODUCTION Most of the existing information entities on the web are electronic news sources, emails and web pages which are in the form of natural language documents. Automatic text categorization aims to group these documents into a set of predefined categories and thus eliminate the large amount of human resources that is allocated for this purpose in various domains. E-mail spam filtering, categorization of newspaper articles into topics, organization of web pages into categories and illicit web content classification are some application areas of text categorization. In general, documents may belong to multiple categories. A common approach to deal with multi-label text categorization is to transform the problem into several binary classification problems and solve them independently. Neural networks, naive Bayes, and k-nearest neighbor classifiers are widely used in text categorization [1-3]. Nevertheless, the robustness of SVM in very high dimensional feature space sets it as the strongest classifier for text categorization since documents are generally represented as feature vectors consisting of thousands of entries [4, 5]. In order to improve the performance of SVM-based text categorization systems, feature weighting is extensively studied since it is well known that features having larger weights contribute more to the overall decision. Existing feature selection schemes and their Received December 10, 2009; revised March 1, 2010; accepted March 23, 2010. Communicated by Chin-Teng Lin. * The numerical calculations reported in this paper were partly performed at TUBITAK ULAKBIM, High Performance and Grid Computing Center (TR-Grid e-Infrastructure). This work was supported by the research grant MEKB-09-02 provided by the Ministry of Education and Culture of Northern Cyprus and the preliminary version of it was presented in the 2009 International Conference on Soft Computing, Computing with Words and Perceptions in System Analysis, Decision and Control.
819
820
ZAFER ERENEL, HAKAN ALTINÇAY AND EKREM VAROĞLU
modified forms are also used for this purpose [6-8]. These attempts generally aim to analyze and quantify the relative importance of different terms for text categorization. These so-called term weighting schemes can be grouped as supervised and unsupervised where supervised schemes utilize the distribution of terms in different categories whereas the latter does not [8]. Supervised weighting schemes can be labeled as symmetric (two-sided) or asymmetric (one-sided) depending on their weighting behaviors for terms that concentrate mostly in the negative class (negative terms) [9-11]. Symmetric schemes regard negative terms equally valuable as terms that occur mostly in the positive class (positive terms). In other words, terms that are indicative of non-membership are equally important as terms that are indicative of membership in symmetric schemes [10]. Asymmetric schemes give more significance and assign higher weights to positive terms than negative terms. Chisquare (CHI) [12] and two-sided correlation coefficient (| CC |) [10] are symmetric term weighting schemes, which come from term selection field. Log-odds ratio (LOG-OR) [14], which is also primarily designed for term selection, is widely experimented as an asymmetric term weighting scheme. Relevance frequency (RF) [7], on the other hand, is another example of asymmetric schemes which is directly used for term weighting. It is recently argued that there is still potential for further performance improvement by devising better supervised weighting schemes [8]. This paper firstly describes the weighting behaviors of CHI, |CC|, RF and LOG-OR. The recently developed term selection scheme named as multi-class odds ratio (MOR) [15] is presented and its potential use as a weighting scheme is also discussed. Then, the major characteristics of these schemes are explained and, taking these into account, a novel symmetric term weighting scheme based on term occurrence probabilities is proposed. In order to verify the success of the proposed scheme, comprehensive experiments are conducted on four benchmark datasets. The simulation results show that the proposed scheme surpasses the widely used schemes on majority of the categories in the datasets considered. The organization of this paper is as follows. In section 2, the supervised term weighting schemes and their weighting behaviors are examined. The proposed term weighting scheme is explained in section 3. Section 4 discusses the results following the experiments and section 5 summarizes the drawn conclusions.
2. SUPERVISED TERM WEIGHTING The main idea in supervised term weighting is to differentiate terms for their contributions in classifying text documents using their prior distributions and quantify this differentiation in the form of real-valued term weights. These weights are generally considered as scale factors for weights that are computed in an unsupervised way. The most popular unsupervised counterparts can be listed as binary, term frequency (tf) and inverse document frequency (IDF). In forming the feature vector of a document, binary approach represents the existence of a particular term by one and non-existence of that term by zero. In the tf approach, each term is represented by the number of times it exists in the document under concern [5]. On the other hand, IDF is based on the assumption that common terms are not equally important as rare ones where the weight of a given term is inversely proportional to the number of documents in which it exists [5]. Contrary to unsupervised weighting schemes, occurrence of terms in different classes
TERM WEIGHTING USING TERM OCCURRENCE PROBABILITIES
821
Table 1. Two way contingency table for term tk and class ci. ci ci
tk B D
tk A C
Table 2. Supervised term weighting schemes. Scheme
Mathematical form
CHI
N ( AD − BC ) 2 ( A + C )( B + D )( A + B )(C + D )
| CC |
MOR LOG-OR RF
N AD − BC ( A + C )( B + D )( A + B )(C + D ) AD BC , )) BC AD AD log 2 (2 + ) BC A log 2 (2 + ) C
log 2 (2 + max(
is taken into account in supervised weighting. In general, prior distributions are represented in the form of document frequencies in terms of four information elements as shown in Table 1. In this table, A represents the number of documents in the positive class that contain term tk, C represents the number of documents in the negative class that contain term tk, B represents the number of documents in the positive class that do not contain term tk and D represents the number of documents in the negative class that do not contain term tk. The total number of documents is represented by N where N = A + B + C + D. Table 2 presents the mathematical forms of some known supervised schemes. CHI is a popular symmetric term weighting scheme whose performance is revealed in several domains [6, 7]. It measures the dependence of terms to the positive and negative classes using the two-way contingency table. CC is proposed as the asymmetric counterpart of CHI and it promotes terms that have high frequency in the positive class but are rare in the negative class [13]. The symmetric version, | CC | is obtained by ignoring sign (AD − BC) in the numerator as given in Table 2. Their asymmetric opponents among several others are log-odds ratio (LOG-OR) and relevance frequency (RF). LOG-OR which is mentioned frequently in the literature [11, 15] evolved out as a term selection scheme for binary classification domains. Relevance frequency (RF) is a stand-alone asymmetric term weighting scheme which favors positive terms. MOR is applied on several datasets using naive Bayes classifiers for term selection task and has proven to be effective due to preferring not only positive terms but also negative terms [15]. In fact, MOR is formulated as the symmetric version of LOG-OR. To the best of our knowledge, it has not been used for term weighting and its effectiveness in this area is yet to be analyzed. LOG-OR and RF favor terms that are indicative of the positive class membership due to their asymmetric characteristics whereas CHI, |CC|, and MOR favor terms that are indicative of either positive or negative class membership. In recent studies, the performance of the aforementioned schemes with the excep-
ZAFER ERENEL, HAKAN ALTINÇAY AND EKREM VAROĞLU
822
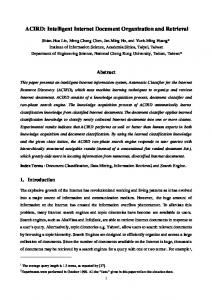
tion of MOR are examined for term weighting on different datasets [6, 7]. The superior performance of RF over other schemes on several datasets has made it the leading asymmetric scheme in term weighting [8]. RF does not take into account the total number of documents in different classes. As a result, highly occuring terms that concentrate in the negative class are assigned relatively lower weights. On the other hand, CHI, |CC|, MOR and LOG-OR consider all four information elements A, B, C and D. Lan et al. [8] argue that terms’ discrimination power can be expressed better without the use of element D because of the fact that D is generally much larger than A, B and C. Moreover, they suggest that high-frequency terms that are prevalent in the positive category should be favored because they are better discriminators compared to high-frequency terms that exist in the negative category. They based this favoritism on the assumption that the negative class is formed by a collection of documents and terms from a wide range of other categories. In that study, RF is experimentally shown to provide better performance compared to other recognized symmetric and asymmetric schemes [8]. For further clarification of the weighting behaviors of these schemes, consider the terms t1, t2, t3, t4 and t5 whose two-way contingencies are as given in Table 3. t1 occurs highly in the positive class and t5 occurs highly in the negative class whereas t3 is distributed equally between positive class and negative class. t2 occurs slightly higher in the positive class and t4 occurs slightly higher in the negative class. The weights of the terms given in Table 3 are presented in Fig. 1. As it can be seen in the figure, RF and LOG-OR favor t1 more than other terms by assigning higher weights whereas CHI, |CC|, and MOR value symmetric term pairs (t1, t5) and (t2, t4) equally. Table 3. Two-way contingency table for t1, t2, t3, t4 and t5. ci ci
t1 A = 45 C=5
t1 t2 t3 t4 t2 t3 t4 t5 B = 5 A = 35 B = 15 A = 25 B = 25 A = 15 B = 35 A = 5 D = 45 C = 15 D = 35 C = 25 D = 25 C = 35 D = 15 C = 45
7
70
LOG-OR RF
5
50
4
40
3
30
2
20
1
10
t1
t2
t3
Terms
t4
t5
CHI MOR |CC|
60
Weight
Weight
6
0
t5 B = 45 D=5
0
t1
t2
t3
t4
t5
Terms
(a) (b) Fig. 1. Weights generated by (a) LOG-OR, RF and (b) CHI, MOR and | CC | for terms in Table 3.
In addition to symmetricity, the range of weights is considered as another significant factor affecting the performance of term weighting schemes [8]. A large dynamic range may suppress the contribution of term frequency values where some terms may dominate the overall decision due to very large weights [8]. For instance, the weights generated by
TERM WEIGHTING USING TERM OCCURRENCE PROBABILITIES
Table 4. The maximum and minimum weights of RF, LOG-OR, CHI, category “Earn” of Reuters-21578 dataset. Weighting Scheme RF LOG-OR CHI | CC | Maximum Weight 9.01 9.62 3474.61 58.94 Minimum Weight 1.00 1.01 4.83 × 10⁻⁶ 2.19 × 10⁻³
823
| CC | and MOR in
MOR 9.62 1.58
CHI have a larger range compared to the weights computed by the majority of the other schemes. This can also be seen in Table 4 which presents the minimum and maximum weights computed for the category “Earn” of Reuters-21578 ModApte Top10 dataset (http: //www.daviddlewis.com/resources/testcollections/reuters21578/). The aforementioned weighting schemes can be grouped into different sets based on the dynamic range of their weights as {CHI} >> {| CC |} > {RF, LOG-OR, MOR}. We believe that, rather than its symmetric weighting characteristic, the inferior performance of CHI compared to RF can be attributed to its large dynamic range of weights. Based on the discussions presented above, it can be concluded that the treatment of negative terms and the dynamic range of weights are two important factors that affect the performance of weighting schemes. In this study, our hypothesis is that negative terms are equally valuable as positive terms. Based on this hypothesis, we propose a novel symmetric weighting scheme which takes into account the distribution of terms in two-dimensional term occurrence probabilities space and has a smaller range compared to CHI and |CC|.
3. PROPOSED SCHEME In text categorization, the feature vector of a given document is formed by taking into account the occurrence of terms in the corresponding document. In supervised weighting, the weight of a given term is computed in terms of its occurrence probabilities in the training data of positive and negative classes. Although the weight expressions are generally presented in terms of the information elements given in Table 1, all schemes can be formulated as a function of term occurrence probabilities. In other words, the weight of a given term depends on its position on the (pk+, pk−) plane where, pk+ = P(tk ci ) and pk− = P(tk ci ).
(1)
pk+ and pk− can be computed using Table 1 as, pk+ =
C A . and pk− = C+D A+ B
(2)
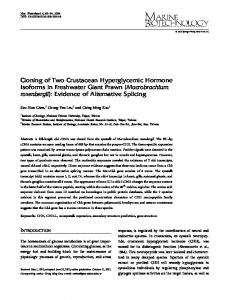
The terms listed in Table 3 are presented on the (pk+, pk−) plane in Fig. 2. Terms having pk+ > pk− are positive terms whereas pk+ < pk− are negative terms. It is clear that different weighting schemes can be developed as a function of pk+ and pk−. However, as described earlier, one of the main factors in scheme design is the establishment of symmetric or asymmetric weighting charasteristic. For that reason, the relative values of pk+ and pk− may be quantified and used as a parameter for the computation of weights.
ZAFER ERENEL, HAKAN ALTINÇAY AND EKREM VAROĞLU
824
1 t5
0.9 0.8
t4
0.7
p+k = p-k
p-k
0.6
t3
0.5 0.4 t2
tk
0.3 0.2
t1
0.1 0
θk 0
0.1
0.2
0.3
0.4
0.5
0.6
0.7
0.8
0.9
1
p+k
Fig. 2. The position of terms t1, …, t5 on the (pk+, pk−) plane and angle θk of term tk.
In this study, each term is represented in terms of the angle of the line passing through its position and the origin of the (pk+, pk−) plane. As seen in Fig. 2, the term tk can be represented by the angle denoted by θk and all five terms presented in the figure can be differentiated using their angles. For a given a term, if the angle is less than π/4, it is a positive term and negative otherwise. In asymmetric schemes, the weights decrease as θk increases from zero to π/2. If a symmetric weighting scheme is to be designed, the terms having pk+ >> pk− or pk+ π /4 k ⎩
(4)
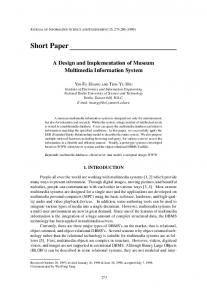
where α is considered as a design parameter to be tuned. This function is plotted for α ∈ {1, …, 5} values in Fig. 4 (a). As seen in the figure, α can be used to specify the relative weights of terms that are close to or outlying from the pk+ = pk− line. Consequently, the dynamic range of weights can be modified. The function is almost piece-wise linear when α is 1. However, it is upward-sloping and increases more rapidly when θk is closer to zero or π/2 if α is greater than or equal to 2. In Fig. 4 (b), the contour lines of f(α, θ) are presented. As seen in the figure, the contour lines are linear passing through the origin. To the best of our knowledge, this is the first attempt to define a symmetric term weighting scheme having linear contour lines for text categorization. 1
1
0.9
0.9
0.8
0.8
0.7
0.7
0.5 0.4 0.3
0
0.16
0.5 0.24
0.4
0.28 0.35
0.3 0.64
α=2
0.2 0.1
0.28
0.6
α=1
p-
f(α,θ)
0.6
0.39 0.35
0.55
0.2
α=3
π/4 θ
0.1
π/2
0
0.55 0.64 0
0.1
0.2
0.3
0.4
0.5
0.6
0.7
0.8
0.9
1
p+
(a) (b) Fig. 4. (a) The weighting function f(α, θ ) for α ∈ {1, …, 5}; (b) The contour lines of f(α, θ ) for α = 3 computed using top 5000 terms of category “Earn” in Reuters-21578 dataset.
The best-fitting value of α may depend on the nature of the categorization problem as well as the category under concern. In other words, it can be tuned using the training data of each category separately. However, since this corresponds to a computationally demanding procedure, a better approach would be to exploit a fixed value for all categories and categorization problems. In this study, we followed the latter approach. The bestfitting value is computed using the training data of Reuters-21578 ModApte Top10 dataset and it is used on all datasets.
4. EXPERIMENTS In order to evaluate the effectiveness of the proposed scheme, a comprehensive experimental study is carried out by implementing binary classification. The proposed scheme
TERM WEIGHTING USING TERM OCCURRENCE PROBABILITIES
827
is compared to all five schemes presented in Table 2 using four benchmark datasets. Reuters-21578 news collection contains 21,578 news articles in 135 categories collected from the Reuters newswire in 1987. Each article may have more than one category label. The ModApte split of ten most populous categories, which is made of 9,980 news stories, has been generally used both in feature selection and feature weighting experiments [8, 16]. WebKB is a collection of 8,282 web pages which belong to seven categories. They were collected from computer science departments of several universities in 1997 by the Carnegie Mellon University Text Learning Group (http://www-2.cs.cmu.edu/afs/cs.cmu. edu/project/theo-20/www/data). Each page belongs to only one category. Three categories are usually discarded and the remaining categories, “Student”, “Faculty”, “Course” and “Project” which contain totally 4199 documents are considered [17]. The 7-Sectors dataset contains 4581 web pages. (http://www.cs.cmu.edu/ads/cs.cmu.edu/project/theo-11/ www/wwkb/index.html). Each page belongs to one parent category and one subcategory in hierarchical order. Following the previous experiments in the literature [18], seven parent categories are used. CSTR2009 dataset is composed of 625 abstracts, each belonging to a single category, from technical reports in four research areas published in the Department of Computer Science at the University of Rochester between 1991 and 2009 (http://www.cs.rochester.edu/trs/). It is an extended version of CSTR dataset which was used in a previous study [19]. Preprocessing is applied to all documents before training the classifiers. For each document, stop words are firstly removed using SMART stoplist [20]. Then, Porter stemming algorithm is applied [21]. Term frequencies in each document are cosine-normalized as a standard procedure to even out the quantitative differences of terms in short and long documents in the corpus. The term weights of each scheme are then computed from the training data and multiplied by the cosine-normalized term frequencies. Among the four datasets considered, only Reuters-21578 ModApte Top10 has a standard train/test split. Therefore, following the work of Bekkerman et al. and Xue et al. [22, 23], four-fold cross-validation is performed on the remaining datasets. For this purpose, the available data is initially partitioned into four folds. Four experiments are then performed where, in each experiment, one fold’s data are used for testing while data in the remaining folds are used for training. The average scores are reported. SVM has a better performance than other classification methods in text categorization since it is based on the structural risk minimization principle. Exploiting different kernel functions, it is possible to generate linear and nonlinear SVMs [4]. Previous experiments have shown that linear SVMs perform better than nonlinear ones in text categorization [8]. Hence linear SVM is adopted in our experiments. SVMlight software, which is widely used in text categorization [24], is used with default parameters [25]. The commonly used evaluation metric for text classification is the F1 measure which is the harmonic mean of precision and recall as defined in Eqs. (5), (6), and (7). 2 × precision × recall precision + recall TPi precision = TPi + FPi TPi recall = TPi + FNi F1 score =
(5) (6) (7)
828
ZAFER ERENEL, HAKAN ALTINÇAY AND EKREM VAROĞLU
The terms TPi, FPi, FNi denote the numbers of true positives, false positives and false negatives of the ith category, respectively. A text categorization system can be tuned to maximize precision producing a low recall value. Similarly, recall can be maximized at the expense of precision. Because of this, their combination named as F1 score is generally considered as more significant [26]. For a given C-class problem, precision, recall and F1 score are computed for each class separately. Macro-F1 score is computed by taking the average of individual F1 scores. Micro-F1 score is computed by considering the total number of true positives, false positives, and false negatives over all categories which can be computed as TP = ∑ TPi , FP = ∑ FPi and FN = ∑ FN i . i =1,",C
i =1,",C
i =1,",C
Term selection is a common procedure preceding term weighting for several reasons. Firstly, selection of a subset of terms reduces the computation time, memory requirements and storage amounts. Secondly, it is observed in a recent study that the F1 scores of most weighting schemes plateau after 5000 terms for SVM [7]. CHI has demonstrated its success in providing a high-quality term ranking to select a subset of features for further processing [12]. Therefore, the top 5000 terms from CHI rankings are used in this study. However, in the CSTR2009 dataset, the total number of processed terms is less than 3500 in some folds. Therefore, the top 3000 terms are used for this dataset in all four folds. For the evaluation of the proposed scheme, the best-fitting value of α in the weight expression f(α, θ) should be initially computed. As described before, the category independent best-fitting value is computed using 5-fold cross validation on the training data of Reuters-21578 ModApte Top10. The training data is split into 5 equal-sized parts. Leaving one part out for validation and using the remaining parts for training, the text categorization system is trained and then validated five times for each category and the average of five F1 values are computed. The macro-F1 score is then calculated for α ∈ {1, …, 5} to determine the best fitting α value. The results are presented in Table 5. As it can be seen in the table, the best-fitting value of α is computed as 3. This value is used for all datasets. Table 6 presents the text categorization performances achieved for different α values on the test data of Reuters-21578 ModApte Top10. As seen in the table, the best test results are achieved for the same value of α which shows that the computed value is a reliable estimate. It should be noted that, α = 1 corresponds to the case where the dynamic range of the generated weights is smaller compared to α = 3. On the other hand, the dynamic range of the generated weights is larger when α = 5 is selected. On both settings, the performance decreases consistently on both training and test datasets. This observation strongly supports the argument that the dynamic range is a key factor for the performance of term weighting schemes. Table 5. The macro-F1 scores of tf × f(α, θ) on Reuters-21578 ModApte Top10 training dataset for α ∈ {1, …, 5}. α=1 α=2 α=3 α=4 α=5 Macro-F1 90.01 90.31 90.36 90.29 90.10 Table 6. The macro-F1 scores of tf × f(α, θ) on Reuters-21578 ModApte Top10 test dataset for α ∈ {1, …, 5}. α=1 α=2 α=3 α=4 α=5 Macro-F1 88.99 89.01 89.61 89.22 88.92
TERM WEIGHTING USING TERM OCCURRENCE PROBABILITIES
829
Table 7. The macro-F1 and micro-F1 scores of RF, LOG-OR, CHI, | CC |, MOR and f(α = 3, θ) computed on four datasets using SVM. Dataset Metric tf × RF tf × LOG-OR tf × CHI tf × |CC | tf × MOR tf × f(α = 3, θ) Reuters Macro-F1 89.46 88.82 88.54 88.96 89.61 89.65 Micro-F1 94.73 94.29 93.36 94.20 94.89 94.91 WebKB Macro-F1 86.20 84.50 85.71 87.18 86.78 87.64 Micro-F1 88.64 87.82 88.34 89.70 89.37 89.95 7-Sectors Macro-F1 85.28 86.52 77.02 82.69 86.51 89.23 Micro-F1 85.08 86.00 76.29 82.95 86.52 89.37 CSTR2009 Macro-F1 81.29 81.07 77.69 81.32 81.66 81.74 Micro-F1 85.45 85.14 81.66 85.11 86.08 86.35
Table 7 presents the macro-F1 and micro-F1 scores computed using four datasets where the best scores are presented in boldface. As seen in the table, the proposed scheme provides the highest micro-F1 scores on all datasets. On the Reuters-21578 and CSTR2009 datasets, MOR provides the highest macro-F1 scores. When macro-F1 and micro-F1 scores are considered, it can be seen in the table that MOR achieves a better performance than RF on all datasets. This justifies our argument that the superiority of RF compared to several other symmetric schemes such as CHI can not be solely attributed to its asymmetric weighting characteristic. Similarly, the proposed symmetric scheme provides better scores than RF on all datasets. The comparison of MOR and LOG-OR is important since MOR is the symmetric version of LOG-OR. The superior performance of MOR can be easily observed in the table. In fact, this is a strong support to our main hypothesis favoring both positive and negative terms for text categorization. The comparison of CHI and |CC| is also important since both methods are symmetric. Although their main difference is their dynamic ranges, the nonlinear transformation (i.e. square root) applied to generate |CC| modifies the relative values of weights as well. However, since this nonlinear transformation does not make the modification in favor of either positive or negative terms, the superiority of |CC| can be attributed to its smaller dynamic range. Table 8 presents the rank distribution of five reference weighting schemes and the proposed approach. If two schemes provide the same F1 score, they are assigned the same rank. As seen in the table, the proposed scheme ranks first on 16 out of totally 25 categories that exists in the four datasets. The last row presents the weighted average of the rank values which are computed by weighting the rankings provided by each scheme using the corresponding ranks. As seen in the table, the proposed scheme provides the best average rank value and MOR is the best among the reference schemes. The superior performance of |CC| compared to CHI is also evident in their category dependent behaviors. It can be seen in Tables 9-12 that |CC| performs better than CHI on 6 categories of Reuters-21578 and all categories of the other datasets. Although MOR has not been considered for term weighting so far, it can be seen in the category dependent results that it performs worse compared to |CC| only on 6 categories when all four datasets are considered. Another important remark is that all schemes rank first on at least 2 categories. This means that the relative performance of the weighting schemes depends on the category under concern. For instance, CHI, which provides the worst average performance, per-
830
ZAFER ERENEL, HAKAN ALTINÇAY AND EKREM VAROĞLU
Table 8. The rank distribution of RF, LOG-OR, CHI, | CC |, MOR and f(α = 3, θ) in terms of individual category F1 scores over four datasets. Rank tf × RF tf × LOG-OR tf × CHI tf × | CC | tf × MOR tf × f(α = 3, θ) 1 4 2 2 3 2 16 2 3 5 0 2 14 1 3 6 2 0 2 6 6 4 8 7 3 3 3 1 5 4 3 2 15 0 0 6 0 6 18 0 0 1 Average Rank 3.20 3.88 5.28 4.00 2.40 1.84 Table 9. F1 scores obtained for top 10 categories of Reuters-21578 ModApte split using SVM. Category tf × RF tf × LOG-OR tf × CHI tf × | CC | tf × MOR tf × f(α = 3, θ) Earn 98.58 98.53 97.61 98.44 98.94 98.99 Acq 96.96 95.27 96.41 97.47 97.47 97.47 Money-fx 86.81 85.24 83.80 85.47 86.43 86.81 Grain 95.17 95.89 95.89 96.22 96.22 96.58 Crude 91.78 90.10 91.62 92.11 91.82 92.35 Trade 87.11 85.59 85.97 85.84 86.88 87.67 Interest 81.97 82.30 79.32 80.67 82.30 82.64 Wheat 84.67 82.96 83.69 85.11 84.44 86.11 Ship 82.28 81.01 85.89 83.02 83.02 86.42 Corn 86.79 84.91 85.71 87.62 87.38 88.68 Table 10. F1 scores obtained for 4 categories of WebKB using SVM. Category tf × RF tf × LOG-OR tf × CHI tf × |CC| tf × MOR tf × f(α = 3, θ) Student 91.24 90.52 92.40 92.43 93.17 93.17 Faculty 84.52 84.98 83.03 84.77 84.83 85.44 Course 95.45 95.07 94.02 95.22 95.95 96.05 Project 73.58 67.43 73.40 74.91 73.96 76.51 Table 11. F1 scores obtained for 7 categories of 7-Sectors using SVM. Category tf × RF tf × LOG-OR tf × CHI tf × |CC| tf × MOR tf × f(α = 3, θ) Technology 83.76 84.39 80.07 85.56 86.04 88.90 Financial 86.37 87.11 74.04 83.35 87.73 90.66 Basic Materials 81.14 81.95 66.35 77.77 83.32 87.63 Transportation 91.50 91.40 83.83 87.86 91.50 92.63 Healthcare 87.35 88.36 74.94 79.99 87.23 89.16 Energy 86.23 88.40 84.43 84.90 87.34 89.51 Utilities 80.59 84.04 75.46 79.39 82.42 86.10 Table 12. F1 scores obtained for 4 categories of CSTR2009 using SVM. Category tf × RF tf × LOG-OR tf × CHI tf × | CC | tf × MOR tf × f(α = 3, θ) Systems 93.37 92.90 90.39 92.28 93.67 93.79 Theory 92.56 92.29 85.80 91.67 94.43 95.61 AI 66.52 64.51 66.31 65.50 64.10 66.80 Robotics and Vision 72.70 72.27 70.07 73.38 73.15 75.04
TERM WEIGHTING USING TERM OCCURRENCE PROBABILITIES
831
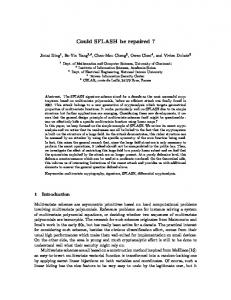
forms the best on 2 categories. It can be seen in Table 9 that, on categories “Wheat” and “Ship” in Reuters-21578, CHI provides considerably better F1 scores compared to the best performing schemes, f(α, θ) and MOR. |CC| provides much better results than all other schemes on the “Robotics and Vision” category of CSTR2009. These examples can be increased. It is known that each weighting scheme is based on a different methodology and a set of assumptions. Since each weighting scheme can be considered as a function of the position of terms on the (pk+, pk−) plane, it can be argued that the relative performance of different schemes depends on the distribution of terms on the (pk+, pk−) plane. If the relation between the distribution of the terms and the performance of each weighting scheme could be established, it would be possible to generate better weighting schemes. Although this seems to be a fruitful research direction, taking into account the complexity of the weighting behaviors of the existing schemes presented in Fig. 3, it can be argued that forming such a relation may not be straightforward. It has been previously shown that RF provides better F1 scores than several widely used schemes such as LOG-OR and CHI [8]. It can be seen in Tables 9-12 that the results obtained in this study are consistent. In particular, RF surpasses LOG-OR, CHI and |CC| on 15, 22 and 19 categories out of 25 respectively. However, it is surpassed by MOR and f(α, θ) on 17 and 19 categories respectively. In order to get further insights about the differences between the proposed scheme and existing symmetric schemes, the weights computed by these schemes are compared. The term weights of the top 5000 for category “Earn” are presented in Fig. 5 for all four f(α=3,θ)
MOR 10
0.9
9
0.8
8
0.7
7
Weight
Weight
1
0.6 0.5
6 5
0.4
4
0.3
3
0.2
2
0.1
0
500
1000
1500
2000
2500
3000
3500
4000
4500
1
5000
0
500
1000
1500
2000
(a) f(α, θ).
3500
4000
4500
5000
3500
4000
4500
5000
|CC|
3500
60
3150
54
2800
48
2450
42
2100
36
Weight
Weight
3000
(b) MOR.
CHI
1750 1400
30 24
1050
18
700
12 6
350 0
2500
Terms
Terms
0
500
1000
1500
2000
2500
Terms
3000
3500
4000
4500
5000
0
0
500
1000
1500
2000
2500
3000
Terms
(c) CHI. (d) |CC|. Fig. 5. The weights of top 5000 terms computed from category “Earn” using symmetric schemes.
832
ZAFER ERENEL, HAKAN ALTINÇAY AND EKREM VAROĞLU
symmetric schemes. The weights of terms are plotted in decreasing order. As it can be seen in the figure, the weights computed by CHI and |CC| decline sharply compared to the weights assigned by MOR. On the other hand, the curve is flat for more than half of the terms for f(α, θ). In other words, a much wider range of terms are considered as highly valuable by the proposed scheme. It should be noted that these terms are located on either the pk+ or pk− axes which means that they appear only in either the positive class or negative class. Consequently, rare terms which occur only in one of the classes receive the highest weight. Thus, the proposed scheme preserves the premise of the unsupervised IDF, but only for a subset of rare terms in the corpus. In the same way, rare terms which exist in both classes receive low weights since θk ≈ π/4 for such terms.
5. CONCLUSIONS In this study, the behavior of several existing supervised term weighting schemes are investigated. This is done by computing their contour plots in order to identify the set of terms receiving the same weight. The analysis is also done for the recently proposed term selection scheme named as MOR since it is also considered in this study for term weighting. The contour plots clarified their exact weighting behaviors as well as their symmetric weighting characteristics. As an important parameter which affects the relative performance of different schemes, the dynamic ranges of these schemes are also studied. Using the fact that the existing schemes which are based on different methodologies can be expressed in terms of term occurrence probabilities, a novel scheme for term weighting is proposed. The proposed scheme takes into account the position of terms on the (pk+, pk−) plane in computing their weights and this does not require any extra statistics other than the four information elements A, B, C and D. Experimental results on four datasets show that the proposed scheme achieves superior performance than five reference schemes. On 16 categories in four datasets considered, the proposed scheme ranks first whereas its competitors took the first position on four or smaller number of categories. We believe that other forms of weighing functions in terms of term occurrence probabilities may be studied as well. The proposed scheme can be considered as an initial effort for an alternative direction of weight generation since the direct use of term occurrence probabilities provides a flexible framework for defining weighting schemes. As a further research, for a set of terms lying on the horizontal axis, assigning larger weights to terms with pk+ >> 0 than to those with pk+ ≈ 0 might be considered. Similarly, for a set of terms lying on the vertical axis, terms having pk− ≈ 0 may be assigned smaller weights than those having pk− >> 0. This may further improve the performance of the proposed scheme.
REFERENCES 1. A. Selamat and S. Omatu, “Web page feature selection and classification using neural networks,” Information Sciences, Vol. 158, 2004, pp. 69-88. 2. S. Tan, “Neighbor-weighted k-nearest neighbor for unbalanced text corpus,” Expert Systems with Applications, Vol. 28, 2005, pp. 667-671. 3. V. Metsis, I. Androutsopoulos, and G. Paliouras, “Spam filtering with naive bayes – Which naive bayes,” in Proceedings of the 3rd Conference on Email and Anti-Spam,
TERM WEIGHTING USING TERM OCCURRENCE PROBABILITIES
833
2006, pp. 1-5. 4. C. J. C. Burges, “A tutorial on support vector machines for pattern recognition,” Data Mining and Knowledge Discovery, Vol. 2, 1998, pp. 121-167. 5. E. Leopold and J. Kindermann, “Text categorization with support vector machines, How to represent texts in input space,” Machine Learning, Vol. 46, 2002, pp. 423-444. 6. Y. Liu, H. T. Loh, and A. Sun, “Imbalanced text classification: A term weighting approach,” Expert Systems with Applications, Vol. 36, 2009, pp. 690-701. 7. M. Lan, C. L. Tan, and H. B. Low, “Proposing a new term weighting scheme for text categorization,” in Proceedings of the 21st National Conference on Artificial Intelligence, 2006, pp. 763-768. 8. M. Lan, C. L. Tan, J. Su, and Y. Lu, “Supervised and traditional term weighting methods for automatic text categorization,” IEEE Transactions on Pattern Analysis and Machine Intelligence, Vol. 31, 2009, pp. 721-735. 9. Z. Erenel, H. Altınçay, and E. Varoğlu, “A symmetric term weighting scheme for text categorization based on term occurrence probabilities,” in Proceedings of International Conference on Soft Computing, Computing with Words and Perceptions in System Analysis, Decision and Control, 2009, pp. 1-4. 10. Z. Zheng, X. Wu, and R. Srihari, “Feature selection for text categorization on imbalanced data,” ACM SIGKDD Explorations Newsletter, Vol. 6, 2004, pp. 80-89. 11. G. Forman, “An extensive empirical study of feature selection metrics for text classification,” Journal of Machine Learning Research, Vol. 3, 2003, pp. 1289-1305. 12. Y. Yang and J. O. Pedersen, “A comparative study on feature selection in text categorization,” in Proceedings of the 14th International Conference on Machine Learning, 1997, pp. 412-420. 13. H. T. Ng, W. B. Goh, and K. L. Low, “Feature selection, perceptron learning, and a usability case study for text categorization,” in Proceedings of the 20th Annual International SIGIR Conference on Research and Development in Information Retrieval, 1997, pp. 67-73. 14. D. Mladenic and M. Grobelnik, “Feature selection on a hierarchy of web documents,” Decision Support Systems, Vol. 35, 2003, pp. 45-87. 15. J. Chen, H. Huang, S. Tian, and Y. Qu, “Feature selection for text classification with naive bayes,” Expert Systems with Applications, Vol. 36, 2009, pp. 5432-5435. 16. H. Ogura, H. Amano, and M. Kondo, “Feature selection with a measure of deviations from poisson in text categorization,” Expert Systems with Applications, Vol. 36, 2009, pp. 6826-6832. 17. X. B. Xue and Z. H. Zhou, “Distributional features for text categorization,” IEEE Transactions on Knowledge and Data Engineering, Vol. 21, 2009, pp. 428-442. 18. G. M. D. Nunzio, “Using scatterplots to understand and improve probabilistic models for text categorization and retrieval,” International Journal of Approximate Reasoning, Vol. 50, 2009, pp. 945-956. 19. T. Li, S. Zhu, and M. Ogihara, “Text categorization via generalized discriminant analysis,” Information Processing and Management, Vol. 44, 2008, pp. 1684-1697. 20. C. Buckley, “Implementation of the SMART information retrieval system,” Technical Report, No. TR85-686, Department of Computer Science, Cornell University, 1985. 21. M. F. Porter, “An algorithm for suffix stripping,” Program, Vol. 14, 1980, pp. 130-137. 22. R. Bekkerman, R. El-Yaniv, N. Tishby, and Y. Winter, “Distributional word clusters
834
23. 24. 25. 26.
ZAFER ERENEL, HAKAN ALTINÇAY AND EKREM VAROĞLU
versus words for text categorization,” Journal of Machine Learning Research, Vol. 3, 2003, pp. 1182-1208. X. B. Xue and Z. H. Zhou, “Distributional features for text categorization,” IEEE Transactions on Knowledge and Data Engineering, Vol. 21, 2009, pp. 428-442. J. Zhan and H. T. Loh, “Using redundancy reduction in summarization to improve text classification by SVMs,” Journal of Information Science and Engineering, Vol. 25, 2009, pp. 591-601. T. Joachims, “Making large-scale support vector machine learning practical,” Advances in Kernel Methods: Support Vector Machines, 1999, pp. 169-184. F. Debole and F. Sebastiani, “An analysis of the relative hardness of Reuters-21578 subsets,” Journal of the American Society for Information Science and Technology, Vol. 56, 2005, pp. 584-596. Zafer Erenel received his B.S. degree in Computer Science Engineering from Istanbul University in 1999, M.B.A. degree from Fitchburg State College in 2002 and M.S. degree in Computer Engineering from Işık University in 2005. He worked as a research assistant in the Computer Engineering Department of Haliç University between 2002 and 2005. At present, he is studying Ph.D. in the Computer Engineering Department at Eastern Mediterranean University where he is working as a research assistant. His research interests include information processing, text categorization and machine learning. Hakan Altınçay received his B.S. (with High Honors), M.S. and Ph.D. degrees in Electrical and Electronics Engineering from Middle East Technical University, Ankara, Turkey. He worked as a research assistant in the Speech Processing Laboratory at Middle East Technical University between February 1996 and February 2000. He joined the Computer Engineering Department of Eastern Mediterranean University in 2000 where he is currently working as an Associate Professor. His main area of interests include pattern recognition including multiple classifier systems, text categorization, face and speaker recognition. Ekrem Varoğlu received his B.S. degree in Electrical Engineering from Pennsylvania State University in 1992, M.E. degree in Electrical Engineering from Texas A&M University in 1994, and Ph.D. degree in Electrical and Electronics Engineering from Eastern Mediterranean University, Northern Cyprus, in 2000. From 2000 to 2004, he worked as an Assistant Professor in the Information Technology Department at Eastern Mediterranean University. In 2004, he joined the Computer Engineering Department of the same university. His current research interests include biomedical text mining, natural language processing, machine learning, and bioinformatics.