JOURNAL OF INFORMATION SCIENCE AND ENGINEERING 19, 637-651 (2003)
Short Paper_________________________________________________ Structure-Based Specification-Constrained Test Frequency Generation for Linear Analog Circuits SOON-JYH CHANG, CHUNG-LEN LEE AND JWU E CHEN* Department of Electronic Engineering and Institute of Electronics National Chiao Tung University Hsinchu, 300 Taiwan E-mail:
[email protected] E-mail:
[email protected] * Department of Electrical Engineering Chung-Hua University Hsinchu, 300 Taiwan E-mail:
[email protected]
In this paper, an approach to generating the sinusoidal stimulus of the right frequency of a linear analog circuit for testing circuit parameter faults under the constraints of the specifications of the circuit under test (CUT) is presented. This approach considers tolerance bounds due to fabrication process fluctuations of tested parameters using a statistical model and maps them to an accepted region of the observed signature of the CUT. The generated test stimulus is derived based on a proposed testing confidence level. Test generation procedures for both the monotonic and non-monotonic relationships between the signature and the parameter are proposed and demonstrated. The procedures are applied to a continuous time state-variable filter example circuit to show the effectiveness of the methodology. Keywords: test pattern generation, analog IC test, structural test, specification test, Monte-Carlo analysis
1. INTRODUCTION Test pattern generation for analog circuits is a difficult task due to the wide variety of circuits, the non-deterministic nature of circuit parameters and the limited controllability and/or observability [1]. There are two basic approaches to test pattern generation for analog circuits, i.e., the functional-driven approach and the structure-based approach. In the functional-driven approach, test patterns are generated to exploit the difference in performance of the normal and faulty circuits [2-4]. However, this approach lacks clear metrics for evaluating the effectiveness of the generated test inputs at the functional level. In the structure-based approach, a fault model, usually at the circuit level, is adopted, and Received October 3, 2001; revised April 12 & July 15, 2002; accepted September 4, 2002. Communicated by Cheng-Wen Wu.
637
638
SOON-JYH CHANG, CHUNG-LEN LEE AND JWU E. CHEN
test patterns (signals) are generated to exploit the observed signature difference between the normal and faulty circuits. It is natural to generate test stimuli by maximizing the observed signature difference between the good and defective circuits [5-7]. This approach usually is efficient for catastrophic faults. Howevr, it is not necessarily efficient for soft faults because the difference between the faulty response and the normal response may not be a monotonous function of the deviating component value. In addition, testability transfer factors have been introduced to aid the construction of efficient dynamic test sets [8], and the sensitivity of circuit components to test parameters has been adopted to generate efficient tests for single and multiple faults [9, 10]. There are also approaches that correlate specifications to non-specification tests for analog circuits [11-13]. In these approaches, the bounds of the tolerance region for each parameter of the CUT can be evaluated under the single fault assumption. However, uncertain regions exist when these bounds are mapped to the observed signatures, especially when the relationship between the observed signature and parameter variation is non-monotonic. It is hard to identify whether a CUT passes or fails the test if the measured performance falls into an uncertain region. This paper proposes a test frequency generation method which correlates circuit parameters to circuit specifications and considers fluctuation in the manufacturing process. And then, it generates tests based on a predefined testing confidence level. This method can eliminate the uncertainties encountered in [11-13] and provide test frequencies which can be used to more effectively test the circuit. The paper is organized as follows: The process of correlating analog faults with specifications is presented first. Then, in section 2, we present Monte Carlo simulation conducted to find the effect of the manufacturing process fluctuation on the above relation and describe a procedure for deriving parameter tolerance ranges under a predefined testing confidence level. Section 3 describes the test generation procedure that maps the parameters to the observed signatures. An illustrative case study on the continuous-time state-variable filter benchmark circuit [14] is presented in section 4 to demonstrate the effectiveness of the approach. Section 5 concludes the paper.
2. MAPPING SPECIFICATIONS TO CIRCUIT PARAMETERS The test pattern generation problem dealt with in this paper is stated as follows: Given the netlist and specifications of a CUT under a specified level of manufacturing process fluctuation, the problem is to generate the efficient test frequency for each circuit parameter (resistance, capacitance, W/L etc.) under a desired testing confidence level and to derive the corresponding tolerance range for the observed signature. When the CUT passes the tests, which are derived for each circuit parameter, all the circuit specifications are implicitly met. Consider a circuit of m parameters, P = [p1, p2, …, pm], where pi may be the resistance of a resistor, the capacitance of a capacitor, the W/L ratio of a transistor, the VT value of a transistor etc. The performance of the circuit is bounded by n specifications, S = [s1, s2, …, sn], for which Su = [s1u, s2u, … , snu] and Sl = [s1l, s2l, … , snl] denote the upper and lower bounds for these specifications, respectively. The circuit is designed with its parameters at the nominal P values: P0 = [p10, p20, …, pm0]. Correspondingly, it has a target performance, S0 = [s10, s20, …, sn0].
TEST GENERATION FOR ANALOG CIRCUITS
639
A specification, for example the j-th specification (sj), can be represented as a function of all parameters, i.e., s j = f ( p1 , p2 ,KK, pm ) .
(1a)
Under the single fault assumption, for example the i-th parameter (pi) deviation fault, all the parameters in Eq. (1a) are fixed to their nominal values except pi, which is allowed to vary. Hence, sj can be represented as a function of pi, denoted as sj(pi), that is,
(
)
s j ( pi ) = f p10 , p20 ,K, pi0−1 , pi , pi0+1 ,K, pm0 .
(1b)
For a fault free circuit, i.e., the i-th parameters (pi) equal to its nominal value (pi0), the value of the j-th specification equals sj(pi0), while for a faulty circuit with pi deviating to a value K, sj shifts to sj(K). sj can be obtained, easily if Eq. (1b) is simple and explicit, or with more difficulty via simulation if Eq. (1b) is non-explicit and complicated. Considering the variations in the parameter space due to fluctuation in the process, there will correspondingly be variation in the specification space of the circuit. The relationships between the specification and the parameter will become a band instead of a single curve [16]. If the variations of all the parameters are assumed to be random with a normal distribution, the corresponding distribution of specifications will also be Gaussian [15]. Generally, specification sj has a distribution, due to the process fluctuation, with respect to parameter pi, denoted as sj(x, pi), such as follows: (
)
− x − µ j ( pi ) 2
S j ( x , pi ) =
1 2π σ j ( pi )
e
2σ 2j ( pi )
(2)
,
where x is the value of specification sj, µj is the mean value and σj2 is the variance of specification sj. If there is a fault on pi, i.e., pi = K, then sj will have a new distribution with a new mean value (µ) and new variance (σ2), which can be obtained through Monte Carlo simulation and statistical analysis. For a fault-free circuit whose specification sj is bounded by sju and sjl, the circuit passes a specification test if s lj ≤ s j ≤ s uj under a specified test input. However, theoretically, there is a very small probability that the circuit may not pass the specification test due to the fact that sj is a distribution, which is caused by variation in the values of all the other parameters due to the process fluctuation even though pi is at its normal value. As the parameter pi deviates from its nominal value to the faulty value, the probability of the CUT passing specification sj decreases. The probability that the circuit will pass sj when pi deviates to the faulty value K is pass
Prob( p i = K → s j ) =
s uj
1 2π σ
j
(K ) ∫ s
l j
(
)
− x − µ j (K ) 2
e
2σ 2j ( K )
dx.
(3)
In addition, the probability that the CUT will fail sj when pi deviates to the faulty value K is
SOON-JYH CHANG, CHUNG-LEN LEE AND JWU E. CHEN
640
fail
1
Prob ( p i = K → s j ) =
2π σ j (K )
∫
s lj −∞
(
− x−µ j (K )
e
2σ 2j ( K )
)2
dx +
1 2π σ j (K )
∫
∞ s uj
(
− x−µ j (K )
e
2σ 2j ( K )
)2
dx.
(4)
Naturally, pass
fail
Prob( pi = K → s j ) + Prob( pi = K → s j ) = 1.
(5)
Hence, theoretically, according to the above analysis, for a CUT, even when it passes all specification tests, it still has a certain possibility, although small, of failing to work normally. Here, the term “testing confidence (TC)” is introduced. It is the probability that a CUT, when passing a test, will work normally. The bounds of the ranges of “accept” or “reject” for a circuit to pass specification sj for pi can be obtained by solving Eq. (3) under a given testing confidence level: TC =
1 2π σ j (K )
∫
suj slj
(
)
− x−µ j ( K ) 2
e
2σ 2j ( K )
dx.
(6)
For example, if TC is 90%, four bounds, denoted as BP1ij, BP2ij, BF1ij, and BF2ij, respectively, solved for parameter pi to pass or fail sj [16]. The circuit will pass sj with over 90% probability when pi is between BP1ij and BP2ij, and will fail, with over 90% probability, if pi is below BF1ij or over BF2ij. Within the two gray regions, i.e., BF1ij to BP1ij and BP2ij to BF2ij, the circuit cannot be determined to be “pass” or “fail” due to random variations caused by process fluctuations of other parameters. If we reduce TC, then these two regions will shrink. For example, if we only require a TC of 50%, then these two regions will shrink to zero. When a circuit is fault-free, it satisfies “all” specifications. As a result, the bounds of the “accept” range for pi are given by BP1i = maximum(BP1i1, BP1i2, … , BP1in),
(7a)
BP2i= minimum(BP2i1, BPi2, … , BP2in).
(7b)
On the other hand, a circuit is considered to be faulty if it violates one of the specifications. Hence, the bounds of the “reject” range for pi are BF1i =maximum(BF1i1, BF1i2, … , BF1in),
(8a)
BF2i=minimum(BF2i1, BF2i2, … , BF2in).
(8b)
In summary, in the above, we have demonstrated how the tolerance bound of a parameter can be derived, starting from the constraints of specifications under a desired level of testing confidence. We have shown that tolerance bounds depend on a given level of testing confidence.
TEST GENERATION FOR ANALOG CIRCUITS
641
3. TEST GENERATION PROCESS In this section, we will illustrate how to generate the test stimulus and the corresponding tolerance ranges of an observed signature while considering the “accept” tolerance ranges, which are obtained as described in the previous section. The relationships between signatures and parameters fall into two categories: monotonic and non-monotonic. Different test strategies are proposed to generate test stimuli for these two categories: 3.1 Test Generation under the Monotonic Signature - Parameter Relationship When a monotonic relationship exists between a signature and a parameter, the signature is an either monotonic increasing (as shown in Fig. 1) or decreasing function of the parameter. In this case, it is easy to determine the pass/fail range of the observed signature by mapping the pass/fail tolerance bounds of the parameter axis onto the parameter axis via the relationship curve. There are two uncertain regions on the signature axis, resulting from the uncertain regions on the parameter axis. As discussed in the previous section, if we require for a 50% TC, these two uncertain ranges will shrink to zero. Signature
Fail Uncertain Pass Uncertain Fail Fail
Pass
Fail
Parameter
Fig. 1. Tolerance range for a monotonic relationship between a signature and a parameter.
Now, the problem of test generation is to generate the test stimulus that can best distinguish the fault effect. The sensitivity-based method [9, 10] generates test stimuli based on the maximum sensitivity of the signature with respect to the parameter, for which there is a fault to be tested. However, as the following example shows, consideration of only sensitivity is not adequate for selecting the optimum input test stimulus. Fig. 2 shows a simple low pass filter, where (a) is the circuit diagram. The transfer function of this low pass filter is
Vout ( s) − R2 R1 = . Vin ( s ) 1 + sCR2
(9)
SOON-JYH CHANG, CHUNG-LEN LEE AND JWU E. CHEN
642
C R2 R1
VIN
(b)
VOUT
R1 = R2 = 2MΩ, C = 100pF
(c)
(a)
(d)
Vin
Vin Out_normal
(e)
Out_Faulty
Out_normal
(f)
Out_Faulty
Fig. 2. (a) A low pass filter circuit example; (b) the sensitivity of voltage gain w.r.t. frequency; (c) its a.c. input-output transfer function; and (d) its signature observability curve; (e) the output response for a 100KHz, 1-volt sinusoidal input, which is chosen by only considering the maximum sensitivity; (f) the output response for a 796, 1-volt sinusoidal input, which is chosen by considering the maximum signature observability.
It is assumed that the observed signature is the amplitude of the output signal with a 1-volt sinusoidal signal applied at the input with a variable frequency, and that the parameter to be tested is capacitor C. By definition, the sensitivity of the observed signature, i.e., the amplitude of the output, y, w.r.t. the parameter C, is S Cy =
∂y y − j ( 2 × 10 −4 ) × 2πf . = ∂C C 1 + j ( 2 × 10 −4 ) × 2πf
(10)
Fig. 2(b) shows the curve of Eq. (10). According to this figure, a signal with a high frequency is better for testing the fault. However, when we consider the input-output
TEST GENERATION FOR ANALOG CIRCUITS
643
transfer factor, which is shown in Fig. 2(c), we find that the output amplitude is nearly zero for this circuit if a high frequency signal is chosen as the test signal. That is, it is not sufficient for selecting the test signal if only sensitivity is considered! Hence, to generate the optimum input stimulus, we define “signature observability” in the following. Definitions: (a) The signature sensitivity of a parameter pi for the observed signature yj(x) is denoted as S pij ( x ) = y
∂y j ( x ) y j (x ) ∂pi p i
(11a)
.
(b) The input-output transfer factor, IOTF, is defined as the ratio of the observed signature yj(x) with respect to input stimulus In(x) and is represented as IOTF j ( x) =
y j (x ) In( x )
(11b)
.
(c) The signature observability of the observed signature yj(x) with respect to parameter pi is defined as the product of the fault sensitivity and the input-output transfer factor, and is denoted as FOi j ( x) = S pij ( x )× IOTF j (x ) = y
∂y j ( x ) ∂pi
×
pi , In( x )
(11c)
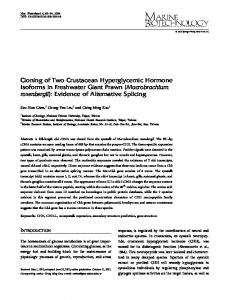
where x is the variable to be decided for the input, e.g., the test frequency of an input with constant amplitude. The optimal x should be the one which maximizes the absolute value of the signature observability. As shown in Fig. 2(d), the test frequency for the capacitor C deviation fault should be the medium frequency: 796 (Hz). For a fault where C = 100 (pF) deviates to C = 50 (pF), Fig. 2(e) shows the output response for a 1-V, 100K (Hz) sinusoidal input, which is chosen by only considering the maximum sensitivity in Fig. 2(b). The output amplitude is almost zero and hard to observe for both normal and faulty circuits; i.e., the faulty effect can not be observed. On the other hand, the output response for a 1-V, 796 (Hz) sinusoidal input signal, which is chosen by considering the maximum signature observability in Fig. 2(d), is shown in Fig. 2(f). An approximately 187 (mV) difference in the amplitude between the normal and faulty circuit is observed. 3.2 Test Generation under the Non-Monotonic Signature-Parameter Relationship As mentioned previously, the relationships between signatures and parameters are not always monotonic, owning to the diverse nature of analog circuits. Fig. 3 shows a case where an observed signature has a non-monotonic relationship with respect to a parameter. In this case, it is difficult to determine the pass/fail ranges of the observed signature by projecting the “pass/fail” tolerance bounds of the parameter via the relationship curve. For example, as shown in Fig. 3(a), if a value y1 of the signature is observed dur-
SOON-JYH CHANG, CHUNG-LEN LEE AND JWU E. CHEN
644
ing testing, it is difficult to determine whether the corresponding target test parameter p is good or not since there are two values, p1 and p2, where p1 is located in the acceptable (pass) region, but p2 is in the region unacceptable (fail) region, corresponding to the observed signature value. In this case, there is an uncertain region on observed signature y. This uncertain region is not caused by the process fluctuation, as described in the last subsection, but results simply from the non-monotonic relationship between the observed signature and the target test parameter. Signature
Signature
Pass Fail
p1
UB
Pass
Fail
Fail
LB
Pass
y1
p2 Fail
Parameter
Fail
Pass
(a)
Fail
Parameter
(b) Signature
Signature
Pass
Pass
Fail
Fail Fail
Pass
(c)
Fail
Parameter
Fail
Pass
Fail
Parameter
(d)
Fig. 3. (a) The non-monotonic relationship between the signature y and the parameter p, where y has an uncertain region since the corresponding p has two values: one is in the “pass” region, and, one is in the “fail” region; (b) the uncertain region in y is eliminated if a test stimulus of the generated frequency is applied; (c) the uncertain region of (a) is expanded when the process fluctuation is considered; and (d) the uncertain region due to the process fluctuation that occurs when the generated test stimulus is applied.
Hence, in the non-monotonic specification-parameter case, instead of maximizing the signature observability while finding the test frequency as in the previous monotonic case, it is a good ides to find the test frequency that can eliminate this uncertainty region as shown in Fig. 3(b). This will be explained in the following.
TEST GENERATION FOR ANALOG CIRCUITS
|H(f)|
pi increase
pi=UB
pi=normal
y0 yLB yUB
|H(f)| pi decrease y0 pi=LB
fc
645
yLB yUB
Frequency
LB
normal
pi decrease
(a) |H(f)|
pi=normal
y0 yi
pi decrease
Frequency
y0 yi
LB
normal
pi decrease
(c)
pi increase
|H(f)|
pi=LB
fi
pi
(b)
pi increase
pi=UB
UB
UB
pi
pi increase
(d)
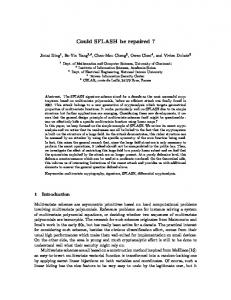
Fig. 4. (a) The a.c. transfer curves of a low pass circuit when the parameter pi is equal to normal, UB and LB values, respectively, and the cutoff frequency, fc, of the normal transfer curve is chosen as the test frequency; y0, yLB, yUB are the low pass transfer gains of the corresponding curves, respectively; (b) the plot of the output voltage (the signature) w.r.t. the parameter pi when the test frequency fc is applied as the test stimulus; (c)the same a.c. transfer curves as in (a) but the frequency fi is chosen as the test frequency; and (d) the plot of the output voltage w.r.t. the parameter pi when the test frequency fi is applied.
As shown in Fig. 3(a), the existence of an uncertain region is caused by inequality in the observed signature when the parameter is equal to the upper bound (UB) and lower bound (LB) of the pass region under a given test stimulus. In order to eliminate the uncertain region, we must select a test stimulus which generates a “single value” signature when the parameter is equal to its LB and UB respectively. A low pass circuit will be used to illustrate the approach taken to select the test stimulus of a good test frequency. Fig. 4(a) shows the frequency responses of a circuit when its parameter pi is equal to the normal, UB, and LB values respectively. For this circuit, if, for example, the cutoff frequency (fc) of the normal circuit is selected as the test frequency shown in Fig. 4(a), then it will have two different output voltages (yLB and yUB) when parameter pi is equal to LB and UB, respectively. Hence, there will be an uncertain voltage range between yLB and yUB as shown in Fig. 4(b), which plots the relationship between the signature y and parameter pi. However, the uncertain region can be eliminated by choosing a test frequency of fi, which will generate a single value voltage output (yi) for both pi = UB and pi = LB as shown in Fig. 4(c) along with its corresponding y – pi relationship as shown in Fig. 4(d).
SOON-JYH CHANG, CHUNG-LEN LEE AND JWU E. CHEN
646
Mathematically, the test frequency f for parameter pi, denoted as fi, can be obtained by solving y ( f ) p =UB = y ( f ) p = LB . i
(12a)
i
The pass/fail bounds of the observed signature, yi, will be yi = y ( f i ) p =UB = y ( f i ) p = LB . i
(12b)
i
The non-monotonic case occurs most often since a circuit designer usually wishes to optimize his design so that the circuit output will degrade on both sides if the parameter value deviates from its designed one.
4. EXAMPLE AND SIMULATION RESULTS In this section, a continuous-time state-variable filter benchmark circuit [14], as shown in Fig. 5, is used to demonstrate the test generation procedure. R5 R2 C1 R1
C2
Input
R3 R4 HPO BPO
LPO
R7 R6
Fig. 5. The circuit of the benchmark continuous-time state-variable filter.
The transfer function of the band-pass output (BPO) of the circuit is given as VBPO ( s ) =K Vin ( s )
s R3 ⋅ C1 1 K s + s+ Q ⋅ R3 ⋅ C1 R3 ⋅ C1 ⋅ R 4 ⋅ C 2
,
(13)
2
where K stands for the filter gain and Q represents its quality factor. The following values are taken: R1 = R2 = R3 = R4 = R6 = 1 MΩ, C1 = C2 = 200 pF, R6 = 300 KΩ, and R7 = 700 KΩ, and the central frequency for the BPO is 794 (Hz) with a voltage gain equal to 1.11. The operational amplifiers in this circuit are the benchmark operational amplifier of [14]. It is adopted for the purpose of making the study more practical. The specifications of the filter are shown in Table 1.
TEST GENERATION FOR ANALOG CIRCUITS
647
Table 1. Specifications of the filter circuit and their nominal values (NV), lower bounds (LB), and upper bounds (UB). Specifications S1: Gain @ fc S2: Central Frequency (fc) S3: Low Cutoff Frequency S4: High Cutoff Frequency S5: 3dB Bandwidth S6: Quality Factor S7: Gain @ 100Hz S8: Gain @ 700Hz S9: Gain @ 900Hz S10: Gain @ 10KHz
NV 1.11 794 515 1231 716 1.11 0.13 1.07 1.07 0.08
UB 1.3 900 600 1400 1000 1.3 0.2 ∞ ∞ 0.2
LB 1 700 400 1000 500 0.9 0 0.9 0.9 0
For circuit level faults, the number of parameters (R, C, and W/L and VT of each transistor) is 66. It can be shown that the variance of each specification caused by the parameters inside the operational amplifiers is much smaller than that caused by the passive components outside the operational amplifiers since the characteristics of the operational amplifier are insensitive to the device parameters inside the operational amplifier due to the negative feedback configuration [16]. Hence, in this study, only the passive components (R1~R7, C1, C2) outside the operational amplifiers were considered. Through simulation, the bounds of the specifications were mapped to the bounds of the circuit parameters, that is, BF1, BP1, BP2, and BF2, which are shown in Table 2 for 95%, 90% and 50% testing confidence level cases. Table 2. Bounds of the “pass” and “fail” ranges of all parameters under 95%, 90% and 50% TC (units: KΩ for resistors and pF for capacitors). 95% TC
Para.
90% TC
50% TC
BF1
BP1
BP2
BF2
BF1
BP1
BP2
BF2
BF1
BP1
BP2
R1
713
858
1075 1267
729
841
1096 1246
785
785
1171 1171
BF2
R2
733
903
1100 1419
747
868
1130 1378
801
801
1245 1245
R3
777
905
1151 1455
791
891
1183 1421
840
840
1301 1301
R4
731
880
1151 1455
747
862
1183 1421
804
804
1301 1301
R5
735
900
1151 1455
750
868
1183 1421
805
805
1301 1301
R6
224
269
322
382
227
263
329
375
242
242
351
351
R7
551
662
801
954
561
648
817
935
602
602
873
873
C1
153
182
229
288
157
178
236
280
167
167
257
257
C2
146
174
229
288
149
170
236
280
160
160
257
257
The simulated signatures, i.e., the output of the circuit when a 1-V sinusoidal signal at 794Hz (the central frequency) was applied at the input, are plotted in Fig. 6 for all circuit parameters. The curves are plotted in terms of the values of the parameters in scaling factors from 0.5 to 2.0. It is seen that the signatures w.r.t. R1, R6 and R7 are monotonic, and, those with other parameters are non-monotonic.
648
SOON-JYH CHANG, CHUNG-LEN LEE AND JWU E. CHEN
(a)
(b)
Fig. 6. (a) The simulated signatures-to-be-observed (monotonic) for circuit parameters R1, R6, and R7; and (b) the simulated signatures-to-be-observed (non-monotonic) for all the remaining circuit parameters.
For monotonic relationship parameters R1, R6 and R7, we generated the test frequency for testing them based on the signature observability of Eq. (11). Figs. 7(a), (b) and (c) show the sensitivity, the frequency response and the corresponding signature observability curve of the CUT for R1, respectively, where the test frequency was found to be 794Hz, which is obviously different from the frequencies that have the highest sensitivity. Fig. 7(d) shows the output voltage w.r.t. R1 with the generated 794 (Hz) 1-volt sinusoidal signal applied at the input. The pass/fail ranges of the output voltage were obtained by mapping the computed tolerance bounds of R1, listed in Table 2, onto this curve. For example, given a testing confidence level TC = 90%, the tolerance bounds for R1 are BF1 = 0.729(MΩ), BP1 = 0.841(MΩ), BP2 = 1.096(MΩ), and BF2 = 1.246(MΩ), and their corresponding signatures are 1.356(V), 1.243(V), 1.044(V), and 0.955(V), respectively. That is, if the observed signature is between 1.044(V) and 1.243(V), R1 is fault-free; if it is larger than 1.356(V) or smaller than 0.955(V), R1 is faulty; otherwise, it is uncertain whether R1 passes or fails the test.
(a)
(b)
(c)
(d)
Fig. 7. (a) The sensitivity curve w.r.t. R1; (b) the frequency response; (c) the signature observability w.r.t. R1; and (d) the signature obtained w.r.t. R1 at the output under the 1 volt, 794 Hz sinusoidal input. “Pass/fail” bounds and tolerance ranges under TC =90% are marked.
For the non-monotonic relationship parameters R2~R5, C1 and C2, we generated test frequencies for testing them with the aim of reducing the uncertainty. For example,
TEST GENERATION FOR ANALOG CIRCUITS
649
Fig. 8(a) shows a.c. transfer curves when R2 is equal to the bounds of the pass/fail range, i.e., 0.801(MΩ) and 1.245(MΩ), as listed in Table 2 for a given 50% testing confidence level. The intersection point of these two curves implies that BPO has the same voltage gain (1.016) for R2 = 0.801(MΩ) and 1.245(MΩ) at an input test frequency of 670 (Hz). The relationship curve of the BPO output w.r.t. R2 when a 1-volt, 670 (Hz) sinusoidal signal was applied at the input is shown in Fig. 8(b). The pass/fail range of the observed signature can be obtained by projecting the pass/fail tolerance bounds of R2 through the relationship curve. If the observed signature is larger than 1.016(V), then parameter R2 is in its pass range, and the circuit satisfies all the constraints of the specifications. On the other hand, R2 fails the test if the observed signature is smaller than 1.016(V). Furthermore, if we require a 90% testing confidence level, then the tolerance range of the output amplitude is obtained by projecting the tolerance bounds, 0.747(MΩ), 0.868(MΩ), 1.13(MΩ), and 1.378(MΩ), as listed in Table 2, through the relationship curve as shown in Fig. 8(c). If the observed signature is larger than 1.03(V), then parameter R2 is in its pass range and the circuit satisfies all the constraints of the specifications with a TC larger than 90%. Similarly, R1 fails the test with a TC larger than 90% if the observed signature is smaller than 0.992(V). It is noted again that, the uncertain regions of the signatures between the pass and fail ranges result from the 90% testing confidence level requirement.
(a)
(b)
(c) Fig. 8. Test generation for a non- monotonic relationship between the signature (the output voltage under a 1V sinusoidal input) and R2; (a) the a.c. transfer curves for R2 equal to 0.801(MΩ) and 1.245(MΩ); (b) the output voltage w.r.t. R2; and (c) Pass/Fail range determination performed by mapping the tolerance bounds of R2 through the relationship curve for a TC = 90%.
650
SOON-JYH CHANG, CHUNG-LEN LEE AND JWU E. CHEN
5. CONCLUSIONS In this paper, we have presented a structure-based specification-constrained test generation method for analog circuits. The approach starts with derivation of the relationship between the specifications and the device and/or component parameters, and it then considers variations of component parameters due to fabrication process fluctuation by using a statistical model. A testing confidence probability is employed to define upper and lower bounds for the component parameters. The relationship between the observed signature and the parameter may be monotonic or non-monotonic. Signature observability that combines signature sensitivity and input-output transfer factor is used to generate test patterns for monotonic type parameters. For non-monotonic type parameters, test generation with the aim of reducing the degree of misclassification has also been illustrated. Simultaneously, a tolerance range that corresponds to the limitations imposed by the specifications is obtained. A continuous time state-variable filter example circuit has been used to demonstrate the test generation procedure and to show the effectiveness of the generated test frequency in increasing the signature observability and reducing the degree of misclassification of the observed signature.
REFERENCES 1. S. Sen, S. S. Nath, V. N. Malepati, and K. R. Pattipati, “Simulation-based testability analysis and fault diagnosis,” Conference Record of Test Technology and Commercialization, 1996, pp. 136-148. 2. S. J. Tsai, “Test vector generation for linear analog devices,” in Proceeding of International Test Conference, 1991, pp. 592-597. 3. S. J. Chang, C. L. Lee, and J. E. Chen, “Functional test pattern generation for CMOS operational amplifier,” in Proceeding of VLSI Test Symposium, 1997, pp. 267-272. 4. C. Y. Pan and K. T. Cheng, “Test generation for linear, time-invariant analog circuits,” IEEE Transaction on Circuits and Systems II: Analog and Digital Signal Processing, Vol. 46, 1999, pp. 554-564. 5. L. Milor and V. Visvanathan, “Detection of catastrophic faults in analog integrated circuits,” IEEE Transaction on Computer-Aided Design, Vol. 8, 1989, pp. 114-130. 6. N. Nagi, A. Chatterjee, A. Balivada, and J. A. Abraham, “Fault-based automatic test Generator for linear analog circuits,” International Conference on Computer-Aided Design, 1993, pp. 88-91. 7. M. Sachdev and B. Atzema, “Industrial relevance of analog IFA: a fact or fiction,” in Proceeding of IEEE International Test Conference, 1995, pp. 61-70. 8. S. D. Huynh, S. Kim, M. Soma, and J. Zhang, “Automatic analog test signal generation using multifrequency analysis,” IEEE Transactions on Circuits and Systems-II: Analog and Digital Signal Processing, Vol. 46, 1999, pp. 565-576. 9. M. Slamani and B. Kaminska, “Multifrequency analysis of faults in analog circuits,” IEEE Design & Test of Computers, Vol. 12, 1995, pp. 70-80. 10. M. Slamani, B. Kaminska, and G. Quesnel, “An integrated approach for analog circuit testing with a minimum number of detected parameters,” in Proceeding of International Test Conference, 1994, pp. 631-640.
TEST GENERATION FOR ANALOG CIRCUITS
651
11. W. M. Lindermeir, H. E. Graeb, and K. J. Antreich, “Design based analog testing by characteristic observation inference,” in Proceeding of International Conference on Computer Aided Design, 1995, pp. 620-626. 12. P. N. Variyam and A. Chatterjee, “Test generation for comprehensive testing of linear analog circuits using transient response sampling,” International Conference on Computer-Aided Design, 1997, pp. 382-385. 13. P. N. Variyam and A. Chatterjee, “Specification-driven test generation for analog circuits,” IEEE Transactions on Computer-Aided-Design of Integrated Circuits and Systems, Vol. 19, 2000, pp. 1189-1201. 14. B. Kaminska, K. Arabi, I. Bell, P. Goteti, J. L. Huertas, B. Kim, A. Rueda, and M. Soma, “Analog and mixed-signal benchmark circuits - first release,” in Proceeding of International Test Conference, 1997, pp. 183-190. 15. R. R. Boyd, “Tolerance analysis of electronic circuit using mathcad,” CRC Press LLC, 2000. 16. S. J. Chang, C. L. Lee, and J. E. Chen, “Structural fault based specification reduction for testing analog circuits,” Journal of Electronic Testing: Theory and Applications, 2002, pp. 571-581.
Soon-Jyh Chang (張順志) was born in Taiwan 1969. He received his M.S. degree in Electronic Engineering from National Chiao-Tung University, Hsin-Chu, Taiwan, in 1996. He is currently working towards his Ph.D. degree at NCTU. His research interests including test generation and design for testability for analog and mixed-signal circuits.
Chung-Len Lee (李崇仁) received BS degree in electrical engineering from National Taiwan University, Taiwan, R.O.C., in 1968. He obtained his M.S. and Ph.D. Degree in Electrical Engineering, Carnegie-Mellon University, U.S.A., in 1971 and 1975 respectively. He has been with Department of Electronics Engineering, National Chiao-Tung University since 1975, engaging in teaching and research in the fields of semiconductor devices, integrated circuits, VLSI, computer aided design and testing. He has supervised over 100 M.S. and Ph.D. students to complete their thesis and has published over 200 papers in the above areas. He has been involved in various technical activities in the above areas in Taiwan as well as in Asia. He is a senior member of IEEE and a member of editorial board, Journal of Electronic Testing, Theory, and Application.
Jwu E Chen (陳竹一) received his BS, MS, and Ph.D. degrees in Electronic Engineering from National Chiao-Tung University, Taiwan, in 1984, 1986 and 1990, respectively. Presently, he is an associate professor of Electrical Engineering of Chung-Hua University, Taiwan. His research interests are in reliability, fault tolerant and test quality of circuits.