Exploiting Cloud Heterogeneity for Optimized Cost/Performance MapReduce Processing Zhuoyao Zhang
Ludmila Cherkasova
Boon Thau Loo
University of Pennsylvania, USA
Hewlett-Packard Labs, USA
University of Pennsylvania, USA
[email protected]
[email protected]
[email protected]
Categories and Subject Descriptors: C.4 [Performance of Systems], C.2.4 [Cloud Computing]. Keywords: MapReduce, Amazon EC2, performance.
1.
Introduction
Many companies are exploiting the use of MapReduce [2] and its open-source implementation Hadoop for large-scale, data intensive processing. However, setting up a dedicated Hadoop cluster requires investing in the new infrastructure, training new personnel, etc., that can be difficult to justify. 1 This work was originated during Z. Zhang’s internship at HP Labs. Prof. B. T. Loo a
nd Z. Zhang are supported in part by NSF grants CNS-1117185 and CNS-0845552. Permission to make digital or hard copies of all or part of this work for personal or classroom use is granted without fee provided that copies are not made or distributed for profit or commercial advantage and that copies bear this notice and the full citation on the first page. Copyrights for components of this work owned by others than ACM must be honored. Abstracting with credit is permitted. To copy otherwise, or republish, to post on servers or to redistribute to lists, requires prior specific permission and/or a fee. Request permissions from
[email protected]. CloudDP’14, April 13, 2014, Amsterdam, the Netherlands. c 2014 ACM 978-1-4503-2714-5/14/04. . . $15.00. Copyright http://dx.doi.org/10.1145/2592784.2592785
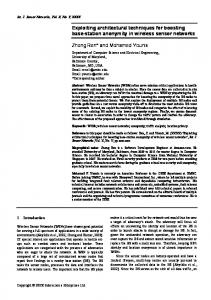
Cloud computing offers a compelling, cost-efficient option that allows users to rent resources in a “pay-per-use” manner. For many users this creates an attractive and affordable alternative compared to acquiring their own infrastructure. A typical cloud environment provides a selection of different capacity Virtual Machines for deployment at different prices per time unit. For example, the Amazon EC2 platform offers a choice of small, medium, and large VM instances, where the CPU and RAM capacity of a medium VM instance is two times larger than the capacity of a small VM instance, and the CPU and RAM capacity of a large VM instance is two times larger than the capacity of a medium VM instance. This resource difference is also reflected in the price: the large instance is twice (four times) more expensive compared with the medium (small) VM instance. Therefore, a user is facing a variety of platform and configuration choices that can be obtained for the same cost. To demonstrate the challenges in making an optimized platform choice we performed a set of experiments with two popular applications TeraSort and KMeans2 on three Hadoop clusters deployed with different type VM instances: • 40 small VMs, each configured with 1 map and 1 reduce slot; • 20 medium VMs, each configured with 2 map and 2 reduce slots, and • 10 large VMs, each configured with 4 map and 4 reduce slots. Therefore, the three Hadoop clusters can be obtained for the same price per time and have the same number of map and reduce slots for processing (where each slot is provisioned with the same CPU and RAM capacities). Figure 1 shows the summary of our experiments with TeraSort and KMeans. 6 5 4 3 2 1 0
small
medium
large
Normalized Job Completion Time
Cloud computing enables a user to quickly provision any size Hadoop cluster, execute a given MapReduce workload, and then pay for the time the resources were used. Typically, there is a choice of different types of VM instances in the Cloud (e.g., small, medium, or large EC2 instances). The capacity differences of the offered VMs are reflected in VM’s pricing. Therefore, for the same price a user can get a variety of Hadoop clusters based on different VM instance types. We observe that performance of MapReduce applications may vary significantly on different platforms. This makes a selection of the best cost/performance platform for a given workload a non-trivial problem, especially when different jobs exhibit different platform preferences. In this work, 1 we aim to solve the following problem: given a completion time target for a set of MapReduce jobs, determine a homogeneous or heterogeneous Hadoop cluster configuration (i.e., the number, types of VMs, and the job schedule) for processing these jobs within a given deadline while minimizing the rented infrastructure cost. We offer a simulation-based framework for solving this problem. Our evaluation study and experiments with Amazon EC2 platform reveal that for different workload mixes, an optimized platform choice may result in 41-67% cost savings for achieving the same performance objectives when using different (but seemingly equivalent) choices. Moreover, depending on a workload the heterogeneous cluster solution may outperform the homogeneous one by 26-42%. The results of our simulation study are validated through experiments with Hadoop clusters deployed on Amazon EC2 instances.
Normalized Job Completion Time
Abstract
3 2.5 2 1.5 1 0.5 0
(a) TeraSort
small
medium
large
(b) KMeans
Figure 1. Normalized completion time of two applications executed on different type EC2 instances.
Apparently, the Hadoop cluster with 40 small VMs provides the best completion time for a TeraSort application as 2 In this work, we use a set of 13 applications released by the Tarazu project [1] with
TeraSort and KMeans among them. Table 2 in Section 4 provides application details and corresponding job settings (the number of map/reduce tasks, datasets sizes, etc.)
shown in Figure 1 (a). The completion time of TeraSort on the cluster with small VMs is 5.5 (2.3) times better than on the cluster with large (medium) VMs. As a result it also has the lowest monetary cost. By contrast, the Hadoop cluster with 10 large VMs is the best option for KMeans as shown in Figure 1 (b). It outperforms the Hadoop cluster with small VMs by 2.6 times when processing KMeans. It demonstrates that seemingly equivalent platform choices for a Hadoop cluster in the Cloud might result in a different application performance and a different provisioning cost. In our earlier work [11], we designed a framework for platform selection of a single homogeneous Hadoop cluster. However, if a given set of jobs has the applications with different platform preferences then a heterogeneous solution (that combines Hadoop clusters deployed with different instance types) might be a better choice. In this work, we offer a framework for solving the following problem: for a given set of MapReduce jobs, determine a Hadoop cluster(s) configuration (i.e., the number and types of VMs, and the job schedule) for processing these jobs within a given deadline while minimizing the rented infrastructure cost. We introduce an application preference ranking to reflect the “strength” of application preference between different VM types and the possible impact on the provisioning cost. This preference ranking guides the construction of a heterogeneous solution. In the designed simulation-based framework, we collect jobs’ profiles from a given set, create an optimized job schedule that minimizes jobs’ makespan (as a function of job profiles and a cluster size), and then obtain the accurate estimates of the achievable makespan by replaying jobs’ traces in the simulator. Based on the cost of the best homogeneous Hadoop cluster, we provide a quick walk through a set of heterogeneous solutions (and corresponding jobs’ partitioning into different pools) to see whether there is a heterogeneous solution that can process given jobs within a deadline but at a smaller cost. In our performance study, we use a set of 13 diverse MapReduce applications for creating three different workloads. Our experiments with Amazon EC2 platform reveal that for different workloads an optimized platform choice may result in 41-67% cost savings for achieving the same performance objectives when using different (but seemingly equivalent) choices. Moreover, depending on a workload the heterogeneous solution may outperform the homogeneous one by 26-42%. The remainder of the paper presents our results in more detail.
2.
Building Blocks
In this section, we outline our approach and explain details of the building blocks used in our solution: i) collected job traces and job profiles; ii) an optimized job schedule to minimize the jobs’ execution makespan; iii) the MapReduce simulator to replay the job traces according to the generated job execution order for obtaining the accurate estimates of the performance and cost values. 1) Job Traces and Profiles: In summary, the MapReduce job execution is comprised of two stages: map stage and
reduce stage. The map stage is partitioned into map tasks and the reduce stage is partitioned into reduce tasks, and they are distributed and executed across multiple machines. We use the past job run(s) for creating the job traces that contain recorded durations of all processed map and reduce tasks3 . A similar job trace can be extracted from the Hadoop job tracker logs using tools such as Apache Rumen The obtained map/reduce task distributions can be used for extracting the distribution parameters and generating scaled traces, i.e., generating the replayable traces of the job execution on the large dataset from the sample job execution on the smaller dataset as described in [7]. These job traces can be replayed using a MapReduce simulator [6] and used for creating the compact job profile for analytic models. The compact job profile contains the average and maximum durations of both map and reduce tasks and it is used in the boundsbased analytical model [8] for predicting the job completion time as well as the duration of map and reduce stages of a given job as a function of allocated resources. In particular, we apply this analytic model in the process of building an optimized job schedule. 2) An Optimized Job Schedule: It was observed [9, 12] that for a set of MapReduce jobs (with no data dependencies between them) the order in which jobs are executed might have a significant impact on the overall processing time, and therefore, on the cost of the rented Hadoop cluster. For dataindependent jobs, once the first job completes its map stage and begins the reduce stage, the next job can start executing its map stage with the released map resources in a pipelined fashion. There is an “overlap” in executions of map stage of the next job and the reduce stage of the previous one. As an illustration, let us consider two MapReduce jobs that have the following map and reduce stage durations: • Job J1 has a map stage duration of J1M = 10s and the reduce stage duration of J1R = 1s. • Job J2 has a map stage duration of J2M = 1s and the reduce stage duration of J2R = 10s. There are two possible executions shown in Figure 2: J1M=10s J1
J1R=1s J2M=1s
J2R=10s
J2
(a) J1 is followed by J2 . J2M=1s
J2R=10s J2 J1M=10s
J1R=1s
J1
(b) J2 is followed by J1 .
Figure 2. Impact of the job schedule on their completion time. • J1 is followed by J2 shown in Figure 2(a). The reduce
stage of J1 overlaps with the map stage of J2 leading to overlap of only 1s. The total completion time of processing two jobs is 10s + 1s + 10s = 21s. 3 The shuffle stage is included in the reduce task. For a first shuffle phase that over-
laps with the entire map phase, only a complementary (non-overlapping) portion is included in the reduce task.
• J2 is followed by J1 shown in Figure 2(b). The reduce
Algorithm 1 Provisioning Solution: Homogeneous Cluster
stage of J2 overlaps with the map stage of J1 leading to a much better pipelined execution and a larger overlap of 10s. The total makespan is 1s + 10s + 1s = 12s. There is a significant difference in the job completion time (75% in the example above) depending on the execution order of the jobs. Since in this work we consider a problem of minimizing the cost of rented Hadoop cluster and the job execution time directly impacts this cost, we aim to generate the job executions order that minimizes the jobs’ makespan. Thus, let J = {J1 , J2 , . . . , Jn } be a set of n MapReduce jobs with no data dependencies between them. For minimizing the makespan of a given set of MapReduce jobs J = {J1 , J2 , . . . , Jn } we apply the classic Johnson algorithm [3] that was proposed for building an optimal job schedule in two-stage production systems. Johnson’s schedule can be efficiently applied to minimizing the makespan of MapReduce jobs as it was shown in [9]. 3) MapReduce Simulator: Since the users rent Cloud resources in a “pay-per-use” fashion, it is important to accurately estimate the execution time of a given set of jobs according to a generated Johnson schedule on a Hadoop cluster of a given size. In this work, we use the enhanced version of MapReduce simulator SimMR [6]. This simulator can accurately replay the job traces and reproduce the original job processing: the completion times of the simulated jobs are within 5% of the original ones as shown in [6]. SimMR is a very fast simulator: it can process over 1 Million events per second. Therefore, we can quickly explore the entire solution space (in brute-force search manner).
Input: W = {J1 , J2 , ...Jn } ← workload with job traces and profiles; type ← VM instance type, e.g., type∈ {small, medium, large}; type Nmax ← the maximum number of instances to rent; P ricetype ← unite price of a type VM instance; D ← a given time deadline for processing W. Output: N type ← an optimized cluster size with VM type instances; min costtype ← the minimal monetary cost for processing W.
3.
Simulation-Based Framework for a Hadoop Cluster Platform Selection
In this section, we first describe how to provision the costefficient homogeneous cluster and then discuss challenges and our approach for offering the heterogeneous solution. 3.1 Homogeneous Cluster Solution In this work, we consider the following problem: Given a workload W = {J1 , J2 , . . . , Jn } to be processed within deadline D, determine a Hadoop cluster configuration (i.e., the number and types of VM instances, and the job schedule) for processing these jobs within a given deadline while minimizing the monetary cost for rented infrastructure. Our solution is based on a simulation framework: in a brute-force manner, it searches through the entire solution space by exhaustively enumerating all possible candidates for the solution and checking whether each candidate satisfies the required problem’s statement. Typically, the solution space is bounded by the budget B, which a customer intends to spend. Assume that given jobs should be processed within deadline D and let P ricetype be the price of a type VM intype stance per time unit. Then the customer can rent Nmax of VMs instances of a given type: type Nmax = B/(D · P ricetype ) (1) Algorithm 1 shows the pseudo code to determine the size of a cluster which is based on the type VM instances and which results in the minimal monetary cost.
1: min costtype ← ∞ type 2: for k ← 1 to Nmax do 3: // Simulate completion time for processing workload W in
a Hadoop cluster with k VMs 4: Cur CT = Simulate(type, k, W) 5: // Calculate the corresponding monetary cost 6: cost = P ricetype × (k + 1) × Cur CT 7: if Cur CT ≤ D & cost < min costtype then 8: min costtype ← cost, N type ← k 9: end if 10: end for
The algorithm iterates through the increasing number of instances for a Hadoop cluster. It simulates the completion time of workload W processed with Johnson’s schedule on a given size cluster and computes the corresponding cost (lines 2-6). Note, that k defines the number of worker nodes in the cluster. The overall Hadoop cluster size is k + 1 nodes (we add a dedicated node for Job Tracker and Name Node, which is included in the cost). The min costtype keeps track of a minimal cost so far (lines 7-8) for a Hadoop cluster which can process W within deadline D. We apply Algorithm 1 to different types of VM instances, e.g., small, medium, and large respectively. Then we compare the produced outcomes to make a final decision. 3.2 Heterogeneous Cluster(s) Solution The application platform preference often depends on the size of a Hadoop cluster and given performance goals. Continuing the motivating example from Section 1, Figure 3 shows the trade-off curves for three representative applications TeraSort, Kmeans, and AdjList4 obtained as a result of exhaustive simulation of application completion times on different size Hadoop clusters. The Y-axis represents the job completion time while the X-axis shows the corresponding monetary cost. Each figure shows three curves for application processing by a homogeneous Hadoop cluster based on small, medium, and large VM instances respectively. First of all, the same application can result in different completion times when being processed on the same platform at the same cost. This reflects an interesting phenomenon of “pay-per-use” model. There are situations when a cluster of size N processes a job in T time units, while a cluster of size 2 · N may process the same job in T /2 time units. Interestingly, these two different size clusters have the same cost, and if the purpose is meeting deadline D where T ≤ D then both clusters meet the performance objective. 4 Table 2 in Section 4 provides details about these applications and their job settings.
15000
10000
5000
0
2
4
cost ($) (a) TeraSort
6
8
small medium large
300000
Job Completion Time (s)
20000
0
80000
350000
small medium large
Job Completion Time (s)
Job Completion Time (s)
25000
250000 200000 150000 100000 50000 0
10
0
10
20
30
40
cost ($) (b) Kmeans
50
small medium large
70000 60000 50000 40000 30000 20000 10000 0
0
2
4
6
cost ($) (c) AdjList
8
10
12
Figure 3. Performance versus cost trade-offs for different applications. Second, we can see an orthogonal observation: in many cases, the same completion time can be achieved at a different cost (on the same platform type). Typically, this corresponds to the case when an increased size Hadoop cluster does not further improve the job processing time. Finally, according to Figure 3, we can see that for TeraSort, the small instances result in the best choice, while for Kmeans the large instances represent the most cost-efficient platform. However, the optimal choice for AdjList is not very clear: it depends on the deadline requirements because the trade-off curves are so close to each other. Another important point is that the cost savings vary across different applications, e.g., the execution of Kmeans on large VM instances leads to higher cost savings than the execution of TeraSort on small VMs. Thus, if we would like to partition a given workload W = {J1 , J2 , ...Jn } into two groups of applications each to be executed by a Hadoop cluster based on different type VM instances, we need to be able to rank these application with respect to their preference “strength” between two considered platforms. In this work, we consider a heterogeneous solution that consists of two homogeneous Hadoop sub-clusters deployed with different type VM instances5 . As an example, we consider a heterogeneous solution formed by small (S) and large (L) VM instances. To measure the “strength” of application preference between two different VM types we introduce an application preference score P ScoreS−L defined as a difference between the normalized costs of simulated cost/performance curves (such as shown in Figure 3): P P Score
S−L
=
S 1≤i≤Nmax
S Nmax
CostS i
P −
L 1≤i≤Nmax
L Nmax
CostL i
• The number of instances for each sub-cluster (i.e., the
number of worker nodes plus a dedicated node to host JobTracker and Name Node for each sub-cluster). • The subset of jobs to be executed on each cluster. Algorithm 2 shows a pseudo code of our heterogeneous solution. For a presentation simplicity, we outline a heterogeneous solution with small and large VM instances. Algorithm 2 Provisioning Solution: Heterogeneous Clusters Input: W = {J1 , J2 , ...Jn } ← workload with jobs sorted in ascending order by their preference score P ScoreS−L ; D ← a given time deadline for processing W. Output: N S ← number of small instances; N L ← number of large instances; W S ← Jobs to be executed on small instance-based cluster; W L ← Jobs to be executed on large instance-based cluster; min costS+L ← the minimal cost of heterogeneous clusters. 1: min costS+L ← ∞ 2: for split ← 1 to n − 1 do 3: // Partition workload W into 2 groups 4: JobsS ← J1 , ..., Jsplit 5: JobsL ← Jsplit+1 , ..., Jn 6: 7: 8: 9: 10: 11: 12: 13: 14:
(N˜S , min costS ) = Algorithm1(JobsS , small, D) (N˜L , min costL ) = Algorithm1(JobsL , large, D) total cost ← min costS + min costL if total cost < min costS+L then min costS+L ← total cost W S ← JobsS , W L ← JobsL N S ← N˜S , N L ← N˜L end if end for
(2)
S L where Nmax and Nmax are defined by Eq. 1 for Hadoop clusters with small and large VM type instances respectively. P ScoreS−L value indicates a possible impact on the provisioning cost, i.e, a large negative (positive) value indicates a stronger preference of small (large) VM instances, while values closer to 0 reflect less sensitivity to a platform choice. For an optimized heterogeneous solution, we need to determine the following parameters: 5 The designed framework can be generalized for a larger number of clusters. How-
ever, this might significantly increase the algorithm complexity without adding new performance benefits.
First, we sort the jobs in the ascending order according to their preference ranking P ScoreS−L . Thus the jobs in the beginning of the list have a performance preference for executing on the small instances. Then we split the ordered job list into two subsets: first one to be executed on the cluster with small instances and the other one to be executed on the cluster with large instances (lines 4-5). For each group, we use Algorithm 1 for homogeneous cluster provisioning to determine the optimized size of each sub-cluster that leads to the minimal monetary cost (lines 6-7). We consider all possible splits by iterating through the split point from 1 to
200000
150000
100000
150000
100000
50000
50000
0
200000
heterogeneous small medium large
Makespan (s)
heterogeneous small medium large
Makespan (s)
Makespan (s)
200000
0
20
40
60
cost ($)
80
100
0
150000
100000
50000
0
10
W orkload W1
(a)
heterogeneous small medium large
20
30
40
50
cost ($) Workload W2
(b)
60
70
0
0
10
(c)
20
30
40
50
cost ($) Workload W3
60
70
80
Figure 4. Performance versus cost trade-offs for different workloads. the total number of jobs N and use a variable min costS+L to keep track of the found minimal total cost, i.e, the sum of costs from both sub-clusters (lines 9-12).
4.
Evaluation
In our experiments, we use the Amazon EC2 platform. Table 1 provides descriptions of VM instance types used in our experiments. We deployed Hadoop clusters that are configured with different number of map and reduce slots per different type VM instances (according to the capacity) as shown in Table 1. Each VM instance is deployed with 100GB of Elastic Block Storage (EBS). We use Hadoop 1.0.0 in all the experiments. The file system blocksize is set to 64MB and the replication level is set to 3. Instance type Small, m1.small Medium, m1.medium Large, m1.large
price $0.06 ph $0.12 ph $0.24 ph
CPU capacity (relative) 1 EC2 Compute Unit (1 virtual core with 1 EC2 Compute Unit) 2 EC2 Compute Unit (1 virtual core with 2 EC2 Compute Units) 4 EC2 Compute Units (2 virtual cores with 2 EC2 Compute Units)
RAM (GB) 1.7
#m,r slots 1, 1
3.75
2, 2
7.5
4, 4
Table 1. EC2 Testbed description. In the performance study, we use a set of 13 applications released by the Tarazu project [1]. Table 2 provides a highlevel summary of the applications with the corresponding job settings (e.g., the number of map/reduce tasks). Applications 1, 8, and 9 process synthetically generated data. Applications 2 to 7 use the Wikipedia articles dataset as input. Applications 10 to 13 use the Netflix movie ratings dataset. These applications perform very different data manipulations, which result in different resource requirements. Application 1. TeraSort 2. WordCount 3. Grep 4. InvIndex 5. RankInvIndex 6. TermVector 7. SeqCount 8. SelfJoin 9. AdjList 10. HistMovies 11. HistRatings 12. Classification 13. KMeans
Input data (type) Synthetic Wikipedia Wikipedia Wikipedia Wikipedia Wikipedia Wikipedia Synthetic Synthetic Netflix Netflix Netflix Netflix
Input data size (GB) 31 50 50 50 46 50 50 28 28 27 27 27 27
#map,red tasks 495, 240 788, 240 788, 1 788, 240 745, 240 788, 240 788, 240 448, 240 508, 240 428, 1 428, 1 428, 50 428, 50
P ScoreS−L -3.74 -5.96 -3.30 -7.90 -5.13 3.11 -4.23 -5.41 -0.7 -1.64 -2.53 19.59 18.6
Table 2. Application characteristics. The application preference score P ScoreS−L is shown in the last column. A positive value (e.g, Kmeans, Classifi-
cation) indicates that the application is more cost-efficient on large VMs, while a negative value (e.g., TeraSort, Wordcount) means that the application favors small VM instances. The absolute score value is indicative of the preference “strength”. When the preference score is close to 0 (e.g., Adjlist), it means that the application does not have a clear preference between the instance types. We create three different workloads described as follows: • W1 – it contains all 13 applications shown in Table 2. • W2 – it contains 11 applications: 1-11, i.e., excluding KMeans and Classification from the application set. • W3 – it contains 12 applications: 1-12, i.e., excluding KMeans from the application set. Figure 4 shows the simulated cost/performance trade-off curves for three workloads executed on both homogeneous and heterogeneous Hadoop cluster(s). For homogeneous provisioning, we show three trade-off curves for Hadoop clusters based on small, medium and large VM instances. Figure 4 (a) shows that workload W1 is more costefficient when executed on the Hadoop cluster with large VMs (among the homogeneous clusters). Such results can be expected because W1 contains both KMeans and Classification that have very strong preference towards large VM instances (see their high positive P ScoreS−L ). In comparison, W2 contains applications that mostly favor the small VM instances, and as a result, the most efficient trade-off curve belongs to a Hadoop cluster based on the small VM instances. Finally, W3 represents a mixed case: it has Classification application that strongly favors large VM instances while most of the remaining applications prefer small VM instances. Figure 4(c) shows that a choice of the best homogeneous platform depends on the workload performance objectives (i.e., deadline D). The yellow dots in Figure 4 represent the completion time and monetary cost when we exploit a heterogeneous provisioning case. Each point corresponds to a workload split into two subsets that are executed on the Hadoop cluster formed with small and large VM instances respectively. To evaluate the efficiency of our provisioning algorithms, we consider the following deadlines for each workload: • D= 20000 seconds for workload W1; • D= 10000 seconds for workload W2; • D= 15000 seconds for workload W3.
Tables 3-5 present the provisioning results for each workload with homogeneous and heterogeneous Hadoop clusters that have minimal monetary costs while meeting the given workload deadlines. Cluster type small (homogeneous) medium (homogeneous) large (homogeneous) small+large heterogeneous
Number of Instances 210 105 39 48 small + 20 large
Completion Time (sec) 15763 15137 12323 14988
Monetary Cost ($) 55.43 53.48 32.86 24.21
Table 3. Cluster provisioning results for workload W1. Cluster type small (homogeneous) medium (homogeneous) large (homogeneous) small+large heterogeneous
Number of Instances 87 43 49 76 small + 21 large
Completion Time (sec) 7283 9603 9893 6763
Monetary Cost ($) 10.68 14.08 32.98 14.71
Table 4. Cluster provisioning results for workload W2. Cluster type small (homogeneous) medium (homogeneous) large (homogeneous) small+large heterogeneous
Number of Instances 140 70 36 74 small + 15 large
Completion Time (sec) 13775 13118 13265 10130
Monetary Cost ($) 32.37 31.05 32.72 18.0
Table 5. Cluster provisioning results for workload W3. The best heterogeneous solution for each workload is shown in the last row in Tables 3-5. For W1, the minimal cost of the heterogeneous solution is 26% improvement compared to the minimal cost of the homogeneous solution based on the large VM instances. The cost benefits of the heterogeneous solution is even more significant for W3: it leads to cost savings of 42% compared to the minimal cost of the homogeneous solution. However, for workload W2, the heterogeneous solution does not provide additional cost benefits. One important reason is that for a heterogeneous solution, we need to maintain additional nodes deployed as JobTracker and NameNode for each sub-cluster. Workload properties play an important role as well. Since W2 workload does not have any applications that have “strong” preference for large VM instances, the introduction of a special sub-cluster with large VM instances is not justified. The results of our simulation study are validated through selected experiments with Hadoop clusters deployed on different Amazon EC2 instances. The simulated results on average are within 10% error (the worst error was 17%) compared to measured results.
5.
Related work
In the past few years, performance modeling and simulation of MapReduce environments has received much attention and different approaches were offered for predicting performance of MapReduce applications. Another group of related work is based on resource management that considers monetary cost and budget constraints. In [5], the authors provide a heuristic to optimize the number of machines for a bag of jobs while minimizing the overall completion time under a given budget. This work assumes the user does not have any knowledge about the job completion time. It starts with a single machine and gradually adds more nodes to the cluster based on the average job
completion time updated every time when a job is finished. In our approach, we use job profiles for optimizing the job schedule and provisioning the cluster. In [10], the authors design a budget-driven scheduling algorithm for iterative MapReduce applications in the heterogeneous cloud. In our paper, we aim at minimizing the makespan of the set of jobs and design an ensemble of methods and tools to evaluate the job completion times as well as their makespan as a function of allocated resources. In [4], Kllapi et al. propose scheduling strategies to optimize performance/cost trade-offs for general data processing workflows in the Cloud. Different machines are modelled as containers with different CPU, memory, and network capacities. The computation workflow contains a set of nodes as operators and edges as data flows. The authors provide a greedy and local search algorithms to schedule operators on different containers so that the optimal performance (cost) is achieved without violating budget or deadline constraints.
6.
Conclusion
In this work, we designed a novel simulation-based framework for evaluating heterogeneous Hadoop solutions to enhance private and public cloud offerings with a cost-efficient, SLO-driven resource provisioning. In our future work, we plan to consider additional SLOs such as fault-tolerance. Intuitively, similar alternatives might have different faulttolerance properties: a failure of a node in a Hadoop cluster deployed with large EC2 instances might have a more severe performance impact compared to a loss of a Hadoop node deployed with small EC2 instances.
References [1] F. Ahmad et al. Tarazu: Optimizing MapReduce on Heterogeneous Clusters. In Proc. of ASPLOS, 2012. [2] J. Dean and S. Ghemawat. MapReduce: Simplified Data Processing on Large Clusters. CACM, 51(1), 2008. [3] S. Johnson. Optimal Two- and Three-Stage Production Schedules with Setup Times Included. Naval Res. Log. Quart.,1954. [4] H. Kllapi et al. Schedule Optimization for Data Processing Flows on the Cloud. In Proc. of the ACM SIGMOD’2011. [5] J. N. Silva et al. Heuristic for Resources Allocation on Utility Computing Infrastructures. In Proc. of MGC’2008 wokshop. [6] A. Verma, L. Cherkasova, and R. H. Campbell. Play It Again, SimMR! In Proc. of Intl. IEEE Cluster, 2011. [7] A. Verma, L. Cherkasova, and R. H. Campbell. Resource Provisioning Framework for MapReduce Jobs with Performance Goals. Proc. of the 12th Middleware Conf., 2011. [8] A. Verma et al. ARIA: Automatic Resource Inference and Allocation for MapReduce Environments. Proc. ICAC’2011. [9] A. Verma et al. Two Sides of a Coin: Optimizing the Schedule of MapReduce Jobs to Minimize Their Makespan and Improve Cluster Performance. Proc. of MASCOTS, 2012. [10] Y. Wang and W. Shi. On Optimal Budget-Driven Scheduling Algorithms for MapReduce Jobs in the Hetereogeneous Cloud. Technical Report TR-13-02, Carleton Univ., 2013. [11] Z. Zhang, L. Cherkasova, and B. T. Loo. Optimizing Cost and Performance Trade-Offs for MapReduce Job Processing in the Cloud. In Proc. of IEEE/IFIP NOMS, May, 2014. [12] Z. Zhang et al. Automated Profiling and Resource Management of Pig Programs for Meeting Service Level Objectives. In Proc. of IEEE/ACM ICAC’2012.