Exploiting Data Mining techniques for improving the efficiency of a Supply Chain Management agent Andreas L. Symeonidis1,2, Vivia Nikolaidou1 and Pericles A. Mitkas1, 2 1
Electrical and Computer Engineering Dept., Aristotle University of Thessaloniki, 54 124, Thessaloniki, Greece 2 Intelligent Systems and Software Engineering Laboratory, Informatics and Telematics Institute/CERTH, 57001, Thessaloniki, Greece
[email protected],
[email protected],
[email protected]
Abstract Supply Chain Management (SCM) environments are often dynamic markets providing a plethora of information, either complete or incomplete. It is, therefore, evident that such environments demand intelligent solutions, which can perceive variations and act in order to achieve maximum revenue. To do so, they must also provide some sophisticated mechanism for exploiting the full potential of the environments they inhabit. Advancing on the way autonomous solutions usually deal with the SCM process, we have built a robust and highly-adaptable mechanism for efficiently dealing with all SCM facets, while at the same time incorporating a module that exploits data mining technology in order to forecast the price of the winning bid in a given order and, thus, adjust its bidding strategy. The paper presents our agent, Mertacor, and focuses on the forecasting mechanism it incorporates, aiming to optimal agent efficiency.
1. Introduction Supply chain management primitives comprise the management of materials, information and finance in a network consisting of suppliers, manufacturers, distributors and customers [1]. Practically, all these activities are intended to deliver the optimal result to the end-user via procurement of raw materials, manufacturing, distribution, and customer services [2]. Nowadays, increasing competition has emphasized the need for more flexible, robust and powerful supply chain management. Managing the supply chain is an extremely complicated task, which requires correct coordination of distributed and heterogeneous information. Resource allocation is crucial to the supply chain's functionality and negotiation and cooperation between the parts of the supply chain are necessary. Multi-agent systems (MAS) can, thus, provide an ideal solution to this problem, since they are designed for distributed problem-solving and negotiating [3]. According to Wu et al. [4], since SCM is fundamentally concerned with coherence among multiple, globally distributed decision makers, a multi-agent modeling framework based on explicit communication
between constituent agents (such as manufacturers, suppliers, retailers and customers) seems very appealing. On the other hand, issues related to supply chain management have been successfully dealt with in the past with the exploitation of Data Mining (DM) techniques. Customer and supplier categorization, market basket analysis, and inventory scheduling are typical problems where DM is applied, to provide efficient solutions. In this context, we introduce a data mining-based mechanism, which enables an agent to successfully improve its bidding strategy when participating in auctioning environments. We have crash-tested our approach in an extremely dynamic and multi-variate environment; the Trading Agent Competition (TAC) SCM game (described in further detail in [5]). In TAC SCM, offering a bid at the optimal price is a crucial point in the game, since it directly affects the agent's profit and ranking. We have carefully selected a combination of DM techniques to extract the appropriate knowledge models, which are used by the agent to predict the winning price of bids. The final ranking of our agent, agent Mertacor, with respect to others indicates that data mining can indeed be used to considerably improve an agent's performance. The rest of the paper is organized as follows: Section 2 provides an overview of the TAC SCM game, while section 3 presents agent Mertacor and briefly discusses its architecture. Section 4 describes analytically the data mining experiments conducted, in order to decide on the best winning bid price model. Finally, section 5 summarizes work conducted and concludes the paper.
2. The SCM TAC game Within the scenario of the TAC SCM game [5], each agent participating represents a PC assembler with limited production capacity. Six such agents compete in selling 16 different types of PCs to potential customers. The agents' task is to negotiate on supply contracts, bid for customer offers, manage daily assembly activities and ship completed offers to customers. Every day, customers send Request-For-Quote (RFQ) messages and agents bid on them, depending on their
ability to satisfy delivery dates and prices. The bid price should not exceed the reserve price the customer requires, which is between 75 − 125% of nominal price of PC components. The next day, the customer sends the order to the agent that has made the winning offer. To get paid, the agent must deliver on time. If it fails in delivering customers orders, it is charged with a penalty. Winner is declared the agent with the greater revenue at the end of the game. Game length is 220 simulated days, with each day lasting 15 seconds.
3. Agent Mertacor May one examine the specifications of the TAC SCM game, he/she may identify four (4) tasks each agent needs to deal with: a. Procurement of hardware components and negotiation on cheap component contracts, b. Management of the inventory and stock requirements, c. Scheduling of the production and delivery process, and d. Bid-ding and negotiation on PC sales to customers. As described in [6], our agent (Mertacor) employs a modular architecture, having one module for each of the aforementioned tasks. The agent provides a wrapper around the modules and ensures communication with customers and suppliers. Mertacor's modular architecture allows us to better manage and efficiently act on each one of these modules, while ensuring smooth cooperation between them. This also provides flexibility and extensibility, making it easy to apply Mertacor's strategy to other real-life SCM environments as well. The four core modules that Mertacor incorporates are: a) the Inventory Module (IM), b) the Procuring Module (PM), c) the Factory Module (FM) and, finally, d) the Bidding Module (BM). IM employs an assemble-to-order (ATO) strategy, which defines the inventory levels that need to be satisfied and below which replenishment is needed. The ATO strategy was selected, since, according to [7], it is the most suitable strategy for environments where replenishment times are larger than assembly times, like in the case of the TAC SCM game. PM uses heuristic techniques to predict future demands and order affordable components in advance, in order to balance the need for cheap component procurement to the running needs of the assembly line. It is split in two phases, initial, where Mertacor attempts to build an initial inventory to start production, and standard, where Mertacor switches to a normal-state procurement strategy. FM is responsible for producing accurate assembly schedules and for providing the bidder with information on the factory production capacity. It realizes a simulation module to create a projection of what the factory should expect in the near future, based on knowledge on future
supplier deliveries, customer deliveries, customer orders, future production and delivery schedules. Finally, BM attempts to predict the winning price of each order. It performs off-line data mining on logs of previously played games and uses the derived models to predict the winning price of each order. Although these models are highly reliable (see analysis in the following section), a fail-safe mechanism has also been incorporated, in case the models prove invalid due to unexpected situations. The knowledge extraction process followed and the results derived are described below.
4. Predicting the winning bid of an order Estimation of the winning price of the bids can be modeled as a regression problem, where the desired output is the agent's bidding price for clients' RFQs and the inputs are the parameters related to the bid that are known to the agent. The initial set of attributes considered are the demand (Total PCs requested each day), the demand in the product's market range, the due date of the order, the reserve price of components, and the maximum and minimum prices of same type PCs sold in the last days (2 previous days for maximum – 4 for minimum). Available data were split into three subsets, each one representing a different market range (LOW – MEDIUM – HIGH), both for the finals and semifinals of the game, resulting to six different datasets (finalsLOW–MEDIUM– HIGH & secondFinalsLOW–MEDIUM–HIGH). In order to experiment on the data with a variety of training techniques and algorithms, the WEKA (Waikato Environment for Knowledge Analysis) suite [8] was used, where a wide range of filters for pre-processing, model evaluation, visualization and post-processing is available.
4.1. Pre-processing The instances within the initial datasets ranged from 45000 to 230000 instances. Analysis was performed on all datasets. Nevertheless, due to space limitation we shall discuss only one case (finalsLOW dataset), while analysis on the other cases was performed in an analogous manner. The initial dataset contained 156228 records of bids. In order to remove redundant information and enable quicker and more accurate training, a number of preprocessing filters were tested against the dataset. In particular, we applied the CfsSubsetEval [9] (evaluates the worth of a subset of attributes by considering the individual predictive ability of each feature along with the degree of redundancy between them), WrapperSubsetEval [10] (evaluates attribute sets by using a learning scheme, e.g. ZeroR), and ReliefFAttributeEval [11] filters (allows various search and evaluation methods to be combined in order to select attribute and attribute subsets) for attribute selection, using the GreedyStepwise and RandomSearch
search methods. The trimmed dataset contained the following attributes as input: the demand, the reserve price for components, the maximum price of same type PCs for the two previous days and the minimum price for the previous day, while price was the output attribute. In order to reduce the number of instances for training, and since the class attribute (price) is numeric, the StratifiedRemoveFolds [12] method (it takes a dataset and outputs a specified fold for cross validation) was selected. Two datasets were finally produced, containing the one third (1/3) and one eighth (1/8) of the initial instances respectively. On these resulting datasets a number of classifiers and meta-classifier schemas were applied. These are discussed below. Correlation Coefficient 0,99 0,98 0,97 0,96 0,95 0,94 Linear
Neural
Support
Regres sion
Networks
Vector
Unsmoothed
Machines
Unpruned
M5'
Relative Absolute Error 20,00 15,00 10,00 5,00 0,00 Linear
Neural
Support Vector
Regress ion
Networks
Machines
M5'
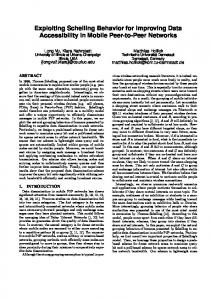
In the case of the M5', however, the derived models’ efficiency was substantially better, having a cc around 0.99 and a RAE of about 10%. Furthermore, when performing data mining on unsmoothed data and producing an unrpruned model, the cc reached 0.9967, while decreasing the RAE to about 4.0112% and keeping a very small value for MAE (9.0825). Figure 1 provides a qualitative comparison between the techniques applied, tested against the same training set and all algorithms' performance, using the same data set of 5 attributes, 1/8 of the initial data set and the same user-supplied test set.
4.3. Meta-classification
1,00
M5'
of Support Vector Machines, performance was comparable to the aforementioned techniques, while execution time was significantly slower.
M5' Unsmoothed Unpruned
Figure 1. Qualitative comparison of the classifiers applied
4.2. Training Four different classification (regression) schemas were applied, in order to decide on the one that optimally meets the problem of predicting the winning bid of an order: a) Linear Regression, b) Neural Networks, c) Support Vector Machines and, finally, d) the M5' algorithm [13]. A number of experiments were conducted applying Linear Regression, on different data sets and with different algorithm parameters. The resulting models’ efficiency did not vary a lot, all having a correlation coefficient (cc) around 0.97 and a Relative Absolute Error (RAE) within the range of 15–20%. Neural Networks performed a bit worse, with the same cc, but with RAE always around 20%. It should be denoted, though, that increasing or decreasing the learning rate did not seem to significantly influence the resulting efficiency, while using different training techniques (either using a training set or n-fold cross-validation) nearly doubled the Mean Absolute Error (MAE), indicating overfitting. In the case
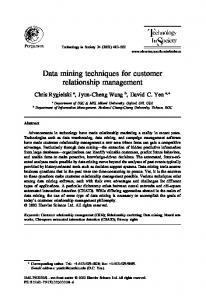
Apart from the classification schemas applied, we also tested some meta-classifier schemas, striving for the optimum performance. The Additive Regression and Bagging [14] schemas were tested against the same datasets and using the same training options, in order to ensure result correctness. The Additive Regression schema was applied using the DecisionStamp (building and using a decision stump), REPTree (fast decision tree learner) and the M5’ classifiers. The first combination performed even worse than the classifier schema alone, having a cc varying from 0.95 to 0.97 and a RAE from 20–25%. Using REPtree with the meta-classifier schema performed significantly better, increasing the cc around 0.99 and decreasing RAE to 5–8%. Nevertheless, M5' once again performed optimally, with the cc reaching the maximum value of 0.9994 and the RAE falling to 0.74%. Bagging was applied using the REPtree and the M5' classifiers. The performance of the first combination was comparable to that of Additive Regression – REPtree combination, with a cc of 0.99 and a RAE slightly above 5% for all experiments. When the M5’ was used with Bagging, the results were better with respect to REPTree (cc: 0.99 – RAE: 9.64), nevertheless did not reach the performance of the Additive Regression – M5’ combination. Figure 2 summarizes the average performance of the Additive Regression and Bagging meta-classifier schemas, with the respective classifier used.
4.4. Results One can easily identify that the combination of the Additive Regression meta-classification schema with the the M5' regression algorithm, applied on unsmoothed data and producing unpruned knowledge models significantly outperforms all other learning methods applied. This
hypothesis was also validated on the rest of the available datasets. The main advantage of M5’ with respect to the other methods applied is that it produced a simple and compact tree model, in contrast to Linear Regression that attempted to impose a linear relationship on the data, Neural Networks that generated a complex model requiring excessive parameter tweaking, and Support Vector Machines, which overcame nonlinearity only in the case the mapping function was known in advance [16]. Combined with Additive Regression, which is an enhancement over Bagging by introducing a stochastic factor [18], M5' succeeded in improving the accuracy of the predictors and achieved optimal performance. 1,01
Correlation Coefficient
1 0,99
TAC SCM competition results proved our approach quite successful, since agent Mertacor placed third among 32 agents from universities and research centers all over the world. Future directions on the coupling of agents and data mining include the application of similar techniques to improve the models used to predict the behavior of both suppliers and customers. Such an improvement is expected to have a direct impact on Mertacor's efficiency.
6. References [1] Stanfield, J. “Agents in Supply Chain Management”, AgentLink News 9, 2002, pp. 11-12. [2] C.-S. Kim, J. Tannock, M. Byrne, R. Farr, B. Cao, and M. Er, Stateof-the-art review: Techniques to model the supply chain in an extended enterprise (VIVACE WP2.5). Nottingham, England: University of Nottingham, Operations Management Division, 2004. [3] Ferber, J., Multi-Agent Systems – An introduction to Distributed Artificial Intelligence, Addison-Wesley, London, 1999.
0,98 0,97 0,96 0,95 0,94 Additive –
Additive –
DecisionStamp
REPTree
Additive – M5' -
Bagging –
Unpruned -
REPTree
Unsmoothed
Bagging – M5' -
[4] J. Wu, M. Ulieru, M. Cobzaru, and D. Norrie, “Supply chain management systems: state of the art and vision”, 9th International Conference on Management of Innovation and Technology IEEE, 2000, pp. 759-764.
Unpruned Unsmoothed
25
Relative Absolute Error 20
[5] Collins, J., R. Arunachalam, N. Sadeh, J. Ericsson, N. Finne, and S. Janson, The Supply Chain Management Game for the 2005 Trading Agent Competition. Technical Report CMU-ISRI-04-139, CMU, 2004. [6] I. Kontogounis, K. Chatzidimitriou, A. Symeonidis, and P.A. Mitkas, “A Robust Agent Design for Dynamic SCM Environments”. LNAI, Vol. 3955, Springer-Verlag, 2006, pp. 127-136.
15 10
[7] Cheng, F., M. Ettl, and G .Lin, Inventory-Service Optimization in Configure-to-Order Systems, Technical Report RC 21781, IBM, 2001.
5 0 Additive –
Additive –
Additive – M5' -
Bagging –
Bagging – M5' -
DecisionStamp
REPTree
Unpruned -
REPTree
Unpruned -
Unsmoothed
Unsmoothed
Figure 2. cc and RAE of the applied meta-classifiers
5. Conclusions Within the context of this paper a successful paradigm of the coupling of Intelligent Agent technology with Data Mining has been presented. By exploiting available data on previous transactions, agent Mertacor succeeded in forecasting the winning price of bids on various customer orders, thus adjusting its bidding strategy, aiming to increase its revenue. The forecasting mechanism was called to solve a regression problem, where the desired output was the agent's bidding price for clients' RFQs and the inputs were parameters related to the bid. Data from the finals and the second finals were used, providing information on eleven (11) –relative to the RFQs– attributes. Following thorough pre-processing, only six (6) attributes were used to train our knowledge models. A number of classification techniques and meta-classifier schemas were tested against all the available (six) datasets, and after exhaustive analysis, the most efficient knowledge model was selected.
[8] Witten, H. Ian, and F. Eibe, Data Mining: Practical Machine Learning Tools and Techniques with Java Implementations, Morgan Kaufmann, New Zealand, 1999. [9] Hall, M. A. Correlation-based Feature Subset Selection for Machine Learning, Thesis submitted in partial fulfilment of the requirements of the degree of Doctor of Philosophy at the University of Waikato, 1998. [10] Kohavi, R., and John G., Wrappers for Feature Subset Selection. Artificial Intelligence journal, special issue on relevance, Vol. 97, Nos 1-2, pp.273-324 [11] Sikonja, M.R, and Kononenko, I. An adaptation of Relief for attribute estimation on regression. Machine Learning, Proceedings of 14th International Conference on Machine Learning D. Fished (ed.), ICML'97, Nashville, TN, 1997. [12] Breiman, L., Friedman, J.H., Olshen, R.A., and Stone, C.J. Classification and Regression Trees. Chapman & Hall, New York, 1984. [13] Wang, Y, and Witten, I. H. Induction of model trees for predicting continuous classes, Proceedings of the poster papers of the European Conference on Machine Learning. University of Economics, Faculty of Informatics and Statistics, Prague, 1997 [14] Friedman, J.H, Stochastic Gradient Boosting, Technical Report Stanford University, 1999