parallel application software is generally recognized as ... in a way that makes sense to the programmer. ... data to the analyst (application programmer); unfor-.
Extensible Parallel Program Performance Visualization Gary J. Nutt Adam J. Griff James E. Mankovich∗ Jeffrey D. McWhirter Department of Computer Science, CB 430 University of Colorado Boulder, CO 80309-0430 Abstract Performance bugs have classically been difficult to identify in high performance programs. The problem arises because there is a broad spectrum of causes of performance degradation, and because it may be necessary to apply specialized diagnostics to search the performance space. The prototype tuning environment we are developing enables one to explore the performance space of a program using customized performance visualization techniques. It addresses the breadth problem by providing tools known to be useful for broad explorations, tools for inspecting specific performance bugs, and an ability to extend the observation platform by custom analysis and visualization. This paper describes the ParaVision tool that enables one to integrate various PICL-based performance tools into a single user environment.
1
Introduction
In contemporary high performance computation, parallel application software is generally recognized as the limiting factor in applying high performance computers. Tuning is a technique that enables a program developer to incrementally increase an existing program’s performance by repeatedly measuring its behavior then modifying the program until the resulting performance is satisfactory (or until the programmer decides that the tuning effort is no longer worthwhile). An environment that supports tuning must be able to provide metrics for different aspects of the program’s execution, to perform a broad range of different analyses on the performance data, and to present the data in a way that makes sense to the programmer. This paper describes research on the part of the problem ∗ Convex
Computer Corporation Visiting Scientist at the University of Colorado
relating to performance data analysis and presentation (although any such research clearly depends on the way performance data are collected and stored). The hypothesis is that programmers can form conjectures regarding a program’s performance more quickly when they are presented with various performance visualizations of the data rather than standardized tabular data (e.g., profiling data). A specific visualization has the property that it tends to condense information into recognizable patterns of shape or color, eliminating or deemphasizing “unimportant” detail by emphasizing “important” aspects of the performance data. In other words, a performance visualization makes certain information more easily recognizable to some people, possibly at the expense of other information. The choice of what is important versus unimportant and recognizable versus unrecognizable is reflected in the nature of the performance visualization. While there may be some aspects of performance that are universally recognizable and important, many other aspects are not, but are important in a specific tuning context for a specific programmer. This argues for systems that support proven performance views as well as for extended, custom views that can be rapidly and easily constructed for the tuning experiments. This paper illustrates how a tuning environment can support a broad set of performance viewing applications whose operation can occur simultaneously and in synchronization with extensible visualization facilities.
2
The Analysis and Visualization System
Ideally, a performance analysis and visualization system should support an arbitrary number of types of views for reporting performance data; it is unlikely that any built-in toolkit of viewing mechanisms will be sufficient for practical use. The performance visu-
alization system must enable its users to create views based on X-Y plots, meters and gauges, call graphs, control flow graphs, architectural block diagrams, and other viewing paradigms unplanned by the tool designer. Not only is it necessary to have alternative views, they must be logically interconnected to provide a custom, yet coordinated observation perspective of the computation. The first rationale for providing full perspectives (as contrasted with a view) is that empirical evidence suggests that the set of coordinated views can provide more information that the sum of the individual views [2]. Each view highlights some particular aspect of the performance data; a set of views enables the programmer to correlate various behaviors in a manner far more sophisticated than algorithmic analysis can be made to do. Second, the perspective can include facilities for correlating cause and effect by having dramatically different views of the computation, e.g., spikes in an X-Y graph may be easy to explain if the programmer can also see the call graph and/or a window with source code. Dynamic observation perspectives imply the existence of a perspective manager that coordinates the perspectives with the performance data (cf. Traceview’s session manager [3]). The perspective manager is the program that reads the measurement data, analyzes the data as required for specific views, creates and destroys views, maintains time consistency among views, and provides a human-computer interface for the programmer while he or she uses a particular observation perspective.
2.1
Implementing Observation Perspectives
Application program performance tools have received considerable attention because of their potential for providing useful assistance to programmers. Researchers have built several tools, environments, and systems for analyzing and presenting performance data to the analyst (application programmer); unfortunately, most such studies are flawed for any of several reasons, including (but not limited to) [6]: • The tools and/or visual reports are not wellconceived. • The tools are too complex for the job at hand. • It is too difficult to learn how to use the tools. • The tools do not address the specific problem at hand.
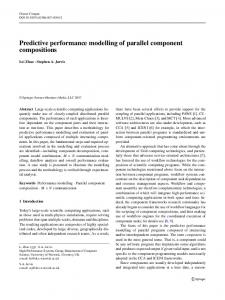
Raw PICL trace
PICL Loader
Loaded PICL
Perspective Manager
Applic Set
Event Demux
ParaVision
Configuration
Application creation
MsgView
PVMSR
ParaGraph
View
View
View
Analyst
Figure 1: The ParaVision Tool • The tools are designed by tool specialists without adequate knowledge of what application developers really need. Many of these problems could be addressed if application programmers were given an adequate environment in which they could easily add familiar tools, or build their own tools (with or without assistance, for reuse or one-time use). Our perspective manager is intended to support extensibility that can empower one to build customized analysis and visualization tools. The perspective manager, called ParaVision, is organized as shown in Figure 1. Source programs are implemented on the PVM platform; this enables us to use built-in instrumentation that produces a relatively widely-used trace format (PICL [1]). We have extended the PVM instrumentation by creating a simple library to produce PICL events by manually inserting calls to the instrumentation routines into the subject source program. At runtime, this results in the creation of a “Raw PICL trace” file that contains PVM-related event occurrences and event occurrences from the manual instrumentation. ParaVision enables an analyst to select performance views as required by running multiple analysis applications, each of which may support multiple views. Further, whenever two or more views are present in a perspective, they reflect the same point in execution time as derived from the trace. ParaVision accomplishes this by controlling multiple, independent applications (e.g., MsgView, PVMSR, ParaGraph, etc. in the figure) each of which is nominally a program that reacts to events from the trace (and presumably provides one or more related views); thus an application is analogous to a Pablo analysis module [5]. The perspective manager also reads events from the trace, then distributes them to applications.
2.2
Trace File Management
PICL trace files traditionally cause difficulty for analysis routines, primarily due to the nature of the instrumentation that is used to create events. The first problem that can occur is that because of clock drift in distributed memory systems, the instrumentation may combine events from different machines in an order that is different from that in which they occurred; specifically, it is possible to encounter receive events with a timestamp that is earlier than its corresponding send event. The second problem is related to cases where “insufficient” state information is recorded with the event record, e.g., a multicast event may not specify the names of the recipients; this means that when an analysis routine encounters a multicast, it cannot represent the corresponding send operations with arcs in a display since it does not know the identity of the head of the arc. Both of these problems can be handled if the tool preprocesses the entire trace before it interprets the events in scaled realtime. ParaVision first loads the entire PICL trace into its virtual memory (see Figure 1); while this is a limitation on the implementation, we rationalize this approach by noting that we are simply taking advantage of the virtual memory mechanism to map file contents into virtual memory. Time anomalies are then handled by adjusting timestamps (implicitly synchronizing the distributed clocks) after the trace is loaded, but prior to trace processing. This typically requires that sends and receives be matched according to the event parameter settings (sender and receiver ID), then adjusted; Mankovich used this technique in Convex’s pvmon3, and we have reused it in ParaVision. In general, instrumentation should produce events that contain enough information to preclude trace lookahead; then very large traces can be handled (forward and backward) with a simple caching scheme. Because the instrumentation we use does not always produce the required information, we currently simulate idealized instrumentation by applying explicit transformations on the loaded trace to either add the desired information to the event or to introduce new pseudo events that distribute the information at the appropriate time. We note that other PICL trace tools often employ the same strategy. Knowing the computation runtime at the time the analysis starts is an example of this approach. Once the trace has been loaded, it is trivial to obtain the total runtime of the execution (by looking at the timestamp on the last event). This information is useful to applications when they wish to normalize times, scale
axis, etc. ParaVision adds a new event to the trace (with a zero timestamp) that passes the total runtime to any application that requests it.
2.3
Application Management
ParaVision can start any application from the application set shown in Figure 1, including applications written explicitly for ParaVision and other generic applications that read PICL traces. The current version of ParaVision uses a static configuration file to identify applications and their required event set; the analyst encodes registration information in the file, then starts ParaVision. A registration entry includes the name of a file containing the executable of the application, the internet address at which the application will be loaded, a count of the number of events to be requested, and a list of symbolic event names (corresponding to names that appear in the PICL trace). The system reads the configuration file, then starts each application in a separate process; the application establishes a socket connection back to ParaVision that will be used to distribute events and to synchronize the application with ParaVision’s operation. ParaVision also builds a data structure to map application instances with the events they require (see below). In the current implementation, application registration is done statically by providing a configuration file to ParaVision. There is no particular barrier to preventing the configuration from being read dynamically from the ParaVision console, i.e., the configurations could change during execution implying that applications come and go, and that event distribution specifications change.
2.4
Distributing Events
After initialization, ParaVision is primarily concerned with managing the analysis time. Analysis time is started at zero, and is incremented in scaled realtime (the scaling factor is a user-defined parameter, and may vary during execution). The event trace is ordered by timestamp; ParaVision extracts events from the trace, then distributes them to applications that requested them (during registration) according to the advancing scaled realtime that it maintains. ParaVision also can be run backwards, i.e., it can distribute events in decreasing time order. (It is the responsibility of each application to handle decreasing time properly, since the management of such a function depends on the nature of the application and its view(s). That is, each application must incorporate its
(a)
(b) Figure 2: PVMSR’s Send-Receive Views
own analysis and display state since ParaVision does not apply any semantics to events. For example, we have constructed applications to produce call graphs and message send-receive displays that can run forward and backward. Multiple copies of the same application can be run with different registration parameters, e.g., running on different machines, or accepting different events. This allows the analyst to see different views of the application execution using the same application. An application can be configured to request that ParaVision send it all events in the trace (as well as the name of the trace file in case the application wishes to make its own copy of the file). This allows one to run standalone PICL trace applications under the synchronization control of ParaVision. Synchronization is accomplished by placing events on the socket according to their timestamp at the rate defined by the scaled realtime of the analysis. Such applications will not necessarily operate correctly when ParaVision distributes events in decreasing timestamp order.
2.5
The Human-Computer Interface
ParaVision provides an environment with several “standard” performance visualization views, tailored views (achieved by adjusting registration parameters), customized extended views, and views implemented by external applications. The ParaVision console is a simple humancomputer interface to enable the analyst to control a session; currently, the interface is a dialog box that reports the current time in the trace; a slider bar to adjust the realtime rate at which the events will be distributed to applications; a button to determine the direction of time movement (and, hence of event re-
trieval from the PICL trace) – forward or backward; and buttons to run, step, and stop the event processing.
3
Creating Extended Views
ParaVision includes some views that we have constructed for our own use (e.g., MessageView and PVMSR in Figure 11 ). It also provides an environment in which one can tailor existing views so that they provide different variants of the same information, in which one can add other applications specifically written for use with ParaVision, and in which generic PICL-based applications can be added with little or no modification (e.g., ParaGraph [2]).
3.1
Tailored Views
Tailored views are created by controlling the set of events distributed to a visualization application. For example, we have built an application that constructs a dynamic view in which a node is created whenever a process is created (see Figure 2(a)); when the process sends a message, the view is changed to show an edge from the sender to a receiver process (the number represents the count of pending messages, and an edge color represents the size of the last message sent); when the message has been received, the count decreases, removing the edge if there are no more mes1 MessageView is an interactive application that creates a default visualization with one horizontal time line for each process and vertically-oriented directed edges to indicate message passing (see Figure 3, below). PVMSR is another view of message passing activity in which nodes are drawn to represent processes and directed edges among the nodes represent pending messages (see Figure 2(a)).
Figure 3: The MessageView Application sages pending. This application can be used without change to simply represent process creation and destruction by changing the event registration. In the original version the application is registered to receive events for process creation/termination, for message send/receive initiation, and for message send/receive completion; in the latter version, only the process creation/termination events are requested (thus no message edges will appear in the view — see Figure 2(b)).
3.2
Building a Custom View
A standard application opens a socket with ParaVision, then repeatedly requests an event on the socket until it receives one. Each PICL event is parsed and analyzed according to the requirements on the performance tools. This means that it is easy to construct applications that accomplish very general event analysis, but it also implies that if event occurrences are related in any particular way (or if the report produced by the application otherwise implies state) then the application must provide facilities to accomplish this. For example, suppose that the instrumentation were designed to produce a create event with parameters identifying the process ID and host name whenever a process is spawned, and another terminate event with a process ID parameter. Then one could write a simple application that requested the two event types, and which simply increased a integer variable for each create event and decreased the variable for each terminate event. The application state is the integer variable (ParaVision has no knowledge of such state). The application could display the variable as a strip chart display of the number of processes in existence versus time; it could simply maintain the variable value and respond to interactive queries from the user or other applications; etc. Provided that state was accurate, it would be easy to write the application
so that it processed traces in reverse — in this case the application does the same thing independent of trace execution direction. The same trace information could be used to construct a more comprehensive view that illustrates the processors involved in the computation along with the number of processes mapped to each processor, details about each process, etc. The analysis is essentially the same as described above, but the visualization and corresponding state are more complex. The MessageView application provides an alternative view of send-receive patterns (see Figure 3). In this case, the application must be sure that each send event is matched by a corresponding receive event according to event parameters identifying the message. The application state is more complex than the first case, and reverse operation would require different processing than forward operation. ParaVision essentially defers reverse execution to the application. In some cases, executing the analysis with decreasing timestamps is easy, while in others it may be very difficult. The PCalls application constructs a conventional procedure call graph, an alternative columnar representation of process-procedure state, a procedure call count histogram, and a text editor window correlated with the selected procedure from the call graph (see Figure 4). PCalls can execute in reverse with no real difficulty since its internal state essentially corresponds to the names of the procedures on the call stack. Conventional performance views are ordinarily intended to be read by the user, but do not necessarily support nontrivial interaction with the analysis program. In the ParaVision environment, it is easy to construct interactive applications, provided that the interactions relate only to the functionality implemented in the application itself (i.e., ParaVision’s API is essentially a one-way interface). Thus an ap-
Figure 4: The PCalls View Set plication can be built to allow the user to interrogate its state in any manner that the application writer chooses. We take advantage of this design in a number of our performance visualization applications. For example, the MessageView application of Figure 3 allows the user to interactively rearrange process lines, to elide call edges from the view, and to change time scales. One can also display detailed information about message passing in an alternate window, including send and receive times and message size. The PCall application provides an even higher degree of human-application interaction; in Figure 4 the text editor can be started from the call graph view or the histogram view by selecting the procedure node or name, respectively. If the application is interactive, then it can be written to accept user input and to adjust the view according to the user’s requests. Because of the separation of the analysis application from the event management, we have found that it is natural and easy to write interactive performance analysis applications. Applications generally provide graphic views of one kind or another. ParaVision makes no provision for graphics, although it is possible to construct applications using any graphics package, including X widgets, Tcl/Tk, etc. We use McWhirter’s Escalante visual application package to construct our more sophisticated applications [4].
3.3
Integrating Standard PICL Tools
There are many excellent performance analysis and visualization tools, and several of them are based on the evolving PICL trace format. ParaVision can in-
corporate such tools into the parallel program tuning environment with reasonable effort. Ideally, a PICL trace application operates serially on events that occur in the execution of the program, i.e., they do not need to lookahead on the trace file to finish processing any particular event. In many cases the application can provide more useful views if it is allowed to lookahead on the trace. For example, ParaGraph preprocesses the entire trace file before it animates the behavior represented by the file. This enables ParaGraph to, for example, construct a Kiviat graph of process activity with the correct number of axis (one for each process) even before every process creation event has been encountered in the trace. For applications written for ParaVision, new pseudo events can be placed in the trace as explained in Section 2, avoiding the need for the application to indiscriminately browse the trace. However, other applications may have already encoded lookahead solutions into their implementation, e.g., as we have pointed out above, ParaGraph preprocesses the trace prior to execution. To adapt ParaGraph to be used with ParaVision, we have taken the following steps: we disabled the menu entry to select a trace file and modified the trace input code to read the socket from ParaVision. ParaGraph still makes its own copy of the same trace file used by ParaVision. Next we changed the event processing loop so that it accepts a timestamp from ParaVision, then processes events from the local copy of the trace file that have not yet been processed but have a timestamp less than or equal to the timestamp from ParaVision. This type of modification is usually trivial, and could be avoided if it the application program did not
need to preprocess the trace (or otherwise access it in a nonsequential fashion). For ParaGraph, the modifications were performed in a couple of hours and required the change and addition of about 20 lines of code. However, the technique does require that the source code for the application tool be available before the tool can be integrated into the environment. The benefit from the modest effort is very high. ParaGraph represents years of experience in program analysis and visualization, and we have adapted it to run in the same syncrhonized environment as ParaVision applications that we have constructed. We are now able to use ParaGraph and ParaVision applications at the same time on the same trace data.
4
Conclusion
This paper focuses on the design of an extensible performance visualization subenvironment that is still being refined. Our early experience with the approach is encouraging in that we have found that it is possible to harness the work of other tool developers while developing our own new tools. We have also found that the tools do, indeed, provide new insight into the applications. During our system development, we used a few different applications that had already been debugged and tuned. Nevertheless the tools illustrated that there were problems with the applications that had previously gone unnoticed. For example, a SOR program to solve an N x N system of linear equations spawned N child processes to solve for each unknown; on termination, the parent could terminate prior to the termination of the children, causing an unnoticed wait system call failure. By analyzing process relationships, this problem immediately became obvious. We also observed previously unnoticed problems such as load imbalances, improper operation at barriers, etc. all providing empirical evidence to support the idea of observation perspectives. Performance visualization depends on the availability of a broad set of views. We advocate that a parallel program tuning environment should include facilities to adapt and define diverse views and perspectives with an underlying perspective manager. This paper describes how we have designed the ParaVision perspective manager to control an environment composed from a broad spectrum of performance applications, yet whose operation is synchronized to provide multiple views of the trace data. In some cases, a PICL trace analysis program can be run directly as a ParaVision application, while in others, it is necessary to
perform minor modifications so that the application uses the synchronization information distributed by ParaVision. ParaVision is early in its development, so there are many improvements that could be made (as mentioned in the discussion above). More importantly, we perceive the system as being a first step toward a tool integration environment that can provide essential support to application programmers by accommodating a spectrum of tools constructed by many different implementers; our future work will also address other factors in tool integration.
Acknowledgements This work was primarily supported by Convex Computer Corporation through a grant that fully supported Griff and partially supported Nutt, and by assigning Mankovich to work at the University of Colorado.
References [1] G. A. Geist, M. T. Heath, B. W. Peyton, and P. H. Worley. A machine-independent communication library. In The Proceedings of the Fourth Conference on Hypercubes, pages 565–568, 1990. [2] Michael T. Heath and Jennifer A. Etheridge. Visualizing the performance of parallel programs. IEEE Software, 8(5):29–39, September 1991. [3] Allen D. Malony, David H. Hammerslag, and David J. Jablonowski. Traceview: A trace visualization tool. IEEE Software, 8(5):19–28, September 1991. [4] Jeffrey D. McWhirter and Gary J. Nutt. Escalante: An environment for the rapid construction of visual language applications. In Proceedings of the 1994 Symposium on Visual Languages, pages 15– 22, October 1994. [5] Daniel A. Reed and The Picasso Group. Scalable performance environments for parallel systems. In Proceedings of the Sixth Distributed Memory Computing Conference, pages 562–569, 1991. [6] Margaret Simmons, Ann Hayes, Jeff Brown, and Daniel Reed. Workshop on debugging and performance tuning for parallel computing systems. Collection of Presentation Abstracts, October 1994.