synthetic parallel programs from a simple communication specification. In particular, it can ... The most important feature of any future automatic or semi-auto-.
Realistic parallel performance estimation Tony Hey
*,
Alistair Dunlop, Emilio Hemhdez
Depurtment ofE1ectranic.v und Computer Science, Uniuerdy
of’.%uthumpton. Southumpton SO17 IBJ. UK
Abstract This paper presents an account of two tools which enable realistic parallel performance estimates to be obtained in reasonable time. The first tool, PERFORM (performance estimator for RISC microprocessors), is a general purpose package for sequential program performance estimation on modem RISC microprocessor nodes with complex memory hierarchies. The novelty of the tool is that we have chosen an intermediate level of abstraction between simple statement counting and full simulation of the node architecture. The second tool, LEBEP, generates synthetic parallel programs from a simple communication specification. In particular, it can generate communication operations that incurs typical communication overhead, including data movements across different levels in the memory hierarchy. Keywods:
Performance tools; Benchmarks; Communication; Message-passing;Memory hierarchy
1. Introduction Realistic parallel performance estimation depends critically on two key performance aspects of a parallel program - single node performance and communication costs. Simplistic approaches to node performance estimation using static statement counting and to communication costs using simple ‘ping-pong’ benchmarks fail to capture reality in several significant ways, and can result in ‘estimates’ being in error by more than an order of magnitude. The most important shortcoming is due to lack of attention to the complex memory hierarchies of modem RISC microprocessor nodes. Another, potentially important shortcoming, is concerned with possible network contention effects: for modern, dedicated parallel machines with their high bandwidth networks, any effects due to this cause are likely to be dwarfed by failure to incorporate an accurate representation of the
memory hierarchy. The most important feature of any future automatic or semi-automatic parallelisation tool for scientific programs on parallel systems will be accurate and reliable performance estimation. As has been known from the early days of the Cosmic Cube, performance of parallel programs depends critically on two key areas - the compute node performance and the communication network performance [l]. For example, the low-level benchmarks in the Genesis [2] and Parkbench [3] suites attempt to parameterize such performance in terms of Hackney’s ‘pipe function’ parameters (n ,,*, r,) for both node behaviour and for point-to-point communication performance [4]. Publications by Hackney and Getov have shown that analytic expressions can fit well to the parallel performance data [5,6]. However, the fitted values of parameters turn out to be very different from those determined by the low-level benchmarks. Other attempts at parallel performance estimation have used static methods usually based on ‘training sets’ or statement benchmarking [7-IO]. These approaches have led to conflicting claims as to the suitability of such methods. The origin of the problem of all these methods is their attempt to avoid detailed characterization of the memory hierarchy of the compute node [ ill. Some approaches, such as that of Fahringer, do make an attempt to estimate cache misses but only on the assumption of a single-level direct mapped cache [ 121.Other approaches, such as the Paradigm System [ 131computes performance estimates based on communication costs only. What is to be done? One alternative would be to perform a detailed simulation of the specific node architecture - but although accurate this is impractical as the basis of a useful, rapid parallel performance estimator tool. In this paper we present an account of two tools which attempt to address this problem. The first tool, PERFORM [ 141provides ‘rapid simulation’ of sequential program performance for RISC processors with complex memory hierarchies. As described below, PERFORM uses both benchmarking and simulation methods at an intermediate level of abstraction in order to produce accurate performance estimates in an acceptable time. The second tool, LEBEP [ 151, described in Section 3, is a system for investigating communication overhead on message-passing, distributed-memory parallel machines, including the influence of the node memory hierarchy. Section 4 summarizes our conclusions.
2. PERFORM:
Performance
estimator
for RISC microprocessors
PERFORM is a tool we have developed that implements a new method of performance prediction for Fortran 77 programs on complex RISC microprocessors. A particular feature of this method is that it quantifies the time required to move data around the memory hierarchy. Our approach is based on a fast simulation method used in conjunction with the statement counting method to estimate program execution time. Although some analytical methods have been developed to estimate cache performance, they have limited generality and applicability to current microprocessor architectures. PERFORM is based on a form of ‘complexity analysis’. That is, PERFORM identifies the number and type of operations in the input program. These operations are grouped into the following categories:
0 Subroutine and function calls. All external library calls, intrinsic function calls and message passing calls fall into this category. 0 Basic arithmetic and logical operations. This consists of both explicit and implicit arithmetic and logical operations. Hence, a ‘do loop’ is identified as consisting of the arithmetic operations to perform the initialisation, loop increment, and a logical operation to test for loop end. 0 Data mooement operalions. ‘Load’ and ‘store’ operations fall into this category. While ‘store’ operations are represented explicitly in Fortran, ‘load’ operations are implicit. These implicit ‘load’ operations occur before the variables can be used in expressions. The execution time of data dependent operations is dependent on the machine state. For this reason, the ‘work’ in a program is represented as a chronological list of operations, while machine performance is defined in terms of benchmarks, hardware timing specifications and memory hierarchy design parameters. Hardware timing instructions are given for the basic arithmetic and logical operations. These are the cycle times to execute the operation, assuming that all operands are in registers and the result is placed in a register. The memory hierarchy design parameters define the organisation of. the main memory, cache memory and registers of the target machine. Finally, benchmark results define the execution time of external subroutines and intrinsic functions. Benchmark results are used for external and intrinsic functions and subroutines as the source code may not be available for a statement level analysis. As these routines contain many lines of pre-compiled code, this does not result in a significant loss of accuracy typically associated with the statement benchmarking approach. PERFORM combines the ordered list of operations in the input code with the machine performance specifications. The execution time of subroutine calls and basic arithmetic and logical operations can be obtained directly from the architecture performance specification. Obtaining the time for ‘loads’ and ‘stores’ is more complicated as the performance estimator needs to maintain a model of the memory hierarchy to determine the level at which data is available and the resulting data access time. To determine the execution time for load (i) at time t, all previous load and store operations must be represented in the internal model of the memory hierarchy. PERFORM thus simulates the effect load and store operations would have on the register sets, cache memories and main memory of the target hardware. This is done using a ‘rapid simulation* method we have developed. The rapid simulation method performs only a limited machine simulation. The simulation is restricted to the memory hierarchy, while only parts of the program code are simulated. The speed of this approach makes our simulation method suitable for estimating execution time of large, computationally intensive applications.
2.1. Implementation
overview
We create the required chronological instruction stream by execution-driven program simulation. Traditionally, simulation is done by interpreting the input program - the simulator emulates the execution of each instruction with many host instructions and modifies its internal machine model in accordance with the instruction (insrrucrion-driven
simulation). An alternative method is to annotate the existing program to produce the required instruction stream when executed. This form of execution-driven simulation is significantly faster than instruction-driven methods; typically by up to 2 orders of magnitude [ 161. It is of course still slower than executing the input program directly. Furthermore, the annotated program will have the same memory requirements as the original code. Our approach is based on execution-driven simulation, but we do not annotate the input program directly. Rather, we produce an annotated version of the controlframework of the input code ‘. That is, the control framework is copied from the input program, together with any code sections and variables that affect control flow or enable array index calculation. All other computation operations, variable references and variable declarations are excluded from the new program. Code to produce the required operation stream is then added to this framework. This results in a lightweight program that neither requires the computation nor memory resources of the original input program. In certain cases the input program will not be reducible to a simpler program. This can occur in programs where computed results are subsequently used to determine the execution path. The new program created using the above process requires less memory than the original code but will execute slower as a result of generating the required instruction stream. To increase the speed with which estimates are produced we have implemented a ‘loop projection’ mechanism. The effect of this is to reduce the size of the instruction stream that is generated by the new program and therefore the number of operations that need to be simulated. We achieve this by modifying the control framework of the created program code. Before the start of each loop a snapshot of the simulation model is taken. This consists of the memory hierarchy information and the execution counts for all operations. A similar snapshot is taken at the end of each loop iteration. After a number of loop iterations have executed, this information is used to predict the status of the simulation model at the end of the loop. If sufficient confidence is obtained in the prediction, the loop is terminated and the status of the model modified to reflect the predicted status at the end of the loop. If this confidence is not obtained, execution continues for a further number of loop iterations before the test is re-applied. The ‘loop projection’ method and termination criteria are discussed fully in [14]. Implementation of the architecture performance model is straightforward. This is a database containing the required execution times and memory hierarchy parameters. As some benchmark results are required by PERFORM, such as the time to execute trigonometric functions, a separate task is to develop the relevant benchmarks. A full list of these subroutines and function can be found in [ 141. Many of the benchmarked functions have execution times that are argument dependent. To account for this, the maximum and minimum execution times are defined in the machine specification file. These values can be obtained from either the processor handbook or from benchmarking instructions with different arguments. These bounds are subsequently used to compute upper and lower bounds on the expected execution time of the input program.
’ This is termed ‘program slicing’ in [ 171.
Our final task is to combine the architecture performance with the instruction stream. To represent the data movement within the memory hierarchy, a model of the memory hierarchy is constructed according to the architecture performance specifications. When a ‘load’ operation is requested, the memory model is modified to show that the requested memory address has moved to the relevant integer or floating point register bank. The time to perform this operation is dependent on the state of the memory hierarchy immediately prior to the operation. This time is recorded and the operation count for the specific ‘load’ operation is incremented. A similar process occurs for ‘store’ operations. When arithmetic or function calls are encountered, the database is interrogated for the maximum and minimum execution times. These times are recorded and the specific operation counter is incremented. In addition to recording the number of operations of each type executed, and the maximum and minimum execution time for each operation, the time required to calculate array subscripts is recorded separately. This information is used to identify the amount of time that could be removed from the computation by intelligent compiler optimisation. All the results from PERFORM are presented to the user via a Xwindows/Motif graphical interface. 2.2. ‘Large integer sort’ experiment We now present an experiment in which we used PERFORM to predict and interpret the execution time of the sequential, ‘large integer sort’ *, Parkbench benchmark [3]. The aim of this work was twofold: First, we wanted to see if the execution time predicted by the performance estimator correlated with the actual execution times. Second, we wanted to see if the performance anomalies present in the code were detected and reported by the performance estimator. Our analysis and performance predictions are given for the ‘in-core’ implementation of the large integer sort on a SUN Sparcstation 1. The key cache features of this architecture are that the machine has a single-level 64 Kb direct mapped cache and a write-through with write-allocate-on-miss write policy. The large integer sort [19] program is an implementation of the bucket sort algorithm. It sorts a disordered sequence of N integers with values in the range [0, MAXKEY]. The bucksort (bucket sort) subroutine is given in Fig. 1. The benchmark of the bucket sort program has timing calls around the loop given in Fig. 2. Accordingly, our analysis is for this section of the code. We performed a large number of benchmarks on different problem sizes for the 10 iteration (numreps = IO) case. The benchmarked execution times were sufficiently large and reproducible on these problem sizes. The ‘fully optimized’ benchmarked results and minimum predicted execution times are presented in Fig. 3 for MAXKEY = 4096. The first things to notice about this graph are the peaks in both the predicted and actual execution times, and the high correlation between the predicted and actual results. There are, however, two differences worth noting. The first and most obvious difference
* This work was done in collaboration with the
HCM(MAP) project
[ 181 at the University of Southampton.
subroutine integer integer integer integer integer integer
bucksortckey, N KAXKEY key(O:N-1) rank(O:K-1) keyden(O:hAXKEY-1) i,j,k
rank,
kayden,
N, RAXKEY)
*
40
do 40 i = 0, keyden continue
MAXKEY= 0
60
do 60 i = 0, N-l k = key(i) keydan = keyden continue
80
do 80 i = 0, keyden continue
l
+ 1
* RAXKEY-1 = keyden
+ keydenci-1)
* do 110 i = 0, N-i k = key(i) = keyden keyden rank(i) = keyden continue return end
110
- 1
Fig. 1. Bucket sorting procedure.
is that the predicted execution times are consistently less than the benchmarked results. This is because the predicted results are the minimum possible execution times given by the performance estimator. These results are a lower bound for the target hardware. This estimate is based on zero pipeline stalls, the minimum possible time for argument dependent operations, and assumes that the compiler will have removed the costs associated with array index calculations. Fig. 3 shows that not all these costs have been removed by the compiler. More accurate performance predictions could of course be obtained by tracking the actual optimisations performed by the compiler. The cost of this is a more specialised tool with added complexity. PERFORM is also able to produce ‘unoptimized’ execution time predictions. We do not show these results in Fig. 3 for clarity. The second difference visible in Fig. 3, concerns the amplitude of the peaks at cache
do 5 i = 1, key(i)
numreps = i
key(i+numreps) call cant
= MAXKEY -
bucksort(key,
rank,
i keyden,
inue Fig. 2. Benchmarked
loop in main program.
MAXKEY)
0.9 0.8 0.7 0.6 0.5 0.4 0.3 0.2 0.1 0 0
so00
loo00
15OtM
20000
25000
30000
35000
N Fig. 3. ‘Optimized’
benchmarked and predicted results for IO iterations and MAXKEY = 4096.
conflict sizes of N. As the performance estimator is able to identify the actual number of cache misses, we would expect the amplitude of the predicted peak to match exactly that of the benchmark result. Instead, the performance estimator is predicting almost double the actual time penalty. This is due to a limitation in the current version of PERFORM, as it does not account for concurrent execution of functional units. If we consider the cache conflict situation in loop ‘1 IO’, the assignment to rank ( i) results in a cache load, displacing key ( i ) . The processor does not, however, wait for rank to be loaded, but continues executing the following instructions. The cost of this cache miss is hidden until the load key( i) instruction is executed. At this point the processor stalls until the previous load and new load complete. The cost of these two cache misses is therefore at least the cost of loading a single cache block, but less than loading two cache blocks. The performance estimator does not account for this concurrent execution and identifies the time as being the sum of both cache misses. From the benchmark and predicted results, we can see that the majority of the cost of loading rank ( i ) is hidden. Fig. 4 shows the ‘unoptimized’ benchmark results with the estimated unoptimized performance for MAXKEY = 4096. There are two predicted worst-case execution times as the execution time of some hardware operations is argument dependent. As these arguments are not determined by the performance estimator, two worst-case results are presented, representing the minimum and maximum times for argument dependent operations. The benchmark results largely confirm those predicted by the PERFORM. Furtbermore, the predicted execution time range encompasses the actual benchmark results, while the predicted best case ‘unoptimized’ execution time is almost identical to the benchmarked results. There is one main reason for some difference between the predicted ‘optimised’ execution time and the actual benchmarked values; namely, that
2.5
2
1.5
I
0.5
(I
5000
IUXH)
I sow
2tnnx1
2SGiW)
3Olw)
3HX)O
.u
Fig. 4. ‘Unoptimized’
benchmarked and predicted results for IO iterations and MAXKEY = 4096.
‘optimised’ predictions exclude all subscript calculations. In the case of the large integer sort, however, full address calculation is necessary for all indirect accessed data arrays. the
2.3. Accuracy and execution time of PERFORM To evaluate the accuracy and speed of the fast simulation method, we compared it with the statement benchmarking [7] method on a number of scientific kernels. The results presented in Table 1 for an iterative Jacobi relaxation program are typical of many scientific kernels. These results show that both the memory requirement and execution time of PERFORM are substantially less than the actual program and are comparable with the statement benchmarking approach. Furthermore, the predicted results from PERFORM bound the actual execution times and differ from the actual results by at most 17%. By comparison, the statement benchmarking method is only suited to producing unoptimized execution time predictions, which in this case are severe underestimates.
Table
I
Comparison of performance estimating methods for a Jacobi relaxation program on a SUN Sparcstation Method
Optimized
Unoptimized
Memory
Est.
execution
execution
requirement (Mb)
time k.1
time (s)
time (s)
Actual program
26.6
99.0
Statement benchmarks
-
22.5
PERFORM
22.
I
109.5
26 Negligible
0.2
Elapsed time: 0.2603 PCO]: Total UClk Time: 0.2600 0.2600 Total User Time: 0.0000 Total Sys. Time: PCl]: 0.2601 Total UClk Time: 0.2600 Total User Time: 0.0000 Total Sys. Time: EXPERINEUT BUHBER 2 >msg_siza = 1DDD< -> Elapsed time: 0.6598 P[O]: Total UClk Time: 0.6594 Total User Time: 0.6600 Total Sys. Time: 0.0000 PCl]: 0.6595 Total Wlk Time: Total User Time: 0.6500 Total Sys. Time: 0.0000 EXPERIHEAT AUIIBER 3 >msg_size = lOOOO< 4.619 -> Elapsed time: PCO]: 4.6187 Total UClk Time: Total User Time: 4.6100 Total Sys. Time: 0.0000 PC11
:
Total YClk Time: Total User Time: Total Sys. Time:
4.6188 4.6200 0.0000
* l l
EXPERIMEHTS FIEISHED
l
* Fig. 6. Output of the program generated from the specifications of Fig. 5. The program was generated in C with PVM
calls and executed on a Meiko-CS2.
________________________-_---_-_ - LEBEP experiments ________________________________ EXPERIMENT UUf4BER 1 >msg_size = lOO< -> Elapsed time: 1.495 Pro]: Total UClk Time: 1.4889 Total User Time: 0.0600 Total Sys. Time: 0.1200 PCll: Total UClk Time: 1.4854 Total User Time: 0.1200 Total Sys. Time: 0.1200 EXPERIHEUT NUMBER 2 >msg_size = lOOO< -> Elapsed time: 5.112 PCO]: Total UClk Time: 5.1056 Total User Time: 0.3300 Total Sys. Time: 0.4800 PC11 : Total UClk Time: 5.0959 Total User Time: 0.4900 Total Sys. Time: 0.5400 EXPERIMENT NUMBER 3 >msg_size = lOOOO< -> Elapsed time: 43.91 PC01 : Total UClk Time: 43.8817 Total User Time: 3.0100 Total Sys. Time: 5.2300 PCll: Total UClk Time: 43.7381 Total User Time: 3.4700 5.7600 Total Sys. Time: l
* + * *
EXPERIHEHTS FIHISHED
Fig.7. Output of the program generatedfrom the specifications of Fig. 5. The program was generated in C with PVM
calls and executed on a workstation cluskr.
ing communication operations that use either explicit loops or the standard library support to make communication-related data transfers. L,ebep specifications for a simple pingpong benchmark are shown in Fig. 5. Processes 0 and 1 exchange a double precision message of size equal to msg_size, Iter times. Iter is a constant equal to 100 and the value of msg_size is different for every experiment (100, 1000 and 10000). Process 0 executes the directive FINISHto terminate the current experiment. Figs. 6 and 7 show the output of the generated C program with PVM calls, executed on a Meiko-CS2 and a workstation cluster communicating via an ethernet switch.
More complicated communication patterns like rings, pipelines, farmer-workers structures, etc., can easily be defined. In particular, Lebep provides support for specification of processor grids. The message elements can be noncontiguous, in which case a specification of the way they are copied into the message buffer is needed. The SEND operation can be specified as SEND((dest), (msg_size), (type), STRIDE=(stride), LOOP-TRANSFER) and explicit loops will be generated to make the data transfer (DO loops in Fortran and for loops in C). The RECV operation can also contain the STRIDE and the LOOP-TRANSFER parameters to make the data transfer from the message buffer to the target location in the user area. Another alternative for data copying can be defined using the parameter LIBRARY-TRANSFER instead of LOOP-TRANSFER. This option generates data transfers that use the standard library mechanism (pom_pack/ pum_unpack with stride specification in PVM and definition of a new MPI_Datatype in MPI). In some architectures, such as the SUPRENUM [29] and the Cray T3D [30], optimised implementations of these functions could use strided DMA data transfers to the interconnection hardware, avoiding preliminary data movements in node. The Lebep generator can produce programs with PVM calls in two flavours, using explicit packing (pvm_pack before pum_send and pvm_unpack after pum_recu) or using implicit packing (pvm_psend and pvm_precv). 3.2. Measurements
with LEBEP benchmarks
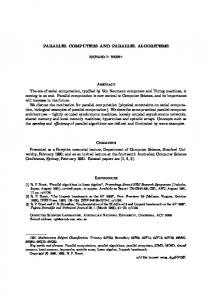
Figs. 8, 9, Figs. 10 and Figs. 11 show the execution time of several variants of a pingpong benchmark with stride specification. The execution time of these versions are Pingpong on CS2 using PVM (Noncontiguous data. strider6)
“1 12 -
(1) PVM (Library Transfer) -+-.
10 -
,.*’ ,/’ ,/’ ,/ ,/’
0-
,,*’ ,/’ ,/’ _/’
6.
.c*’ ,/ ,/ ,/’
*_.---
_/’
4.
,/’
__..--
/ /’
__,.--
__--
__--
___---
__--___----
___----
_/- I
_/---
__A-
__--- *I
__/___---,_.--_______.------” __-,/ ___--- _____---- *-,.Y ___--- ___--.1*_~__~_~~_-.--.w____..-_,,__,~_,..._.....___.................. ...-...... _.__...... 1, _-. . . 0 ~~=..J...-J ’ 0 5000 7000 BOW XQO 1OWO loo0 2000 3000 4000 6CQO
2-
,/
.c’
Number of double precision elements per massage
Fig. 8. Lebep-generated pingpong benchmarks on a MEIKO-CS2.
using PVM.
P,ngpong on CS2 us,ng MPI (Nonconl,guous
(1) MPI (Library Transfer) (2) MPI (Loop transfer (3) MPI (Conliguous Data
i
data. strIdea)
-++ A--
Number of double prec~sron elements per message
Fig. 9. Lebep-generated pingpong benchmarks on a MEIKO-CS2,
using MPI.
compared with the equivalent contiguous data version. All benchmarks were generated from Lebep specifications and executed on a Meiko-CS2 (Figs. 8 and 9) and a network environment with light load (Figs. 10 and 11). The Meiko-CS2 contains 70 MHz Viking
Pingpong
on a Workstation Cluster using PVM. via Ethernet Switch (Noncontiguous
data, stride.8)
70
II 60
(1) PVM (Library Transfer
,/
,/’
,/
,/’ (4) PVM (Contiguous
,/
Data) -A--
_/
i
50
40
30
20
10
0
1000
I 2000
3000
4000
5000
6000
7000
8000
9000
10000
Number of double precision elements per message
Fig. IO. Lebep-generated (using PVM).
pingpong benchmarks on a workstation cluster communicating via Ethernet Switch
Pingpong on a Workstation Cluster using MPI. via Ethernet Switch (Noncontiguous
data, stride&)
70
loo0
2wo
3000
4000
5000
6000
7000
8000
9000
lcooo
Number of double precision elements par message
Fig.
I I.
Lebep-generated
pingpong benchmarks on a workstation cluster communicating
via Ethernet Switch
(using MPI).
SPARC nodes and a proprietary interconnection network. The machines used for the experiments in the network environment were a SUN SPARCstation IPC at 25 MHz and a SPARCstation 1 at 20 MHz, connected through an ethernet switch of 10 Mbps. In both environments the command used to compile the generated program was gee-03. The comparison between the performance of different implementation options of the same basic communication specification is very instructive. The first evident conclusion is that the communication performance significantly depends on the communication library and the programming style choice used to transfer data between the (noncontiguous) user buffer and the system message buffer. In particular, the use of PVM and especially the use of pvm_pack and pvm_unpack, produce a considerable degradation of the performance, in both the parallel and the network environment. Regarding the influence of communicating contiguous and noncontiguous data, there is a notable difference between the performance of these two options in the Meiko-CS2. This difference is likely to be exposed in a computer platform with a fast interconnection network and low software overhead like the CS2. On the other hand, in a network environment the difference is noticeable but proportionally much smaller. The relative low speed of the interconnection network (ethernet) and the big message software overhead (TCP/IP) mask the performance variation between the versions with contiguous and noncontiguous data. This simple experiment shows that communication of noncontiguous data (necessary, for instance, when a row of a matrix stored by columns is transmitted) imposes an enormous performance penalty on a parallel computer when compared to the raw communication performance. The same factor has a moderate influence on communication performance in a workstation cluster environment.
Communication performance depends not only on the communication pattern, but also on when the processors are communicating. If asynchronous communication is used, long delays between sends and their matchin,0 receives may produce considerable performance degradation due to message bufferin,.0 The insertion of computation periods between communication operations is possible with LEBEP, either by specifying number of operations or computation time. Dummy computation periods can be used to study the influence of delayed communication operations on the performance of the communication patterns.
4. Conclusions The fast simulation method used by PERFORM has greater accuracy than the statement counting (benchmarking) approaches to performance prediction as a result of three refinements: 0 Memory hierarchy analysis. PERFORM can provide a highly accurate estimate of the time required to move data within the memory hierarchy. In current high performance micro-processors this can account for as much or more time than actually processing the data. As the technological gap between processor speeds and memory speeds is widening, this is likely to become an increasingly important area for performance optimisation [3 11. 0 Bounds for rhe execurion rime of operations. PERFORM computes upper and lower bounds for the execution time, by noting that certain operations are argument dependent. This could, however, be incorporated into the benchmarking method. 0 Identifying opportunities for code optimisation. PERFORM incorporates a greater level of analysis than the benchmarking approach. Specifically, PERFORM identifies array subscript calculations as possible areas for optimisation. Our experiments have shown that PERFORM provides a significantly higher level of accuracy over benchmarking methods, without the costs associated with traditional simulation methods. Previous work about communication performance has mainly focused on point to point communication characterisation [32] and characterisation of collective communication routines [33]. LEBEP is being used as the base of a methodology to make a more extensive benchmark-based characterisation of the communication performance. The main advantage of using a tool like LEBEP is that benchmarks with different communication patterns can be easily defined, rapidly generated and executed. This provides us with a simple way of evaluating interconnect subsystems. A clear benefit of using a simple language like Lebep to specify communication benchmarks is that the benchmarks are not attached to a particular communication library. The results presented in this paper show important performance variations between implementation alternatives of the same Lebep specifications, executed on the same machine. The fact that the communication benchmarks are specified in a higher level fashion allows us to choose the best alternative to represent the potential performance of a particular interconnect subsystem. In this sense the proposed methodology is reminiscent of the ‘paper and pencil’ style of benchmark specification [ 191. Additionally, LEBEP can help a program-
mer to select the best communication structure and communication library for a given problem on a target architecture. LEBEP was designed to help users develop and validate analytical communication performance models for typical communication patterns, like pipelines, grids and farmer-workers topologies. In contrast to this, PERFORM has been developed to provide accurate single node performance estimates. These are complementary tools and as such we are investigating ways of combining both approaches to provide a unified method of performance prediction for distributed-memory, message-passing machines. The discussion of both the PERFORM and LEBEP systems has clearly demonstrated the need to incorporate a realistic model of the memory hierarchy for accurate parallel program performance estimation. There is more work to be done to create a robust and reliable performance estimation system for parallel programs. The PERFORM tool is currently being extended to other node architectures and will be evaluated as a wider range of realistic benchmarks applications. LEBEP will be extended to address further collective communication operations and be provided with a graphical interface for performance visualisation. Together, we believe that these tools represent an important step along the road to future automatic parallelisation systems.
Acknowledgements We acknowledge valuable advice and assistance from Dr. Denis Nicole in the development of PERFORM and LEBEP.
References [I]
GC.
Fox, M.A. Johnson GA.
Concurrent Processors -
Syzenga, S.W. Otto, J.X. Salmon and D.W.
Walker,
Generul Techniques urtd Regulur Problems, Vol.
Soluing Proh1em.s on
I. (Prentice hall, Englewood
Cliffs, NJ, 1988). [2] C.A. Addison, VS. benchmarks. 257-27
eds.. Computer
Benchmarks
(North-Holland,
1993)
and T. Hey, The PARKBENCH
Benchmark
Collection,
Supercomputer
11(2-3)
(199.5)
Performance parameters and benchmarking
of supercomputers. Puruilel
Cornput. 17(10-l)
1111-1130.
[5] R. Hackney, [6] V. Getov, (1992)
Gentzsch
14.
[4] K. Hackney, (1991)
and W.
I.
[3] J. Dongarra 94-l
Getov, A.J.G. Hey, R.W. Hackney and I.C. Wolton, The genesis distributed-memory
in: J. Dongarra
Computational similarity, Concurrency Pruct. Exp. 7(2) (1995) I-Dimensional
Parallel FFT Benchmark
on SUPRENUM,
147- 166.
Lecture Notes Compur. Sci. 605
163-174.
[7] V. Balasundaram. G. Pox, K. Kennedy and U. Kremer. A Static Performance Estimator to Guide Data Partitioning Decisions, ACM Sigpkn Notices 26(7) (1991) [8] N. MacDonald,
213-223.
Predicting the Execution time of Sequential Scientific Codes, in: Proc. intrrnutionul
Workshop on Automutic Distributed Memory Purullelisution. Paruf/el Prrjisrmunce Prediction,
Saarbrucken, Germany,
[9] K. Kennedy, N. McIntosh and K.S. McKinley,
Automutic Dutu Distribution
March
und Automutic
(I 993).
Static Performance Estimation in a Parallelising Compiler,
Technical report, Department of Computer Science, Rice University (1992). [IO] Y. Seo. T. Kamachi, Y. Watanabe, K. Kusano, K. Suehiro and Y. Shiroto. Static Performance Prediction
[I I] [I21
[ 131
[I41
[ 151 [I61
[ 171 [18]
(191
[20] [2l] [22] [23] [24]
[25] [26]
[27] [28]
[29] [30] [3l] [32]
in PCASE: A Programming Environment for Parallel Supercomputers, Technical report, NEC Corporation, December ( 1993). A. Dunlop, A. Hey and D. Nicole. An Evaluation of the Statement Counting Method for Performance Prediction (I 996). in preparation. T. Fahringer, Using the P3T to Guide the Parallelisation and Optimisation Effort under the Vienna Fortran Compilation System, in: IEEE Proceedings of rhe Scuhble high Perfirmunce Compuring Conference. Knoxville, TN, May (I 994). P. Banerjee, J. Chandy. M. Gupta, E. Hodges, J. Holm, A. Lain, D. Palermo, S. Ramaswamy and E. Su. The Paradigm Compiler for Distributed-Memory Multicomputers, IEEE Compur. 28(10) October (1995) 37-47. A.N. Dunlop and D.J. Pritchard, Parallel Performance Estimator, Technical Report D5.3b. ESPRIT project P6643, Portable Parallel Programming Environment (PPPE) (1995). E.E. HemBndez, Parallel Computing System Evaluation using Automatically Synthesized Benchmarks, April (I 995). internal Report. E. Brewer, A. Colbrook. C. Dellarocas and W. Weihl, PROTEUS: A High-Performance Parallel-Architecture Simulator, Perjivmunce Euul. Reu. 20(I) (I 992). M. Weiser, Program slicing, IEEE Truns. Sojiwure Eng. lo(4) (1984). A.N. Dunlop, V. Marion-Poty and D.J. Pritchard, Benchmark Analysis using a Performance Estimator, Technical report, Department of Electronics and Computer Science, University of Southampton, July ( 1995). D. Bailey, E. Barszcz, J. Barton, D. Browning, R. Carter, L. Dagum, S. Fatoohi, S. Fineberg, P. Frederickson, T. Lasinski, R. Schreiber. H. Simon, V. Venkatakrishnan and S. Weeratunga. The NASA Parallel Benchmarks, Technical Report RNR-94-007, NASA Ames Research Center. USA, March ( 1994). C. Figueira and E. Hemtidez. Benchmarks Specification and Generation for Performance Estimation on MIMD Machines, IF/P Truns. Compur. Sci. Technol. 44 (1994) 215-223. A. Dunlop, E. Hemandez, 0. Naim, A. Hey and D. Nicole, A toolkit for optimizing parallel performance, Lecture Notes Cornput Sci. 919 (1995) 548-553. H.C. Cragon, Memory Systems und Pipelined Processors (Jones and Bartlett, 1995). J. Hennessy and D. Patterson, Computer Archirecrure, a Quunrirutiue Approuch, 2nd. Ed. (Morgan Kaufman Publishers, inc., 1995). A. Singh and 2. Segall, Synthetic Workload Generation for Experimenting with Multiprocessors, in: Proc. of the 3rd Inr. Con& on Distriburrd Compudng Sysrems (IEEE Computer Society Press, 1982) 778-785. R. Candlin, P. Fisk, J. Phillips and N. Skilling. Studying the Performance of Concurrent Programs by Simulation Experiments on Synthetic Programs, ACM Performonce Ed. Rev. 20 (1992) 239-240. A. Nanda and L.M. Ni, Benchmark workload generation and performance characterization of multiprocessors, in: Proc. uf rbe Conf on Supercumpuring (IEEE Computer Society Press, November 1992) 20-31. S. Waser, The Parstone Benchmark. Supercomputer 20(4-5) (1993) 46-57. P. Mehra, M. Gower and M.A. Bass, Automated Modelling of Message-Passing Programs, in: /EEE Proc. ISBN O-8186-5292-6 (1994). W. Gilot, The SUPRENUM supercomputer - Goals, achievements, and lessons learned, Purulfel Compur. 20( IO- I I) I407- I 425 ( 1994). CRAY T3D System Architecture Overview Manual (1995). J.R.B. Davies, Issues in compiler performance, in: J.L. Martin, ed.. Performunce Euuluurion uj Supercompurers (North-Holland, 1988) 5 I-68. R. Hockey. The Communication Challenge for MPP: Intel Paragon and Meiko CS-2. Purullel Compur. 20(3) (1994)
389-398.
[33] Z.W. Xu and K. Hwang.
Modelling Communication Overhead SP2. IEEE Purullel Disrrih. Technol. 4(I) ( 19%) 9-23.
- MP1 and MPL Performance
on the IBM