1
Face Identification Using Novel Frequency Domain Representation of Facial Asymmetry Sinjini Mitra∗
Marios Savvides
B.V.K. Vijaya Kumar
Information Sciences Institute
ECE Department & CyLab
ECE Department & CyLab
University of Southern California Carnegie Mellon University Carnegie Mellon University
[email protected]
[email protected]
[email protected]
Abstract Face recognition is a challenging task. This paper introduces a novel set of biometrics, defined in the frequency domain and representing a form of “facial asymmetry”. A comparison with existing spatial asymmetry measures suggests that the frequency domain representation provides an efficient approach for performing human identification in the presence of severe expressions and for expression classification. Error rates of less than 5% are observed for human identification and around 25% for expression classification on a database of 55 individuals. Feature analysis indicates that asymmetry of the different face parts help in these two apparently conflicting classification problems. An interesting connection between asymmetry and the Fourier domain phase spectra is then established. Finally, a compact one-bit frequency domain representation of asymmetry is introduced, and a simplistic Hamming distance classifier is shown to be more efficient than traditional classifiers from storage and computation point of view, while producing equivalent human identification results. In addition, application of these compact measures to verification and a statistical analysis are presented. Index Terms asymmetry, efficiency, expression, face, features, frequency domain, identification, one-bit code, phase
2
I. I NTRODUCTION In the modern world, the ever-growing need to ensure a system’s security has spurred the growth of the newly emerging technology of biometric-based identification. Of all the biometrics that are being used today, the face is the most acceptable because it is one of the most common methods that humans use in their visual interaction and perception. In fact, facial recognition is an important human ability − an infant innately responds to face shapes at birth and can discriminate his or her mother’s face from a stranger’s at the tender age of 45 hours ([1]). In addition, the method of acquiring face images with digital cameras is non-intrusive. However, face-based identification poses many challenges. Several images of a single person may be dramatically different because of changes in viewpoint, color and illumination, or simply because the person’s face looks different from day to day due to make-up, facial hair, glasses, etc. Faces are rich in information about individual identity, mood and mental state, and position relationships between face parts, such as eyes, nose, mouth and chin, as well as their shapes and sizes are widely used as discriminative features for identification. One family of features that has only recently come into use in face recognition problems is facial asymmetry. Facial asymmetry can be caused either by external factors such as expression changes, viewing orientation and lighting direction, or by internal factors like growth, injury and age-related changes. The latter is more interesting, being directly related to the individual face structure, whereas the former can be controlled to a large extent and even removed with the help of suitable image normalization. Psychologists have long been interested in the relationship between facial asymmetry and attractiveness and its role in identification. It has been observed that the more asymmetric a face, the less attractive it is ([2]). Furthermore, the less attractive a face is, the more recognizable it is ([3]). A commonly accepted notion in computer vision is that human faces are bilaterally symmetric ([4]). [5] reported no difference whatsoever in recognition rates while using only the right and left halves of the face. However, a wellknown fact is that manifesting expressions cause a considerable amount of facial asymmetry, they being more intense on the left side of the face ([6]). Indeed differences were found in recognition rates for the
3
two halves of the face under a given facial expression ([7]). All these indicate the potential significance of asymmetry in automatic human face recognition, particularly in the presence of expressions. Identifying twins based on face images has defied the best of facial recognition systems, and [8] reported statistically significant differences among facial asymmetry parameters of monozygotic twins. This shows the potential of facial asymmetry in producing efficient identification tools. Despite extensive studies on facial asymmetry, its use in human identification started in computer vision in 2001 with the seminal works by Liu ([9]), who for the first time showed that certain facial asymmetry measures are efficient human identification tools under expression variations. This was followed by more in-depth studies ([10]-[11]) which further investigated the role of asymmetry measures both for human and expression classifications. The goal in this paper is to study an alternative representation of facial asymmetry in the frequency domain, which constitutes a completely novel and unique research agenda. We wish to establish its efficacy in various recognition tasks and other properties by exploiting the characteristics of the frequency domain. The rest of the paper is organized as follows. Section II contains a brief description of the database and Section III introduces the new frequency domain asymmetry biometrics. Section IV presents a feature analysis, and the classification results appear in Section V. Section VI explores the connection between asymmetry and Fourier domain phase spectra while Section VII introduces a computationally efficient one-bit code. We conclude with a discussion in Section VIII. II. DATA We use a part of the “Cohn-Kanade AU-coded Facial Expression Database” ([12]), consisting of images of 55 individuals expressing three different emotions − joy, anger and disgust. The data thus consist of video clips of people showing an emotion, starting with a neutral expression and gradually evolving into its peak form. Each clip is broken down into several frames and the raw images are normalized using an affine transformation technique employed by [13] which is based on a combination of scaling and rotation. Each normalized image is of size 128 × 128 and has a face midline determined so that every
4
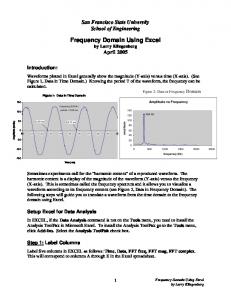
point on one side of the face has a corresponding point on the other. We do not include details here for space constraints but an interested reader is referred to [13] for details on the alignment procedure. Some normalized images from our dataset are shown in Figure 1. This is the only known database as per our knowledge, that allows for thorough investigation of the role of facial asymmetry in identification in the presence of extreme expression variations, since the images were carefully captured under controlled background lighting. We use this small subset as the initial test-bed for our experiments and hope to extend to a bigger database in the near future. This also facilitates a fair comparison of our results to those in [9] - [11] which were based on this small subset too.
Fig. 1.
Sample images from our database. [Courtesy Liu et al. ([13])]
III. T HE F REQUENCY D OMAIN Many signal processing applications in computer engineering involve the frequency-domain representation of signals. The frequency spectrum consists of two components at each frequency: magnitude and phase. In 2D images particularly, the phase component captures more of the image intelligibility than magnitude and hence is very significant for performing image reconstruction ([14]). [15] showed that correlation filters built in the frequency domain can be used for efficient face-based recognition. Recently, the significance of phase has also been used in biometric authentication. [16] proposed correlation filters based only on the phase component of an image, which performed as well as the original filters and [17] demonstrated that performing PCA in the frequency domain by eliminating the magnitude spectrum and retaining only the phase not only outperformed spatial domain PCA, but also have attractive properties
5
such as illumination tolerance. All these show that frequency domain features possess the potential for improving classification results. Symmetry properties of the Fourier transform are often very useful. According to [18], any sequence x(n) can be expressed as a sum of an even part or the symmetry part x e (n) and an odd part or the
asymmetry part xo (n). Specifically, x(n) = xe (n) + xo (n),
where xe (n) = 21 (x(n) + x(−n)) and xo (n) = 21 (x(n) − x(−n)). When a Fourier transform is performed on a real sequence x(n), the even part (xe (n)) transforms to the real part of the Fourier transform and the odd part (xo (n)) transforms to its imaginary part (Fourier transform of any sequence is generally complex-valued). In the context of a face image, the even part corresponds to the symmetry of a face (in the left-right direction, across from the face midline) and hence the more symmetric a face region is, the higher will be the value of the corresponding odd part and vice versa. This implies that spatial asymmetry of the face corresponds to the imaginary part of the Fourier transform and the symmetry part corresponds to the real part, and this correspondence lays the ground for developing asymmetry features in the frequency domain. However, all these relations hold for one-dimensional sequences alone, and hence we define our asymmetry features based on the Fourier transforms of row slices of the images (either singly, or averaging over a certain number of rows at a time, as described in the next section).
A. The Asymmetry Biometrics Following the notion presented above, we define three asymmetry biometrics in the frequency domain based on the imaginary components of the Fourier transform as: •
I-face: frequency-wise imaginary components of Fourier transforms of each row slice − 128 × 128 matrix of features (need to use half of these owing to symmetry properties of Fourier Transform 128 × 64 features)
6
•
Ave I-face: frequency-wise imaginary components of Fourier transforms of averages of two-row slices of the face − 64 × 64 matrix of features
•
E-face: energy of the imaginary components of the Fourier transform of each row slice of the face − a feature vector of length 128
For all three sets of features, the higher their values the greater the amount of asymmetry, and vice versa. The averaging over rows is done in order to smooth out noise in the image which is likely to create artificial asymmetry artifacts and give misleading results. Averaging over more rows, on the other hand, can lead to over-smoothing and a loss of relevant information. The two-row blocks were selected as optimal after some experimentation. We also wish to compare the performances of the three feature sets, especially, to explore whether it is justified to consider the higher-dimensional I-faces instead of the E-faces in terms of better classification performance. Note that, all these features are simple in essence, yet the goal is to show that they are capable of forming effective identification tools. To the best of our knowledge, these frequency-based features representing facial asymmetry are fairly novel in any computer vision and pattern recognition problems.
IV. F EATURE A NALYSIS The different exploratory feature analyses that we present in this section are aimed at providing a preliminary idea about the nature of the frequency asymmetry metrics and their utility in classification methods. For the first set of feature analysis, we use a variant of the E-faces due to their low dimensionality. Figure 3 shows how asymmetry varies among the different expressions of two different people, the corresponding images being shown in Figure 2. For instance, for person 1, joy produces the greatest degree of asymmetry, and neutral expression the lowest, whereas for person 2, joy and neutral expressions show maximum asymmetry followed by anger and disgust. Moreover, Person 1 has a greater amount of asymmetry over the whole face for joy (forehead, nose and mouth regions) while only in the forehead region for the other three emotions. As for Person 2, on the other hand, the mouth region
7
appears to have the maximum asymmetry for all the four emotions. Therefore, although we looked at only 2 people in the database, these analyses give a preliminary idea that people may tend to express different emotions differently which in turn suggests that these measures may be helpful in automatic face recognition tasks in the presence of expression variations, as well as in identifying expressions.
Person1 Person2 Neutral Fig. 2.
Anger
Disgust
Joy
Two people showing four different facial expressions.
neutral
700
600
600
500
anger
350
disgust
300
350
joy
300
neutral
80
160
70
250
disgust
140
200
250
100
400
120 50
400
200
200
150
150
300 300
150
80
100 40 80
60
100
30 200 200
60 100
100
40 20
100
100
0
0
50
50
0 0 0 50 100 0 50 100 0 50 100 0 50 100 frequencies frequencies frequencies frequencies
(a) Person 1 Fig. 3.
joy
250
120
140
60 500
anger
180
40
10
0
50 20
20
0
50 100 frequencies
0
0
50 100 frequencies
0
0
50 100 frequencies
0
0
50 100 frequencies
(b) Person 2
Asymmetry of the different facial features for the four expressions of two persons. The horizontal axis represents the
different frequencies at which the asymmetry biometrics were computed for each row slice of the face from the forehead to the chin.
We next study the distribution of the asymmetry metric for all the 55 people for certain facial regions that not only contain valuable discriminating information but also are prone to significant changes during expressing emotions − eyes and mouth. We select a few rows in those regions, average them and compute the energy of the imaginary parts of the Fourier transform (measure of asymmetry). Figure 4 shows these
8
energy values for the four expressions for all the 55 people in our dataset. The multiple peaks in these figures reveal that there exists significant difference in asymmetry among the different people and also among the four expressions. 14
12
12
14
16
14
12
10
12 10
10 8 10
8
8 6
8
6
6 6 4
4
4 4 2
2
0
0
20
40
60
asymmetry
80
100
120
140
0
2
0
20
40
60
neutral
80 asymmetry
100
120
140
160
0
2
0
20
40
60
joy
18
80 asymmetry
100
120
140
160
0
0
50
100
anger
25
asymmetry
150
200
250
disgust
15
15
10
10
5
5
16 20
14
12 15 10
8 10 6
4
5
2
0
0
20
40
60
asymmetry
80
100
120
140
0
0
neutral Fig. 4.
50
100
150 200 asymmetry
joy
250
300
350
0
0
50
asymmetry
100
anger
150
0
0
20
40
60
80 asymmetry
100
120
140
disgust
Distributions of the asymmetry metric for the 55 people and for the four different expressions. The top panel shows
the distributions for the eye region and the bottom panel correspond to the mouth region.
A. Discriminative Feature Sets Next we study the discriminative power of the asymmetry measures to determine the specific facial regions that contribute to the identification process, both for humans and expressions. Ideally, those features which contribute to inter-class differences should have large variation between classes and small variation within the same class. Hence, a measure of discrimination can be provided by a variance ratio type quantity; in particular, we use what is known as an Augmented Variance Ratio (AVR), following along the lines of [13]). AVR compares within class and between class variances and at the same time penalizes features whose class means are too close to one another. For a feature F with values S F in a
160
9
data set with C total classes, AVR is calculated as AV R(SF ) =
V ar(SF ) 1 C
V ark (SF ) k=1 minj6=k (|meank (SF )−meanj (SF )|)
PC
,
where meani (SF ) is the mean of the subset of values from feature F belonging to class i. The higher the AVR value of a feature, the more discriminative it is for classification. For human identification, the 55 subjects form the classes and for expression classification, the classes are the 3 emotions.
Figure 5 shows the E-face AVR values for human and expression classifications calculated based on all the 55 individuals in the database. Looking carefully at the human AVR values, we discover that a few subjects in the database have some artificial asymmetry in the forehead region arising from either falling hair, or edge artifacts introduced in the normalization procedure (Figure 6). This is highly undesirable and spuriously raises the first few AVR values in Figure 5(a). Figure 5(b) shows the AVR plot without the top 3 features, and this clearly shows that the nose bridge contain the most discriminative information pertaining to recognition of individuals under different expressions (marked in Figure 5(c)). Figure 5(d)(e) show that the region around a person’s mouth is most discriminative across different expressions (no problem here due to edges). We thus conclude that the asymmetry of different face regions drives these two apparently conflicting classification problems and hence may be effective for both. Moreover, these results are consistent with similar feature analysis results in [11], based on spatial asymmetry measures.
V. C LASSIFICATION R ESULTS We tried different classification methods which include Fisher Faces (FF, [19]), Support Vector Machines (SVM, [20]), Linear Discriminant Analysis (LDA, [21]) and the Individual Principal Component Analysis (IPCA, [22]). The IPCA method is different from the global PCA approach ([23]) where a subspace W is computed from all the images regardless of identity. In individual PCA, on the other hand, subspaces Wp are computed for each person p and each test image is projected onto each individual subspace using yp = WpT (x − mp ). The image is then reconstructed as xp = Wp yp + mp and the reconstruction error computed ||ep ||2 = ||x − xp ||2 . The final classification chooses the subspace with the
AVR values 0.0 0.2 0.4 0.6 0.8 1.0 1.2
10
0
10
20
30 40 asymmetry features
50
60
0.0
AVR values 0.05 0.10 0.15 0.20 0.25
(a)
0
10
20
30 40 asymmetry features
50
60
(c)
0
100
AVR values 200 300
400
500
(b)
0
10
20
30 40 asymmetry features
50
60
(d) Fig. 5.
(e)
AVR values for E-faces. Human identification: (a) for all features, (b) all features except top 3, (c) nose bridge with
the highest AVR value. Expression classification: (d) all features, (e) mouth region with the highest AVR value. The features 0 − 64 represent the regions from the forehead to the chin of a face.
(a) Hair Fig. 6.
(b) Edge artifacts
Images with artificial asymmetry in the forehead.
smallest ||ep ||2 . Of these four classifiers, LDA did not perform well and so we omit those results and report those from the other three classifiers. LDA is known to be effective for spatial or image domain features computed from pixel intensity values, and this may be a probable cause of its failure for our frequency-based features.
A. Human Identification For human identification, we train on the neutral frames of the three emotions of joy, anger and disgust from all the 55 individuals, and test on the peak frames of the three emotions from all the people. We thus use 3 frames per person for training (165 total) and 3 frames per person for testing (165
11
total). This represents an expression-invariant human identification problem, similar to the one reported in [13] which uses a spatial asymmetry measure called Difference face (D-face, for short) defined as: D(x, y) = I(x, y) − I 0 (x, y). I denotes a (normalized) face image and I 0 its reflected version along
the face midline. LDA was used as the classifier in their case. Note that, [13] reported classification results on five different experiments − training on frames from two emotions and testing on the third, training on neutral frames and testing on peak ones and vice versa. However, we use only one of these experimental setups (training on neutral and testing on peak) and hence we will compare our results to the corresponding cases from the spatial measures. Table I shows the misclassification error rates for human identification (percentage of cases that are wrongly classified) based on our frequency domain asymmetry biometrics from the different classifiers. They show that IPCA performed the best, closely followed by linear kernel-based SVM (in fact, their I-face and Ave I-face results are almost identical with the IPCA ones). Moreover, I-faces proved to be significantly better than E-faces which shows that the feature reduction by way of summing over each row in constructing the E-faces destroyed features crucial for discrimination, and hence deteriorated performance. We will henceforth work with the I-faces alone. TABLE I M ISCLASSIFICATION RATES FOR HUMAN IDENTIFICATION USING FREQUENCY- DOMAIN ASYMMETRY MEASURES . Classifiers
I-face
Ave I-face
E-face
FF
15.76%
10.91%
19.19%
SVM (Linear kernel)
4.85%
3.94%
8.79%
SVM (polynomial, deg 2)
6.36%
6.36%
9.70%
IPCA
4.85%
3.64%
6.36%
We next compared our results (the best ones with IPCA) with those obtained with D-faces ([13]) shown in Table II. We compare to D-face alone (except for D hx which are significantly worse) because by construction, our frequency measures (I-faces and E-face) are analogous to those (following the
12
reasoning presented in Section III). The results indicate that our proposed frequency domain measures are significantly better than D-face and have no statistically significant differences with the D-face Principal Components (PCs) at the 1% level. These are adjudged by using “p-values” (or probability values), a quantity used commonly in statistical inference problems to test the significance of a proposed hypothesis. The lower the p-value of a test, the more evidence the data exhibit against its acceptance ([24] contains details on the procudure of statistical hypothesis testing). In both our cases, we test the hypothesis that the error rates from using the spatial domain and the frequency domain measures are the same. When comparing with D-faces, we obtain p-values < 0.0001 and with D-face PCs, p-values > 0.01, which suggest that the frequency-domain measures are at least as robust to intra-personal variations caused by expression changes as their spatial domain counterparts. TABLE II M ISCLASSIFICATION RATES FOR EXPRESSION - INVARIANT HUMAN IDENTIFICATION BASED ON SPATIAL D- FACE MEASURES . Asymmetry features
Error rates
Asymmetry features
Error rates
Spatial D-face
17.58%
Spatial D-face PCs
3.03%
B. Expression Classification A person’s expression is helpful in identifying his or her mood and mental state, and is often a individualized characteristic. Different people express different emotions differently, which echoes human behavior and often helps in identification of a particular individual. In fact, [7] showed convincing results that face recognition rates depend on different types of facial expressions. Our dataset has images with 3 different expressions: joy, anger and disgust. We follow the same experimental setup as in [11] − train on peak frames from all 3 expressions for a randomly selected subset of 30 individuals (out of a total of 55), and test on peak frames of the 3 expressions from the remaining 25 individuals. This random division of the subjects into training and test sets was repeated 20 times (in order to remove selection bias) and the final error rates are obtained by averaging over those
13
from these 20 repetitions. The results tabulated in Table III show that unlike the case of human identification, the frequency domain features have lower misclassification rates than both the D-face measures (again, comparing only with D-face) with significant improvements of over 10% (p-values R(x)
−1, if I(x) ≤ R(x) ,
where I(x) and R(x) respectively denote the imaginary and the real part of the Fourier frequency x. Since each such feature is of one bit per frequency, we call them one bit Facial Asymmetry Code (or, FAC for short). What the features describe is as follows: for a particular frequency, F (x) = 1 implies that that frequency represents more asymmetry than symmetry, and vice versa if F (x) = −1. It is a very compact representation of asymmetry and the features are easy to compute and store requiring much less memory than usual quantified measures. We consider two sets of features: (i) the frequency-wise FAC values - 128 × 128 matrix, and (ii) FAC computed on Fourier transforms of two-row averages of the original image - 64 × 128 matrix, denoted ave FAC. A. Feature Analysis For the exploratory feature analysis (and only for this), we consider a reduced dimension FAC set constructed as follows: the frequency-wise FAC bits are averaged over each row, so that if b(x, y)
19
denotes the bit at frequency (x, y), we compute B(x) =
1 N
P
y
b(x, y) where N denotes the number
of frequencies in each row (or the number of columns). This means that if B(x) > 0 for a particular row, the features in that row are more asymmetric and if B(x) < 0, the features in that row are more symmetric. This feature reduction technique helps in reducing the noise of the frequency-wise values and facilitates studying the feature patterns more clearly. Figure 8 shows the pattern of variation of FAC for three people while expressing different emotions (one frame per emotion). They give a preliminary but convincing idea that these measures may be helpful in recognizing people in the presence of expression variations owing to the existence of somewhat distinct patterns for each person. neutral
0.2
neutral
0.2
0
0
0
−0.2
−0.2
−0.2
0
20
40
60
0.2
80 frequencies anger
100
120
140
0
20
40
60
0.2
80 frequencies anger
100
120
140
0
0
−0.2
−0.2
−0.5
20
40
60
0.2
80 frequencies disgust
100
120
140
20
40
60
0.2
0 −0.2
0
80 frequencies disgust
100
80 frequencies joy
100
120
140
20
40
60
0.2
80 frequencies joy
100
120
140
−0.2
20
40
60
0.5
120
140
−0.2
0
0
−0.5
−0.2
40
60
80 frequencies
(a) Person 1 Fig. 8.
100
120
140
60
80 frequencies anger
100
120
140
0
20
40
60
80 frequencies disgust
100
120
140
0
20
40
60
80 frequencies joy
100
120
140
0
20
40
60
80 frequencies
100
120
140
0.2
0
20
40
0 0
−0.2
0
20
0.2
0 0
0
0.5
0 0
neutral
0.2
0
20
40
60
80 frequencies
100
(b) Person 2
120
140
(c) Person 3
FAC for the 4 expressions of 3 individuals. For the top 4 rows, +ve values denote more asymmetry and -ve values
more symmetry. The x-axis represents the parts of the face from the forehead to the chin while the y-axis shows the rowwise averaged FAC values.
As with the E-faces earlier, we also computed the AVR values of the FAC features and observed that the region above the eyes contain the most discriminative information followed by the nose bridge region. We do not include the plot here due to space constraints.
20
TABLE VIII M ISCLASSIFICATION ERROR RATES FOR THE FAC- BASED FEATURES . Classifiers
FAC
Ave FAC
IPCA
4.24%
4.54%
SVM (linear kernel)
3.94%
5.15%
SVM (polynomial, deg 2)
3.64%
5.15%
HD
4.24%
4.54%
B. Human Identification Results As before, we again train on the neutral frames from all the people and test on the peak fromes from the 3 emotions. Since our features are essentially encoded as bit patterns, it seems natural to use a distance-type metric that is more effective for comparing bit patterns. Once such metric is the popular Hamming distance (denoted by HD), which gives the count of bits that are different in two patterns. More generally, if two ordered list of items are compared, HD is the number of items that do not match identically. In our case, when comparing two FAC patterns, HD outputs the number of bits in two codes that do not match. We use this classifier in addition to IPCA and SVM that we used earlier. The miscalssification error rates appear in Table VIII which show that our proposed FAC results are as good as the I-face results reported in Section V and there is no statistically significant difference between them. The lowest error rates are obtained with SVM, although the HD results are not significantly different from them. Since FAC is much more compact than the I-face representation, this implies a huge gain in terms of efficiency. Just as the I-faces, these results are significantly better than the original D-face results and no worse than the D-face PC results (Table II). Besides, the HD classifier also has a definite advantage over PCA and SVM-based methods with respect to computational resources. It is much less intensive (involves Boolean exclusive-OR operation only) and is much simpler to store than the eigenvectors of PCA or the support vectors of SVM, which require floating point 32-bit representation. Moreover, only half of these codes need to be stored and used due to the conjugate hermitian symmetry arising from
21
TABLE IX S TORAGE REQUIREMENTS OF HD, PCA ( EIGENVECTORS ) AND SVM ( SUPPORT VECTORS ) CLASSIFIERS FOR IMAGES OF DIFFERENT SIZES .
Actual size
Image storage (bits)
PCA/SVM (bits)
HD (bits)
64 × 64
32768
131072
2048
128 × 128
131072
524288
8192
purely real sequences in the spatial domain, according to which frequencies are symmetric around the origin (real part is symmetric and imaginary part is odd-symmetric). So, in essence, we are just using half-bit codes in the matching routine. A comparison of the storage requirements shown in Table IX shows that HD requires upto 64 times less storage space than either PCA or SVM for operation and even 16 times less storage space than the normalized images themselves. This alone establishes a firm basis for the utility of the HD classification algorithm based on FAC for performing face recognition in practice. Efficiency is definitely a crucial factor in classification problems in computer vision since it usually involves high-dimensional images. So, based on the results in this section, we conclude that not only are the FAC features more efficient than the I-faces in terms of representation, but also the HD classifier is more capable than traditional PCA and SVM from storage and computational standpoints, without any compromise on the classification performance.
C. Extension to Verification The HD-based classifer presents the scope for carrying out statistical analysis of the underlying matching mechanism which shows that it may be useful for verification tasks. If X is a random variable denoting the number of matched bits for a pair of FACs using HD, then assuming that the individual bits are uncorrelated, X follows a Binomial distribution with parameters p (probability of a match) and n (total number of bits per image). Now, if Yi denotes the total number of matched bits for person i when matching Ni images of this person, then Yi =
P Ni
i k=1 Xk ,
Xki is the number of matched bits for the k th
22
image of person i. Then Yi ∼ Bin(nNi , pi ), i = 1, . . . , 55, where pi is the probability of a matched bit for person i. pi = p implies that every person has the same probability of match per bit. Note that, HD gives the number of mismatched bits for a pair of FAC, say Z , then X = n − Z . We estimate pi by the sample proportions of match, given by pˆi = yi /nNi , i = 1, . . . , 55. The 95% q pˆi (1−pˆi ) confidence interval for each pi is then given by pˆi ± 1.96 × σˆi , where σˆi = using the normal nNi approximation to binomial since we have a large number of samples. We compute these estimates for two cases: (i) “authentic”, when matching two FACs from the same person, and (ii) “impostor”, where two FACs belonging to two different people are matched. The distribution of Y i in Figure 9 shows that the number of matched bits is much higher for the authentic cases (> 1500 for most cases) than the impostor ones (less than 1000) which is what one expects. Figure 10 shows the sample estimates of Person 1
1
2
Person 2
1.8
1.8
0.8
1.6
1.6
0.7
1.4
1.4
0.6
1.2
1.2
0.5
1
1
0.4
0.8
0.8
0.3
0.6
0.6
0.2
0.4
0.4
0.1
0.2
0 1550
1600 1650 Matched bits
1700
Person 1
100
0 1600
80
90
Person 3
2
0.9
0.2
1700 Matched bits
1800
Person 2
0 1400
1600 1800 Matched bits
2000
Person 3
90
80
70
80
70
60 70
60 50
60
50 50
40 40
40
30 30
30 20
20
20 10
10 0
Fig. 9.
0
500 Matched bits
1000
0
10
87 135 183 231 279 327 375 423 471 519 Matched bits
0
0
200 400 Matched bits
600
Number of matched bits for 3 people: authentic (top) and impostor (bottom).
the matching probabilities of the authentics and the impostors for the 55 individuals in the database, along with the associated 95% confidence intervals. As expected, the estimates for the genuine cases are considerably higher than the impostors ones. However, the upper confidence limits for latter seem a little higher than desirable (greater than 0.5 in some cases). This is attributed to inflated standard deviations caused by variation in the impostor probabilities across people. This happens because some people are more identical looking and hence more likely to be mistaken for each other than others. One way to rectify this will be to consider impostor probabilities for pairs of people taken at a time. Statistical tests
1
1
0.9
0.9
0.8
0.8
0.7
0.7
0.6
0.6
probabilities
probabilities
23
0.5 0.4 0.3
0.4 0.3
0.2
0.2 estimates lower CI upper CI
0.1 0
0.5
0
10
20
30 individuals
40
50
estimates lower CI upper CI
0.1 0
60
0
10
(a) Genuine Fig. 10.
20
30 individuals
40
50
60
(b) Impostor
pˆi and the 95% confidence intervals for all 55 people.
also reveal the existence of significant differences between the bit matching probabilities of the authentics and impostors for all the people. Motivated by the above statisitical analysis, we now use the HD classifier and FAC-based asymmetry features for verification purposes. Verification is performed using a threshold on the number of matched bits per test image and Figure 11 shows the corresponding ROC curve which plots the False Acceptance Rate (FAR) versus the True Acceptance Rate. We observe an Equal Error Rate (EER) as low as 2% at an optimal threshold of 1500 matched bits (uniformly for all people) where the False Acceptance Rate equals the False Rejection Rate (FRR). Thus the FAC features produce better verification results than classification results, which occurs since verification is an easier task involving only 1-to-N comparisons as opposed to N -to-N comparisons for classification. 1 0.9 0.8
False acceptance rate
0.7 0.6 0.5 0.4 0.3 0.2 0.1 0
Fig. 11.
0
0.1
0.2
0.3
0.4 0.5 0.6 True acceptance rate
0.7
0.8
0.9
1
ROC curve for authenticating the images in the Cohn-Kanade database, using the FAC-based asymmetry features.
24
VIII. D ISCUSSION We have shown in this paper that facial asymmetry measures in the frequency domain offer a promising potential as an useful biometric in practice, especially, in the presence of expression variations in face images. An error rate of less than 5% for human recognition under expression changes is impressive and desirable given that the test images are very different from the training ones. This in turn is very important for recognition routines in practice, for example, in biometric authentication applications where surveillance photos captured at airports are expected to be quite diverse with respect to facial expressions. Hence any algorithm that can deal with such variations is supposed to be attractive to users from a practical point of view. Moreover, our features are very simple and easy to compute, and they are based on well-known techniques such as Fourier transforms, phase and edges, which are efficient face recognition tools in computer vision. It helped show that facial asymmetry, which has so far been treated only in the spatial or image domain, also has an analogous frequency domain representation − a fact that can be utilized in signal processing applications too. We have also established an interesting connection between facial asymmetry and the Fourier domain phase. Given the significance of phase in face-based identification, this helps in strengthening the scientific basis for the success of facial asymmetry in telling human beings apart. This relationship is a novel one and have not been explored prior to this. It adds a whole new dimension to the concept of facial asymmetry and lays the ground for much further research in different directions. However, despite this relationship, we need to keep in mind that the frequency information is required as that explicitly describes phase information that can be used for discrimination. Such a connection could not have been established with the help of spatial domain representation of asymmetry. Our proposed one-bit FACs and the HD classifier also proved to be very efficient with regard to computation and storage requirements, in fact much more than other features (D-face, I-face) and other classifiers (PCA, SVM) as demonstrated. In fact, FAC needs less space than the actual gray-scale intensity images also, thus instead of storing or transmitting those, one can compute their FAC and transmit them.
25
This is very useful for mobile, low-bandwidth communication channels and low-memory devices such as smart-cards and system-on-chip implementations. They yielded an error rate of less than 5% also which increases their utility even more. One potential constraint on asymmetry features is that they require precise pre-processing of the database images. However, some pre-procesing steps are necessary in most face recognition routines since real images are usually noisy. What asymmetry requires in addition is a normalization procedure, so as to be able to determine the face midline which acts as the reference point for computing the feaures. However, this is true for any asymmetry metric so as to ensure that we measure the actual intrinsic asymmetry of the face and not the artificial asymmetry artifacts created by improper normalization. In fact, we use the same detection and normalization steps as done for the spatial asymmetry measures in earlier work. It is therefore likely that our method of defining the asymmetry biometrics may be sensitive to the normalization procedure and the detection of the face midline. Hence caution should be exercised in determining this line as accurately as possible which should not be a difficult task. Some future research directions include extension to a bigger database and to video streams. ACKNOWLEDGMENT This work is supported in part by a grant from the Army Research Office to CyLab, CMU. R EFERENCES [1] Voth, D., “In the news: face recognition technology,” IEEE magazine on intelligent systems, 2003, vol. 18, Issue 3, pp. 4-7, May-June 2003. [2] Thornhill, R. and Gangstad, S. W., “Facial attractiveness,” Transactions in Cognitive Sciences, vol. 3, no. 12, pp. 452–460, 1999. [3] Troje, N. F. and Buelthoff, H. H., “How is bilateral symmetry of human faces used for recognition of novel views?” Vision Research, vol. 38, no. 1, pp. 79–89, 1998. [4] Seitz, S.M. and Dyer, C.R., “View morphing,” SIGGRAPH, pp. 21–30, 1996. [5] Gutta, S., Philomin, V., and Trajkovic, M., “An investigation into the use of partial-faces for face recognition,” in International Conference on Automatic Face and Gesture Recognition, Washington D.C., 2002, pp. 33–38.
26
[6] Borod, J.D., Koff, E., Yecker, S., Santschi, C., and Schmidt, J.M., “Facial asymmetry during emotional expression: gender, valence and measurement technique,” Psychophysiology, vol. 36, no. 11, pp. 1209–1215, 1998. [7] Martinez, A.M., “Recognizing imprecisely localized, partially occluded and expression variant faces from a single sample per class,” PAMI, vol. 24, no. 6, pp. 748–763, 2002. [8] Burke, P.H. and Healy, M.J., “A serial study of normal facial asymmetry in monozygotic twins,” Annals of Human Biology, vol. 20, no. 6, pp. 527–534, 1993. [9] Liu, Y., Weaver, R.L., Schmidt, K., Serban, N., and Cohn, J., “Facial asymmetry: A new biometric,” Robotics Institute, Carnegie Mellon University, Tech. Rep. CMU-RI-TR-01-23, 2001. [10] Liu, Y. and Mitra, S., “Experiments with quantified facial asymmetry for human identification,” Robotics Institute, Carnegie Mellon University, Tech. Rep. CMU-RI-TR-02-24, 2002. [11] Mitra, S. and Liu, Y., “Local facial asymmetry for expression classification,” in Proceedings of CVPR, 2004. [12] Kanade, T., Cohn, J.F., and Tian, Y.L., “Comprehensive database for facial expression analysis,” in 4th IEEE International Conference on Automatic Face and Gesture Recognition, 2000, pp. 46–53. [13] Liu, Y., Schmidt, K., Cohn, J., and Mitra, S., “Facial asymmetry quantification for expression-invariant human identification,” CVIU, vol. 91, no. 1/2, pp. 138–159, 2003. [14] Hayes, M.H., “The reconstruction of a multidimensional sequence from the phase or magnitude of its fourier transform,” ASSP, vol. 30, no. 2, pp. 140–154, 1982. [15] Savvides, M., Vijaya Kumar, B.V.K., and Khosla, P., “Face verification using correlation filters,” in 3rd IEEE Automatic Identification Advanced Technologies, Tarrytown, NY, 2002, pp. 56–61. [16] Savvides, M. and Kumar, B.V.K., “Eigenphases vs.eigenfaces,” in Proceedings of ICPR, 2004. [17] Savvides, M., Kumar, B.V.K., and Khosla, P.K., “Corefaces - robust shift invariant PCA based correlation filter for illumination tolerant face recognition,” in Proceedings of CVPR, 2004. [18] Oppenheim, A.V. and Schafer, R.W., Discrete-time Signal Processing.
Englewood Cliffs, NJ: Prentice Hall, 1989.
[19] Belhumeur, P. N., Hespanha, J. P., and Kriegman, D., “Eigenfaces vs. fisherfaces: Recognition using class specific linear projection,” PAMI, vol. 19, no. 7, pp. 711–720, 1997. [20] Burges, C.J.C., “A tutorial on support vector machines for pattern recognition,” in Data Mining and Knowledge Discovery, U. Fayyad, Ed. Boston: Kluwer Academic Publishers, 1998, vol. 2, pp. 121–167. [21] Anderson, T.W., An Introduction to Multivariate Statistical Analysis, 2nd ed.
New York: Wiley, 1984.
[22] Liu, X., Chen, T., and Vijaya Kumar, B.V.K., “Face authentication for multiple subjects using eigenflow,” Pattern Recognition, Special Issue on Biometrics, vol. 36, pp. 313–328, 2003. [23] Turk, M.A. and Pentland, A.P., “Face recognition using eigenfaces,” In Proceedings of CVPR, 1991. [24] Casella, G. and Berger, R.L., Statistical Inference, 2nd ed.
Thomson Learning, 2002.