Proceedings of the 6th International Conference on Systems and Control, University of Batna 2, Batna, Algeria, May 7-9, 2017
SuCF.5
Fault feature extraction and classification based on HEWT and SVD: Application to rolling bearings under variable conditions B. Merainani1 , C. Rahmoune1 , D. Benazzouz1 , B. Ould Bouamama2 and A. Ratni1 Abstract— Achieving an accurate fault diagnosis of rolling bearings under variable working conditions is relatively difficult and challenging topic. Thus, a hybrid fault diagnosis method is proposed. The method combines the Hilbert empirical wavelet transform (HEWT) and the singular value decomposition (SVD). HEWT, a new self-adaptive time-frequency analysis was applied to the vibration signals to obtain the instantaneous amplitude matrices. Then, the singular value vectors, as the fault feature vectors were acquired by applying the SVD. The bearing fault classifications are displayed through the information that got from the first three singular values. Through experimental results, it was concluded, that the proposed method can accurately extract and classify the bearing fault features under variable conditions.
I. I NTRODUCTION As the vital component in the rotating machinery, rolling bearing is most vulnerable to damage. For the purpose of satisfying the production requirements, bearing fault diagnosis is the focus [1]. Generally, the bearings are subjected to variable operating conditions, often very complex. This makes the diagnosis methods less effective. Thus, it is a key requirement to overcome this problem by developing a method that is effective in such operating environment. To date, many researchers have focused on rolling bearings diagnosis under different conditions. One of the principle diagnosis techniques, vibration analysis is manifestly the most commonly used method and also very efficient because the vibration signals carry the important dynamic information of the machines [2-4]. However, not only the signatures of the incipient fault in bearing are too weak and often overwhelmed by noise with obvious non-linear and nonstationary behavior [5], but also, when the bearing operates under different conditions, those signatures will be variable over time. Thus, how to obtain the vital features that robustly indicate the presence of faults from the complex dynamic mechanical signals is the key to solve the problem. To this end, several popular time-frequency analysis methods have been suggested in the literature, such as short-time Fourier transform [6, 7], the Wigner-Ville distribution [8], wavelet packet transform (WPT) [9, 10], Hilbert-Huang transform (HHT) [11, 12], Hilbert empirical wavelet transform (HEWT) [13, 14]. *This work was not supported by any organization 1 B. Merainani, C. Rahmoune, D. Benazzouz and A. Ratni are with the Solid Mechanics and Systems Laboratory (LMSS), University of M’hamed Bougara Boumerdes, 35000, Algeria (phone: +213 670 41 60 21)
[email protected] 2 B. Ould Bouamama est avec le Centre de Recherche en Informatique, Signal et Automatique de Lille (CRISTAL), UMR CNRS 9189, Polytech Lille, Universit´e de Lille 1, Cit´e Scientifique, 59650 Villeneuve d’Ascq, France.
978-1-5090-3960-9/17/$31.00 ©2017 IEEE
Despite the fulfill achievements of the above mentioned methods, due to the working condition variations, the results from time-frequency (TF) analysis are somehow complex and too large. To overcome this problem, Hongmei et al. [11] have used the singular value decomposition (SVD) to reduce the dimension of the instantaneous amplitude matrices extracted by HHT. They have also compared the results with WPT in tandem with principal component analysis (PCA). It is demonstrated that, HHT-SVD performs better than WPTPCA, given the fact that the singular value were found to be insensitive to working conditions. Ye et al. [15] have used the singular value extracted from the local mean decomposition (LMD) which is an adaptive method based on the empirical mode decomposition (EMD). A comparison have been done with EMD in terms of fault feature extraction performance, the authors have noted that LMD-SVD is better than EMD-SVD. Recently, Mourad Kedadouche and Zhaoheng Liu [16], have proposed a promising method by combining WPT and SVD. In this method, WPT was used to decompose the signal to eight frequency bands. For each band, the instantaneous amplitude (IA) and energy (IE) were computed. Finally, the singular values were obtained by computing the SVD. With these methods (HHT, LMD and WPT), however, fitting errors problem caused by cubic splines, the mode mixing and others, are the deficiencies that limit the use of HHT and LMD. So the instantaneous amplitudes and frequencies cannot be estimated accurately. The wavelet packet transform which is an advanced version of the wavelet transform provides a complete level by level TF decomposition of signal [17]. It may not only supply richer information but also supply more promise frequency localization information. However, the WPT is not self-adaptive, it has prescribed dyadic subdivision in time and frequency which may leads to severe damage in identifying transient vibration features that lie transient areas of dyadic packets [18, 19]. Merainani et al. have successfully proposed a hybrid method for early gearbox fault diagnosis called the Hilbert empirical wavelet transform (HEWT) that leads to selforganizing TF plane [13, 20]. The method combines the empirical wavelet transform (EWT) and Hilbert transform (HT) methods. The EWT’s uniqueness is in building an adaptive wavelet filter bank capable of extracting AM-FM components by adaption from the processed signal. It is demonstrated to be superior to EMD [21]. More recently, a combination of HEWT with SVD have shown great potential in analyzing the vibration signals obtained from dynamic simulation of an electromechanical system with effects of
433
PAGES 434 AND 435 ARE NOT AVAILABLE TABLE II: Considered bearing working conditions Working condition
Fault type 0 Hp √ √ √ √
Normal OR, 007 in. IR, 007 in. B, 007 with thein.highest
1 Hp √ √ √ √
2 Hp √ √ √ √
3 Hp √ √ √ √
Frequency (Hz)
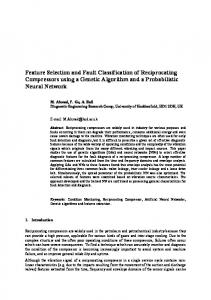
curve energy appears at approximately 360Hz. The maximum amplitude is approximately -10dB. 6000 Fig. 3 (b) shows the HEWT application on the faulty bearing (Outer race 5000 fault) vibration signal. 4000 3000 2000 1000 0 0.05 -90
0.1
-80
0.15 -70
0.2
0.25 Time (s)
-60
0.3
-50
0.35
-40
0.4
0.45
-30
0.5
-20
-10
(a) 6000
Frequency (Hz)
5000
4000
3000
2000
1000
different from that in the normal case. Several instantaneous frequency curves are located approximately in the frequency range [2500-4000 Hz]. That is also observed in both TF distributions of bearings vibration signals with inner race and ball faults shown in Fig. 3 (c) and Fig. 3 (d) respectively. Besides, they present a uniform energy distribution. It is worth toamplitude mentionofthat dominant forfault the mode, outer race maximum 21dB. For the energy inner race is approximately at 2900 Hz to with thefault dominant energy is almost similar thatmaximum of the ball amplitude fault approximately thedominant maximum of 21dB. Foratthe3500 innerHz. race Nevertheless, fault mode, the energy amplitude is approximately 6dB for the at is almost similar to that10dB of thecompared ball faultto approximately ball3500 faultHz. mode. The time-frequency distributions, therefore, Nevertheless, the maximum amplitude is approxivaries under different states. So, the feature matrix be The mately 10dB compared to 6dB for the ball fault can mode. constructed for fault identification. time-frequency distributions, therefore, vary under different states. each So, the can be data constructed for fault Under faultfeature mode,matrix we collected under four operating conditions corresponding to motor speed of 1730, identification. 1750,Under 1772, each 1797 fault RPM. mode, Each data set is divided 20 four we collected data into under groups of data. So, we end up with 320 samples. HEWT operating conditions corresponding to motorThe speed of 1730, is used decompose each 20 modes, 1750,to1772, 1797 adaptively RPM. Each datasimple set istodivided into 20 thegroups instantaneous amplitude matrices were then obtained of data. So, we end up with 320 samples. Theand HEWT the feature matrix M was constructed. Finally, the singular is used to decompose adaptively each simple to 20 modes, values could be acquired by computing the SVD. the instantaneous amplitude were then obtained Table 3, partly gives the faultmatrices feature values obtained by and the feature matrix M was constructed. Finally, the singular HEWT-SVD for an operating speed of 1772 RPM, each values couldthe be first acquired by computing vector contains three singular values. the SVD. TABLE III. TABLE
AULT FEATURE OBTAINED BY HEWT-SVD III:FFault featureVALUES values obtained by HEWT-SVD
0 0.05
(b)
-80
0.1
-70
-60
0.15 -50
0.2
0.25 Time (s)
-40
-30
0.3
0.35
-20
0.4
-10
0
10
0.45
0.5
20
30
Fault feature values Condition
6000
1
4.3649 0.8361 0.0892
4.2804 1.0597 0.0924
4.3268 1.0178 0.0944
OR, 0.007 in.
40.2396 5.0164 2.6362
42.3058 4.9703 2.2202
40.9587 5.1628 2.8252
40.3040 5.2067 2.6250
IR, 0.007 in.
19.4628 4.8559 3.4933
19.4199 4.8336 3.3462
19.4231 4.9708 3.4046
19.4371 5.0027 3.3839
B, 0.007 in.
9.2145 1.8637 1.0035
9.4982 1.7768 1.0347
9.0008 1.7069 1.1246
9.7338 1.7240 1.1862
Frequency (Hz)
2000 1000
0
0.05
0.1
0.15
0.2
0.25
0.3
0.35
0.4
0.45
0.5
Time (s)
(c)
-60
-50
-40
-30
-20
-10
0
10
6000
Frequency (Hz)
5000 4000
Fault feature values
3000
Fault feature values obtained by HEWT-SVD
5
6
7
8
2000 1000
Normal
4.1700 1.0024 0.0936
4.2456 0.9483 0.0976
4.1411 0.8735 0.0957
4.2532 1.0495 0.0946
OR, 0.007 in.
41.9215 4.9852 2.4820
39.0283 5.0868 2.6086
41.8598 5.1417 2.8554
40.4902 5.0713 2.5061
IR, 0.007 in.
19.3249 4.5995 3.4227
19.2656 4.6402 3.2773
19.1943 4.9325 3.3078
18.9901 4.8488 3.3616
0 0
0.05
0.1
0.15
0.2
0.25
0.3
0.35
0.4
0.45
0.5
Time (s)
(d)
4
4.1260 0.7922 0.0941
4000
0
3
Normal
5000
3000
2
-90
-80
-70
-60
-50
-40
-30
-20
-10
0
Fig. 3: HEWT results, TF distribution of healthy bearing (a), defective bearings: IR fault (d), OR fault (c), Ball fault (d). Figure 3. HEWT results, TF distribution of healthy bearing (a), defective bearings: IR fault (d), OR fault (c), Ball fault (d).
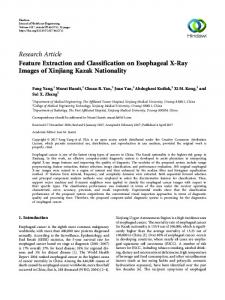
The time-frequency structure in Fig. 3 (b) is far curve with the highest energyshown appears at approximately different frommaximum that in the normal case.is Several instantaneous 360Hz. The amplitude approximately -10dB. B, 0.007 in. 9.3241 8.8678 9.5417 9.4129 frequency curves the are HEWT located approximately frequency Fig. 3 (b) shows application oninthethefaulty bearing 1.7932 1.7440 1.6497 1.6559 range Hz]. Thatsignal. is also observed in both TF (Outer[2500-4000 race fault) vibration 1.1148 1.0960 1.0743 1.0932 distributions of bearingsstructure vibrationshown signalsinwith The time-frequency Fig. inner 3 (b)race is far and ball faults shown in Fig. 3 (c) and Fig. 3 (d) Figure 4(a) shows the projection of the first three singular respectively. Besides, they present a uniform energy values obtained by HEWT–SVD for datasets in table 2. The 436 978-1-5090-3960-9/17/$31.00 ©2017 IEEE distribution. It is worth to mention that dominant energy for the outer race fault is approximately at 2900 Hz with classification results can be seen from the figure. As we can see, even if the operating speed vary, for one certain fault
Table III, partly gives the fault feature values obtained HT. The feature matrix was then constructed and the feature by HEWT-SVD for an operating speed of 1772 RPM, each vectors containing the singular values were obtained using vector contains the first three singular values. SVD. The results are shown in Fig. 4(b). that the gaps between clusters for the four fault conditions classification. We conclude that, the proposed HEWT-SVD Figureare4(a) shows the projection of the first three singular A Major fluctuations were noticed the feature vector satisfactory, thus a good classification. Comparison method performs much better than HHT-SVD method,inand that the gaps between clusters forHHT–SVD the four fault conditions classification. We conclude that, theof proposed HEWT-SVD between the HEWT-SVD and feature thus, more suitable fault diagnosis rolling bearings. values obtained by HEWT-SVD for datasets infor Table II. The in case offor healthy bearing, bearing with OR and IR fault are satisfactory, thus a good classification. Comparison method performs much better than HHT-SVD method, and extraction. classification results can be seen and fromHHT–SVD the figure. we canthus, modes, which mean that ofthe working between the HEWT-SVD forAs feature more suitable for diagnosis rolling bearings.condition variations IV.fault CONCLUSION Comparison between the HEWT-SVD and HHT–SVD see, evenextraction. if1) the operating speed vary, for one certain fault affect the feature vectors. Consequently, the gaps between Rolling bearing diagnosis under variable operating for feature extraction IV. CONCLUSION mode, the singular values extracted by HEWT-SVD present clusters relatively may give unsatisfactory 1) Comparison between the HEWT-SVD and HHT–SVD conditions has are always been ansmall issueand andthat problematic Rolling bearingconstitute diagnosis variable operating In feature thisof case study, the proposed compared a high degree coincidence. On themethod other was hand, it is clear for extraction classification. We conclude that, proposed HEWT-SVD challenge. These our under motivation tothe propose a conditions has always these been difficulties. an issue andTheproblematic another widely used method HHT–SVD in terms of method to overcome method that the with gaps between clusters for the four fault conditions method performs much better than HHT-SVD method, and In this case study, theThe proposed method compared challenge. These constitute our motivation to propose a performance evaluation. HHT–SVD was was implemented combines the HEWT and SVD. Experimental vibration with another widely used method HHT–SVD in terms of are satisfactory, thus a good classification. thus, more suitable for fault diagnosis of rolling bearings. method to overcome these difficulties. The method on the same data sets and the results are shown in Fig. 4(b). signals of bearings that operate under variable conditions performance evaluation. The HHT–SVD was implemented on the same data sets and the results are shown in Fig. 4(b). 4
(a) 3
(M) 2
4
3
3
(M) 2 3
1
0 10
1
combines HEWT using and SVD. Experimental vibration have been the analyzed HEWT. The instantaneous signals ofand bearings that matrices operate under variable amplitude frequency thus been conditions obtained. V. have C ONCLUSIONS have SVD been has analyzed using HEWT. Theto instantaneous Then, been computed in order extract the amplitude and frequency matrices have thus been obtained. features for classification. A comparison has beenvariable studied operating conRolling bearing diagnosis under Then,HHT-SVD, SVD has been computed in order extract the the with and the been obtained resultstoand show ditions has always an issue problematic challenge. features forofclassification. comparison has in been studied robustness HEWT-SVD Aover HHT-SVD terms of These constitute our motivation to propose a method to overwith HHT-SVD, andEWT-SVD the obtained the feature extraction. The methodresults is thusshow suitable robustness of HEWT-SVD over HHT-SVD in terms of come these difficulties. The method combines the HEWT and and efficient for fault diagnosis of rolling bearings and show feature extraction. The EWT-SVD methodmachinery is thus suitable promise for applications in other rotating fault SVD. Experimental vibration signals of bearings that operate and efficient for fault diagnosis of rolling bearings and show diagnosis. under variable conditions have machinery been analyzed promise for applications in other rotating fault using HEWT. diagnosis. The instantaneous amplitude and frequency matrices have REFERENCES
thus been obtained. Then, SVD has been computed in order Liao, B. “Machinery fault diagnosis based”, Metallurgical Industry REFERENCES Press, 2005, p. 62-57. to extract the features for classification. A comparison has 0 0 (M) [1] MCINERNY Liao, B. “Machinery based”, signal Metallurgical Industry 1 50 [2] S.A., DAIfault Y. diagnosis “Basic vibration processing for 5 40 (a) 30 (M) Press, 2005, p. 62-57. been studied with HHT-SVD, and the obtained results show 20 bearing fault detection”, IEEE Trans. Educ., 2003, 46, p. 149-156. 2 10 0 0 (M) 1 [2] ZHU, MCINERNY DAIof Y. HEWT-SVD “Basic signal processing for [3] De, GAO,S.A., Qingwei, SUN, Dong,vibration et al. “A detection method for the robustness over HHT-SVD in terms of bearing faults fault detection”, Trans. Educ., 2003, 46, p. 149-156. (b) bearing using nullIEEE space pursuit and S transform”. Signal feature extraction. The HEWT-SVD method is thus suitable Processing, 2014, 96, p. 80-89. [3] ZHU, De, GAO, Qingwei, SUN, Dong, et al. “A detection method for 4 bearing H, faults using S,null space pursuit S transform”. Signal [4] Saruhan Sandemir Çiçek A, diagnosis Uygur İ.and “Vibration analysis of and efficient for fault of rolling bearings and show Processing, 2014, 96, p. defects”. 80-89. J Appl Res Technol, 2014, 12, :p. rolling element bearings 4 3 promise for applications in other rotating machinery fault 384-95. [4] Saruhan H, Sandemir S, Çiçek A, Uygur İ. “Vibration analysis of rollingJinglong, element bearings J Appl Technol,bearing 2014, 12, [5] CHEN, PAN, Jun,defects”. LI, Zipeng, et al.Res “Generator fault:p. diagnosis. 3 384-95. for wind turbine via empirical wavelet transform using (M) 2 diagnosis 3 vibration PAN, signals”. 2016, 89, p. 80-92.fault [5] measured CHEN, Jinglong, Jun,Renewable LI, Zipeng,Energy, et al. “Generator bearing (M) 2 diagnosis for wind turbine via empirical wavelet transform using [6] COCCONCELLI, Marco, ZIMROZ, Radoslaw, RUBINI, Riccardo, et 3 R EFERENCES 1 vibration signals”. 2016, 89, al.measured “STFT based approach for Renewable ball bearingEnergy, fault detection inp.a 80-92. varying motor”. In :Marco, Condition Monitoring of Machinery in Non-et [6] speed COCCONCELLI, ZIMROZ, Radoslaw, RUBINI, Riccardo, 1 Liao, “Machinery fault diagnosis Metallurgical Industry Stationary Operations. Springer Berlin Heidelberg, 2012. p.based”, 41-50. al.[1] “STFT basedB. approach for ball bearing fault detection in a varying 0 8 Press, In 2005, p. 62-57. speed motor”. : Condition Monitoring of Machinery [7] KAEWKONGKA, T., JOE, Y. H., RAKOWSKI, R. T., et in al. Non“A 6 50 Stationary Operations. Springer 2012. p.continuous 41-50. signal processing for 40 comparative study of short timeBerlin Fourier and [2] MCINERNY S.A., DAIHeidelberg, Y.transform “Basic vibration 4 0 30 20 8 2 transform for monitoring”. International [7] wavelet KAEWKONGKA, T.,bearing JOE, Y.condition H., RAKOWSKI, R. Educ., T., et al.2003, “A 46, p. 149-156. 10 bearing fault detection”, IEEE Trans. 6 (M) 50 0 0 2 (M) Journal of COMADEM, 2003, time 6 (1), Fourier p. 41-48.transform and continuous 40 comparative study of short 4 1 30 [3] ZHU, De, GAO, Qingwei, SUN, Dong, et al. “A detection method 20 2 wavelet transform bearing condition monitoring”. International 10 [8] NaimBaydar, AndrewforBall. “A comparative study of acoustic and (M) 0 0 bearing faults using null space and S transform”. Signal (M) Journal for ofsignals COMADEM, 2003, 6of (1), p. 41-48. Outer-race fault (0 Normal (0 HP)2 vibration in detection gear failures usingpursuit Winger-Ville 1 HP) Processing, 96,comparative p. 80-89. Mech Syst 2014, Signal Process, 2001, 15, p. 1091-1107. [8] distribution”. NaimBaydar, Andrew Ball. “A study of acoustic and o Outer-race fault (1 HP) o Normal (1 HP) ˙I diagnosis Outer-race fault (0 HP) Normal(2(0HP) HP) signals in of S, gear using Winger-Ville [4] Saruhan H, detection Sandemir c¸ic¸failures ek A, Uygur “Vibration analysis of rolling [9] N.vibration Nikolaou, I. Antoniadis. “Rolling element bearing fault ∗Normal ∗Outer-race fault (2 HP) distribution”. Mech Syst Signal Process, 2001, 15, p. 1091-1107. o Outer-race fault (1 HP) Normal(3(1HP) HP) using wavelet packets”. NDT &defects”. E Int, 2002,J35 (3), p.Res 197-205. element bearings Appl Technol, 2014, 12, :p. 384-95. +oNormal + Outer-race fault (3 HP) [9] GOMEZ, N.[5] Nikolaou, Antoniadis. “Rolling element bearing fault diagnosis ∗ Normal (2 HP) ∗ Outer-race fault (2 HP) [10] MariaI. Jesus, CASTEJON, et GARCIA-PRADA, CHEN, Jinglong, PAN,Cristina, Jun, LI, Zipeng, et al. “Generator bearing +Inner-race fault (0 HP) Rolling element fault (0 HP) using wavelet packets”. NDT & E Int, 2002, 35 (3), p. 197-205. Juan Carlos. “Incipient Faultfor Detection Bearings through the usewavelet of Normal (3 HP) + Outer-race fault (3 HP) fault diagnosis wind in turbine via empirical transform using o Inner-race fault (1 HP) o Rolling element fault (1 HP) energy and Neural Networks. Advances in Condition [10] WPT GOMEZ, Maria Jesus, CASTEJON, Cristina, et GARCIA-PRADA, measured vibration signals”. Renewable Energy, 2016, 89, p. 80-92. Inner-race fault (0 HP) Rolling element fault (0 HP) Monitoring of Machinery in Non-Stationary Operations”. Springer: Juan Carlos. “Incipient Fault Detection in Bearings through the use of ∗ Rolling element fault (2 HP) ∗ Inner-race fault (2 HP) [6] Germany, COCCONCELLI, Marco, ZIMROZ, Radoslaw, Rollingelement elementfault fault(3(1HP) HP) Berlin, 2014, p. 63-72.Networks. Inner-race fault (1 HP) +oRolling WPT energy and Neural Advances in Condition RUBINI, Riccardo, +oInner-race fault (3 HP) Monitoring of WANG, Machinery in Non-Stationary Operations”. Springer: et al. “STFTXuan, based approach for ball bearing ∗ Rolling element fault (2 HP) [11] LIU, Hongmei, et LU, Chen. “Rolling bearing fault fault detection in a ∗ Inner-race fault (2 HP) Berlin, Germany, 2014, 63-72. Inusing Figure 4. Projection classification charts of the first three singular values diagnosis under variable Hilbert-Huang transformof Machinery in Nonvarying speedp.conditions motor” : Condition Monitoring + Rolling element fault (3 HP) + Inner-race fault (3 HP) (b) obtained by HEWT-SVD (a), HHT-SVD (b) for different working value decomposition”. Mathematical in [11] and LIU,singular Hongmei, WANG, Xuan, et LU, Chen. “Rolling bearing fault Stationary Operations. Springer BerlinProblems Heidelberg, 2012. p. 41-50. conditions. Engineering, 2014,variable 2014. conditions using Hilbert-Huang transform Figure 4. Projection classification charts of the first three singular values diagnosis under [7] KAEWKONGKA, T., JOE, Y. H., RAKOWSKI, R. T., et al. “A Fig. 4: Projection classification charts of the first three singular obtained by HEWT-SVD (a), HHT-SVD (b) for different working and singularAbdenour, value decomposition”. Problems in [12] SOUALHI, MEDJAHER, Mathematical Kamal, et ZERHOUNI, comparative studymonitoring of shortbased timeonFourier transform and continuous conditions. Engineering, 2014, 2014. values obtained HEWT-SVD (a), HHT-SVD (b) vector for different Noureddine. “Bearing health Hilbert–Huang A Majorby fluctuations were noticed in the feature in wavelet transform for bearing condition monitoring”. International support vectorMEDJAHER, machine, and regression”. IEEE [12] transform, SOUALHI, Abdenour, Kamal, et ZERHOUNI, of healthy bearing, bearing with OR and IR fault working case conditions. Transactions on“Bearing Instrumentation and Measurement, 2015, 64 (1), p. Journal of COMADEM, 2003, 6 (1), p. 41-48. Noureddine. health monitoring based on Hilbert–Huang A Major fluctuations were noticed in the feature vector in modes, which mean that the working condition variations 52-62. transform, support vector machine, regression”. IEEE [8] NaimBaydar, Andrew Ball. and “A comparative study of acoustic and case the of healthy bearing, Consequently, bearing with the ORgaps and between IR fault affect feature vectors. Transactions Instrumentation and Measurement, 2015, 64 (1),ofp. [13] Merainani, B., on Benazzouz, D., & “Early detection vibration signals inRahmoune, detectionC. of gear failures using Winger-Ville modes, which mean that the working condition variations 52-62. clusters are relatively small and that may give unsatisfactory tooth crack damage in gearbox using empirical wavelet transform distribution”. Mech Syst Signal Process, 2001, 15, p. 1091-1107. A. Comparison the HEWT-SVD HHT-SVD affect thebetween feature vectors. Consequently, and the gaps between for[13] Merainani, B., Benazzouz, D., & Rahmoune, C. “Early detection of [9] crack N. Nikolaou, I. Antoniadis. “Rolling element bearing fault diagnosis clusters are relatively small and that may give unsatisfactory tooth damage in gearbox using empirical wavelet transform feature extraction 0 10
(M) 2
5
10
20
30
40
50
[1]
Here, the proposed method was compared with another widely used method HHT-SVD in terms of performance evaluation. The HHT-SVD was implemented on the same data sets. As the number of the intrinsic mode functions (IMFs) in the EMD algorithm is defined by the characteristic and complexity of the analyzed signal, only the first five IMFs were taken and used to get the analytical signal using
978-1-5090-3960-9/17/$31.00 ©2017 IEEE
using wavelet packets”. NDT and E Int, 2002, 35 (3), p. 197-205. [10] GOMEZ, Maria Jesus, CASTEJON, Cristina, et GARCIA-PRADA, Juan Carlos. “Incipient Fault Detection in Bearings through the use of WPT energy and Neural Networks. Advances in Condition Monitoring of Machinery in Non-Stationary Operations”. Springer: Berlin, Germany, 2014, p. 63-72. [11] LIU, Hongmei, WANG, Xuan, et LU, Chen. “Rolling bearing fault diagnosis under variable conditions using Hilbert-Huang transform and singular value decomposition”. Mathematical Problems in Engineering, 2014, 2014.
437