SPECIAL SECTION: INTRAPLATE SEISMICITY
Fault intersections and intraplate seismicity in Charleston, South Carolina: Insights from a 2-D numerical model Abhijit Gangopadhyay and Pradeep Talwani* Department of Geological Sciences, University of South Carolina, Columbia, SC 29208, USA
A simple 2-D numerical model was developed to explain the current seismicity in Middleton Place Summerville Seismic Zone, near Charleston, South Carolina. The model comprises blocks representing the structural framework with elastic properties corresponding to known geology. The blocks were subjected to tectonic loading for seven days along the direction of the maximum horizontal stress field and the resulting pattern of shear stresses, and block rotations successfully duplicated the observed seismicity and fault motion. These results support the idea that in a localized volume of pre-existing weak crust, fault intersections act as stress concentrators, and cause anomalous stress build-up in their vicinity, resulting in the observed seismicity. IN spite of being extensively studied, understanding the cause of intraplate earthquakes continues to remain enigmatic. To better understand the causes of intraplate earthquakes, several models have been proposed over the last three decades. Earlier reviews1–4 address one or more aspect of intraplate earthquakes. However, none of them is successful in explaining all the observed patterns. Hence, newer models continue to emerge. Recent models that address the cause of intraplate earthquakes in New Madrid Seismic Zone (NMSZ) in eastern United States5,6 consider that stress perturbation initiated in the lower crust or upper mantle is transferred to the seismogenic upper crust in a cyclic process, causing earthquakes. An alternative model7 has also been proposed to explain the current intraplate seismicity in NMSZ. In this model stress perturbation occurred in response to the ambient tectonic stress field at and near intersecting faults located in a weak zone in the upper brittle crust. Synthesis of geological, geophysical, and seismological data from 39 intraplate earthquakes spanning 20 intraplate regions showed that intersecting faults are spatially associated with the observed seismicity in majority of the regions4. As reviewed by Talwani8, earlier studies have also noted spatial association of interplate and intraplate earthquakes with fault bends and intersections. Theoretical modeling of stress fields9 and numerical analyses10,11 have further demonstrated that these earthquakes could be associated with stress build-up in the vicinity of such features. Based on this observed spatial association, a causal association *For correspondence. (e-mail:
[email protected]) CURRENT SCIENCE, VOL. 88, NO. 10, 25 MAY 2005
leads to the following testable model12, ‘Intraplate earthquakes occur due to a localized stress build-up in response to plate tectonic forces in the vicinity of intersecting faults which act as stress concentrators within a pre-existing zone of weakness’. We examine this model in light of Middleton Place Summerville Seismic Zone (MPSSZ) in Charleston, South Carolina. Our model does not attempt to explain the initiation, history, genesis or temporal nature of seismicity or deformation in MPSSZ. Instead, it is limited in scope and attempts to explain the location and nature of the current seismicity, with the build-up of stresses between large earthquakes whose return periods are defined by paleoseismology. MPSSZ lies within the intraplate region of eastern North America. It was identified as a distinct zone of seismicity in the South Carolina Coastal Plain based on earlier studies of instrumental seismicity13. The epicenter of the 1886 M 7.3 (ref. 14) Charleston earthquake was located within this zone which is currently the most active zone of intraplate seismicity in the South Carolina Coastal Plain. To better understand the cause of intraplate earthquakes in MPSSZ it has been the subject of multidisciplinary investigations. Recent examples include reviews of tectonic, seismic refraction and reflection, and geologic studies15, seismicity analyses16, paleoseismological investigations17, and geodetic observations18. These studies have greatly improved our understanding and definition of the structural and seismogenic features in MPSSZ. Based on results from these studies we defined the geometry of fault blocks in our simple mechanical model for MPSSZ which we describe next.
2-D distinct element modeling using UDEC A distinct element method was used to model MPSSZ assuming 2-D geometry and using a program called Universal Distinct Element Code (UDEC) written by Itasca Consulting Group, Inc., Minneapolis, MN19. Details of application of this program to an intraplate setting have been discussed earlier7.
Development of the 2-D model As a first step towards development of the model, we represented the geometry and associated parameters that mimic the geologic framework. These are described below. 1609
SPECIAL SECTION: INTRAPLATE SEISMICITY Model geometry Figure 1 a shows the regional structural framework of MPSSZ which lies within the South Georgia rift basin20. The 10 to 12 km long, NW trending Ashley River fault (ARF)
a
b
Figure 1. a, Schematic representation of the regional structural framework of MPSSZ. The solid grey outline indicates the South Georgia rift basin margin adapted from McBride et al.20. WF(N), Woodstock fault North; WF(S), Woodstock fault South; ARF, Ashley River fault. A high density pluton and associated basalt flows are shown as a solid grey circular area. The area bounded by the broken line represents the region of current instrumental seismicity. The solid arrows indicate the direction of the maximum horizontal compression. The star represents the postulated location of the 1886 M 7.3 Charleston earthquake. The boxed area includes the modeled region. b, Magnified diagram of MPSSZ excluding the pluton. The solid red circles represent current seismicity in MPSSZ (South Carolina Seismic Network Catalog 1974– 2002) and are scaled based on magnitude. The solid lines represent the three main faults as described (a). Location of Charleston is shown as a solid square. Locations P and Y are those where strain rate from model results have been computed for comparison with observed geodetic measurements. 1610
intersects the NNE trending Woodstock fault (WF)16,21 which is about 200 km long15 (Figure 1 a), dividing it into its northern branch (WF(N)) and southern branch (WF(S)) (Figure 1 a). Only about a 30 km segment of the WF(N) near the intersection is active seismically (Figure 1 b)15,16,21. The instrumentally located seismicity (1974–2002) in this region lies mostly along the ARF and the southern end of the WF(N), and is concentrated near their intersection (Figure 1). The 2-D block geometry (Figure 2 a) used for modeling the MPSSZ was modified from an outline of the structures in Figure 1 a, and consists of WF(N), WF(S), ARF, and the northern margin of the South Georgia rift basin. The outermost edges of the block measure 50 × 45 km (Figure 2 a). These dimensions were chosen to accommodate the most seismically active part of MPSSZ. The direction of the maximum horizontal stress, SHmax is N 60°E for MPSSZ2,21 (Figure 1 a). For computational convenience of modeling, the block model and SHmax were rotated by 30° clockwise so that SHmax lies along the x-axis (Figure 2 a). The block corners have been rounded with a circle that is tangential to the two corresponding edges at a specified rounding distance from the corner. In practice, the rounding distance is about 1% of the typical block edge length19, 500 m in our model. In our 2-D model we have imposed the commonly used plane stress condition, wherein none of the blocks experience stress in the vertical direction although they can exhibit strain in that direction. The code divides the deformable blocks into triangular finite difference zones using a built-in automatic mesh generator that decides the size of the elements based on the block lengths, specified rounding length, and the memory availability to perform the computations. The mesh representation of our model for MPSSZ superimposed on the block geometry is shown in Figure 2 a. All the blocks in the model are deformable and movable with respect to each other. UDEC calculates the shear stress (τxy) at each node (Figure 2 b), positive when it tends to rotate the block in a counter-clockwise manner, i.e. by left-lateral strike-slip. The code calculates the amplitude and sign of the shear stress at each node to show how the block will rotate and contours to show its spatial variation.
Model parameters Of the constitutive models available, we have utilized the simplest, wherein the blocks conform to the Linearly Elastic Isotropic Model and the joints follow the Joint Area Contact Elastic/Plastic Coulomb Slip Failure Model (see ref. 7 for details). The block assembly was subjected to a horizontal strainrate, whose value was derived from the differential plate velocity measured from geodetic studies. Across MPSSZ, a differential velocity of ~2 mm/year was obtained18 which we have used in our model to provide the driving strain-rate. We have assumed that the velocity gradient is not a function CURRENT SCIENCE, VOL. 88, NO. 10, 25 MAY 2005
SPECIAL SECTION: INTRAPLATE SEISMICITY
a
b
Figure 2. a, Simplified model geometry for MPSSZ with superimposed mesh distribution. The main structural features are indicated as mentioned in Figure 1 a. The solid arrows denote the direction of maximum horizontal compression as applied to the model. b, The shear stress (τxy) is calculated at each node. It is positive when it tends to rotate the block in a counter-clockwise direction.
of depth and hence the whole block can be subjected to the same horizontal stress field.
Model properties Input parameters for the model calculations include elastic moduli and density for the blocks. To estimate these we utilized values of the P and S wave velocities, VP, and VS, the velocity ratio, VP/VS, and density obtained from gravity modeling respectively and derived the corresponding values of the moduli using the formulae: µ = ρ(VS)2 and, k = ρ(VP)2 – (4/3)µ, where µ = shear modulus, k = bulk modulus, and ρ = density. Based on inversion of a combination of earthquake and travel time data from quarry blasts, Talwani21 concluded that the P-wave velocity, Vp, in the seismogenic zone of MPSSZ within the rift basin is ~6.0 km/s, whereas seismic refraction studies in the area22 yielded P-wave velocities of 6.0–6.4 km/s for the crystalline basement below 700 m depth. Seismic reflection surveys extending across South Carolina and Georgia from the Appalachians to the Atlantic coast23 also indicate a P-wave velocity of ~6.0 km/s for the crystalline basement outside the rift. In our model we have utilized a P-wave velocity, VP = 6.0 km/s for all blocks, both inside and outside the South Georgia rift basin. From instrumental seismicity studies utilizing P, S, converted S waves, and Wadati plots, Garner16 obtained an average VP/VS ratio of 1.78 for the underlying crystalline rocks below the sediments in the MPSSZ within the South Georgia rift basin. In our computations we have used this value for the VP/VS ratio, both inside and outside the South Georgia rift basin. CURRENT SCIENCE, VOL. 88, NO. 10, 25 MAY 2005
Wildermuth24 constructed a forward structural model of MPSSZ within the South Georgia rift basin using gravity, borehole, and seismic refraction data as constraints. The density of the rocks below about 1 km of sediments to about 3 km depth was taken to be 2700 kg/m3. We utilized this value of density for the blocks, both within and outside the rift. Thus, using these values of VP, VP/VS, and density we computed the bulk and shear moduli (k = 56.29 GPa, µ = 30.67 GPa) for the various blocks, both within and outside the rift. Other input parameters required for modeling the deformation behavior of the rocks are properties of the faults (treated as joints). These include friction angle, normal and shear stiffnesses, and cohesion. The basis for choosing the values of these parameters for our model computations is described next. Based on gravity and magnetic studies, in MPSSZ, the basement rocks are considered to be similar to those exposed in the Piedmont which is predominantly made up of schists and gneisses except for the extensive intrusions13. This inference was also confirmed by results from borehole studies25. The seismogenic parts of the Woodstock and Ashley River faults lie in the metamorphic, gneissic crystalline basement. Based on seismic reflection data which helped delineate the South Georgia rift basin, the rift boundary faults also extend into the crystalline basement20. Therefore, the rift boundary faults were considered to be faults in primarily metamorphic crystalline basement. Barton26 tabulated the basic friction angles for various rock types based on experimental results in the laboratory. According to him the friction angle for gneiss ranges between 25°–29°. In our model the rift boundary fault and the 1611
SPECIAL SECTION: INTRAPLATE SEISMICITY
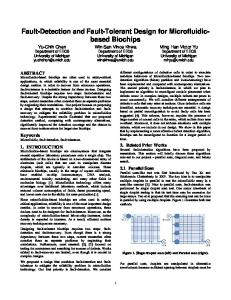
Figure 3.
Shear stress contours (N/m2) for MPSSZ after tectonic loading time of seven days.
Woodstock and Ashley River faults in MPSSZ have been assigned a friction angle of 27° based on the mean of the range given for gneiss by Barton26. Rosso27 compared joint stiffness laboratory measurements and previously published results of tests on jointed samples of quartz diorite. He obtained joint normal and shear stiffnesses of 101 GPa/m and 76 GPa/m respectively at applied stresses of 10.5 MPa. We have used these stiffness values for the rift boundary fault and the Woodstock and Ashley River faults in MPSSZ. Since the stiffness values vary with magnitudes of applied stress level, we experimented with values that were higher (twice and five times), significantly higher (ten times), lower (half and one-fifth), and significantly lower (one-tenth) than the aforesaid values. The model results showed no qualitative change in the pattern of stresses and did not affect the overall conclusions of this paper. McGarr and Gay28 concluded from different types of stress measurements made in southern Africa, North America, and Australia that the lower limits of maximum shear stress, (S1–S3)/2 at mid-crustal depths are 20 to 40 MPa. S1 and S3 are the maximum and minimum principal stresses respectively. Based on measurements made in the KTB borehole in Germany and assuming a strike-slip regime and coefficient of friction of 0.7, Zoback et al.29 suggested that at mid-crustal depths the differential stress could reach values of ~300 MPa implying that the upper bound for maximum shear stress at those depths could be ~150 MPa. They also suggested that similar conditions may exist in the seismically active part of eastern North America. Hence, based on these studies we assumed that the maximum shear stress in MPSSZ in the brittle crust from the surface up to mid-crustal depths lies between 20 MPa and 150 MPa. We assume the joint cohesion for the seismogenic faults 1612
in MPSSZ to be zero at these stress levels30,31. For the aseismic rift boundary fault we arbitrarily assign a joint friction of 0.5 MPa.
Limitations of the model A notable limitation of this model is the fact that it is twodimensional. Artifact boundary effects or the edge effects also are present in the model. These manifest themselves as comparably high stress values near the outermost boundaries of the blocks (Figure 3). The educational version of UDEC program has limited memory that prohibits extensive computations, and thus, our ability to run the model for a geologically realistic loading time. The model was run for tectonic loading times corresponding to one, two, four, and seven days. The calculated stress build-up was linear with time and did not negate the conclusions of the model. For further analysis we used the longest run, corresponding to tectonic loading of seven days.
Model results and their analysis The modeling outputs were analysed in terms of the resulting stresses and block rotations in response to a tectonic loading of seven days. The MPSSZ model geometry has been superimposed for convenience of comparison. The magnitudes of the stresses, and block rotations represent relative values and were used to make tectonic interpretations.
Shear stress Shear stresses (τxy) were obtained at each node of the mesh (Figure 2 a). Recall that this is a two-dimensional model CURRENT SCIENCE, VOL. 88, NO. 10, 25 MAY 2005
SPECIAL SECTION: INTRAPLATE SEISMICITY and positive and negative values suggest counter-clockwise and clockwise block rotation respectively. The stress values at the nodes were contoured with a contour interval of 1 N/m2 (Figure 3). Shear stresses (–4 to –6 N/m2) seen at locations near the edges of blocks are artifacts of boundary effects in the calculations, and are ignored. The shear stress values range from –9 N/m2 near the intersection of the Ashley River and Woodstock (South) faults to –5 N/m2 near the intersection of the Ashley River and Woodstock (North) faults. These larger shear stress values are concentrated in very small regions near the intersections. These locations have the greatest potential for loading the faults.
Block rotations Different shear stresses acting on the block boundaries will tend to cause strike-slip movements. If the movement of one block is obstructed by another, the result will be rotation and uplift. Our model being two-dimensional we do not observe uplift but did note some evidence of block rotation. The direction of rotations of each block is shown in Figure 4. The maximum rotation obtained was 3.17 × 10⁻⁹ degrees counter-clockwise for the block south of the WF(S). The rotation ‘arc’ is scaled to a maximum arc of 45°. The block rotations are shown with respect to the perpendicular to the SHmax direction. They are intended to provide a sense of direction of block movement. The results indicate that the block outside of the rift shows almost no rotation whereas the blocks inside the rift show counterclockwise rotation. Inside the rift the counter-clockwise
rotation of the blocks south of the Woodstock (North) and (South) faults implies right-lateral strike slip motion along the faults. The directions of block movement are consistent with shear stress directions. The portion of the ARF between WF(N) and WF(S) is too small to detect the sense of motion. Furthermore the counter-clockwise rotation of the block south of the Woodstock (North) fault is consistent with the counter-clockwise offset of that fault as observed in other independent geological and seismological studies15,16.
Maximum shear stress plots along the faults The concentration of shear stresses near the intersections suggested that it is not uniform along the faults. To study its variation, we plotted the maximum shear stress along the Woodstock (North), Ashley River, and Woodstock (South) faults at the end of a tectonic loading period of seven days (Figure 5, curves a–c). The negative values of maximum shear stresses indicate right lateral movement along the fault. The absolute value of maximum shear stress along the plane of the Woodstock fault (North) (curve a) between its intersection with the Ashley River fault (P) and very close to the block edge (M) is nearly constant and lies between 22 N/m2 and 20 N/m2. The largest, absolute value of maximum shear stress on this profile is observed at the intersection of Woodstock fault (North) and Ashley River fault (22 N/m2) (P). Curve b shows the variation of maximum shear stress along the plane of the Ashley River fault between its intersection with the Woodstock fault (North) (P) and southern block boundary (Q). The positive values of maximum shear stress along the Ashley River fault plane indicate left lateral strike-slip movement along the fault. It increases steadily from the end (P) to its maximum value at Y (45 N/m2), which is the intersection of Ashley River and Woodstock (South) faults. It reduces to about 5 N/m2 away from this intersection towards the southern block boundary. Similarly, curve c shows the variation of maximum shear stress along the plane of Woodstock fault (South) between its intersection with the western block boundary (X) and Ashley River fault (Y). The negative values of maximum shear stress along the Woodstock (South) fault plane indicate right lateral movement along the fault. The absolute value of maximum shear stress steadily rises from 2 N/m2 at its intersection with the western block boundary (X) to 25 N/m2 at its intersection with the Ashley River fault (Y). We discuss the tectonic interpretation of these results next.
Discussion
Figure 4. Block rotations for MPSSZ model after tectonic loading of seven days. The arrows indicate the direction of rotation. CURRENT SCIENCE, VOL. 88, NO. 10, 25 MAY 2005
Figures 3 to 5 show the results of our modeling. The shear stress contours (Figure 3) show both positive and negative values which are indicative of left-lateral and right-lateral movements respectively. The sense of block movement 1613
SPECIAL SECTION: INTRAPLATE SEISMICITY
Figure 5. Maximum shear stress plots along (a) Woodstock fault (North) (b) Ashley River fault (c) Woodstock fault (S). The threshold maximum shear stress is ± 20 N/m2. The locations of the faults and points, X, Y, P. Q, M are shown in the corresponding block model. The negative values of maximum shear stress indicate right-lateral movement along the fault whereas positive values of maximum shear stress indicate left-lateral movement along the fault.
(Figure 4) is consistent with the inferred sense of movement along the faults. Figure 5 shows how the maximum shear stresses vary along the fault planes. We use it to compare with the observed seismicity in MPSSZ (Figure 1 b). We make the tacit assumption that the distribution of stresses on the faults is representative of the seismicity pattern. Comparing the stress profiles along the faults (Figure 5) with seismicity (Figure 1 b) we observe excellent correspondence. The absolute values of the shear stresses depend on the model parameters, and those obtained in Figure 5 are representative, however their relative values are instructive. The negative maximum shear stress values along the Woodstock (North) and (South) faults (Figure 5 curves a and c) indicate right-lateral strike-slip movement, in agreement with the seismicity observations16. The positive maximum shear stress values along the Ashley River fault suggest left-lateral strike-slip motion, which has also been inferred from offset of walls of Fort Dorchester32. The dominant motion on the Ashley River fault is uplift, which this 2-D model is incapable of replicating. The motions on the Woodstock fault are also indicated by the directions of block rotations (Figure 4). 1614
The magnitudes of maximum shear stresses are not uniform along the faults. They are largest in the vicinity of intersections with other faults. Interestingly, when the seismicity (Figure 1 b) is compared with the stress profiles (Figure 5), we find that it occurs at locations along the faults where the absolute stress value is 20 N/m2 or greater. This value is a consequence of the modeling parameters, and it indicates that there is a stress threshold for the onset of seismicity. In Figure 5 we also compare the stress changes along the fault with respect to this threshold value. For the Woodstock fault (North) the largest, absolute value of shear stress is at P (22 N/m2) (Figure 5, curve a), the intersecting point with Ashley River fault, where seismicity is intense. Seismicity also occurs along the length of the Woodstock fault (North) for about 30 km15,21,32 (Figure 1 b), where the absolute value of the maximum shear stress is steady at about 20 N/m2, equal to the threshold value (Figure 5, curve a). Along the Ashley River fault, the maximum shear stresses equal or exceed 20 N/m2 for about one-half of the length of the fault (Figure 5, curve b), the location of intense seismicity (Figure 1 a). The largest, maximum shear stress is at Y (45 N/m2), its intersection with the Woodstock fault (South) (Figure 5, curve b), wherein seismicity CURRENT SCIENCE, VOL. 88, NO. 10, 25 MAY 2005
SPECIAL SECTION: INTRAPLATE SEISMICITY is largely concentrated. Along the Woodstock fault (South) the absolute value of maximum shear stress is about 2 N/m2 at its junction with the block edge (X), builds to about 15 N/m2 and remains steady along most part of the fault, and rises to the largest absolute value (25 N/m2) at its intersection with the Ashley River fault (Y) (Figure 5, curve c). This largest absolute value at Y is greater than the threshold value, and is the location of intense seismicity (Figure 1 b). To see if our calculated stresses were physically reasonable, we computed the strain rates predicted by the model and compared them with the observed geodetic results in MPSSZ. Trenkamp et al.18 obtained a shear strain rate of ~0.02 µradian/year for the MPSSZ using geodetic observations. Figure 1 b shows the locations of two points (P and Y) where we computed the strain rates from our model results. The study area of Trenkamp et al.18 includes these two points. To compare the results of our model we calculated the annual strain rate at these points from the maximum shear stress values obtained from the model at those points (Figure 5). The absolute values of the maximum shear stresses at P, and Y are 22, and 45 N/m2 (Pa) respectively for a tectonic loading cycle of seven days. Based on shear modulus of the rocks at these points (30.67 GPa), the annual strain rates at P, and Y are 0.075, and 0.153 µradian/ year respectively. These values are in general agreement with the results of the geodetic surveys.
Conclusions To explain the current seismicity in the Middleton Place Summerville Seismic Zone, we developed a simple 2-D model – wherein the fault geometry was represented by blocks. These were subjected to tectonic loading for seven days along the direction of the maximum horizontal stress and the resultant pattern of the shear stresses, and block rotations were examined. The results obtained from this simple model can explain many first order observations at MPSSZ. The largest shear stresses were obtained at, and near the fault intersections, and they indicated the tendency of rotation of the blocks and the sense of movement along the faults. The model results duplicated the sense of movements along the Woodstock (North), Ashley River, and Woodstock (South) faults. Because our model is two-dimensional, uplift along the Ashley River fault was not observed. The distribution and sign of maximum shear stress along the faults was consistent with the observed seismicity. The largest maximum shear stress occurred at the location of most intense seismicity. The strain rate obtained from linear extrapolation of the model results was in general agreement with that observed from geodetic surveys. Overall, the model results support the idea that fault intersections within the pre-existing weak crust can be the focus of stress accumulation when subjected to plate tectonic forces, and that CURRENT SCIENCE, VOL. 88, NO. 10, 25 MAY 2005
these intersections then become locations of strain build-up causing earthquakes. 1. Talwani, P., Characteristic features of intraplate earthquakes and the models proposed to explain them. In Earthquakes at NorthAtlantic Passive Margins: Neotectonics and Post-Glacial Re-bound (eds Gregersen, S. and Basham, P. W.), NATO ASI Ser. C, Mathematical and Physical Sciences, 1989, pp. 563–579. 2. Zoback, M. L., Stress field constraints on intraplate seismicity in Eastern North America. J. Geophys. Res., 1992, 97, 11,761–11,782. 3. Talwani, P., Fault geometry and earthquakes in continental interiors. Tectonophysics, 1999, 305, 371–379. 4. Gangopadhyay, A. and Talwani, P., Symptomatic features of intraplate earthquakes. Seismol. Res. Lett., 2003, 74, 863–883. 5. Kenner, S. J. and Segall, P., A mechanical model for intraplate earthquakes: Application to the new Madrid seismic zone. Science, 2000, 289, 2329–2332. 6. Pollitz, F. F., Kellogg, L. and Burgmann, R., Sinking mafic body in a reactivated lower crust: A mechanism for stress concentration at the new Madrid seismic zone. Bull. Seismol. Soc. Am., 2001, 91, 1882–1897. 7. Gangopadhyay, A., Dickerson, J. and Talwani, P., A two-dimensional numerical model for current seismicity in the New Madrid Seismic Zone. Seismol. Res. Lett., 2004, 75, 406–418. 8. Talwani, P., The intersection model for intraplate earthquakes. Seismol. Res. Lett., 1988, 59, 305–310. 9. King, G. C. P., Speculations on the geometry of the initiation and termination processes of earthquake rupture and its relation to morphological and geological structure. PAGEOPH, 1986, 124, 567–585. 10. Andrews, D. J., Mechanics of fault junctions. J. Geophys. Res., 1989, 94, 9389–9397. 11. Jing, L. and Stephansson, O., Numerical modeling of intraplate earthquake source by 2-dimensional distinct element method. Gerlands Beitr. Geophys., 1990, 99, 463–472. 12. Talwani, P. and Gangopadhyay, A., Seismogenesis of intraplate earthquakes, Indo-US Workshop on Seismicity and Geodynamics, National Geophysical Research Institute, Hyderabad, 2003, pp. 16–17. 13. Tarr, A. C., Talwani, P., Rhea, S., Carver, D. and Amick, D., Results of recent South Carolina seismological studies. Bull. Seismol. Soc. Am., 1981, 71, 1,883–1,902. 14. Johnston, A. C., Seismic moment assessment of earthquakes in stable continental regions, II, New Madrid 1811–1812, Charleston, 1886 and Lisbon 1755. Geophys. J. Int., 1996, 126, 314–344. 15. Marple, R. T., Discovery of a possible seismogenic fault system beneath the coastal plain of South and North Carolina from an integration of river morphology and geological and geophysical data, Ph D Dissertation, University of South Carolina, 1994, p. 353. 16. Garner, J. T., Re-evaluation of the seismotectonics of the Charleston, South Carolina Area, M S thesis, University of South Carolina, 1988, p. 250. 17. Talwani, P. and Schaeffer, W. T., Recurrence rates of large earthquakes in the South Carolina Coastal Plain based on paleoliquefaction data. J. Geophys. Res., 2001, 106, 6,621–6,642. 18. Trenkamp, R., Talwani, P. and Lapine, L., Seismotectonics of the Charleston, South Carolina region, Final Technical Report, US Geological Survey, 2002, p. 39. 19. Universal Distinct Element Code, version 3.1, ITASCA Corporation, Minneapolis, Minnesota, USA, 1999. 20. McBride, J. H., Nelson, K. D. and Brown, L. D., Evidence and implications of an extensive early Mesozoic rift basin and basalt/ diabase sequence beneath the southeast Coastal Plain. GSA Bull., 1989, 101, 512–520. 21. Talwani, P., Internally consistent pattern of seismicity near Charleston, South Carolina. Geology, 1982, 10, 654–658. 1615
SPECIAL SECTION: INTRAPLATE SEISMICITY 22. Ackermann, H. D., Seismic-refraction study in the area of the Charleston, South Carolina, 1886 earthquake. Studies Related to the Charleston, South Carolina, Earthquake of 1886 – Tectonics and Seismicity, US Geological Survey Professional Paper, 1983, 1313, F1–F20. 23. Behrendt, J. C., Structural interpretation of multichannel seismic reflection profiles crossing the southeastern United States and the adjacent continental margin – Decollements, faults, Triassic(?) basins and Moho reflections. In Reflection Seismology: The Continental Crust (eds Barazangi, M. and Brown, L.), American Geophysical Union Geodynamics Series, pp. 201–214. 24. Wildermuth, E., Potential Field Studies in Northeast South Carolina, M S thesis, University of South Carolina, 2003, p. 153. 25. Gohn, G. S., Geology of the basement rocks near Charleston, South Carolina – Data from detrital rock fragments in lower Mesozoic(?) rocks in Clubhouse Crossroads test hole #3. In Studies Related to the Charleston, South Carolina, Earthquake of 1886 – Tectonics and Seismicity, US Geological Survey Professional Paper, 1983, 1313, E1–E22.
1616
26. Barton, N., The shear strength of rock and rock joints. Int. J. Rock Mech. Min. Sci. Geomech. Abstr., 1976, 13, 255–279. 27. Rosso, R. S., A comparison of joint stiffness measurements in direct shear, triaxial compression, and in situ. Int. J. Rock Mech. Min. Sci. Geomech. Abstr., 1976, 13, 167–172. 28. McGarr, A. and Gay, N. C., State of stress in the earth’s crust. Annu. Rev. Earth Planet. Sci., 1978, 6, 405–436. 29. Zoback, M. D. et al., Upper-crustal strength inferred from stress measurements to 6 km depth in the KTB borehole. Nature, 1993, 365, 633–635. 30. Byerlee, J., Friction of Rocks. PAGEOPH, 1978, 116, 615–626. 31. Homberg, C., Hu, J. C., Angelier, J., Bergerat, F. and Lacombe, O., Characterization of stress perturbations near major fault zones: insights from 2-D distinct-element numerical modeling and field studies (Jura Mountains). J. Struct. Geol., 1997, 19, 703–718. 32. Talwani, P., Macroscopic effects of the 1886 Charleston Earthquake. A Compendium of Field Trips of South Carolina Geology with emphasis on the Charleston, South Carolina area, South Carolina Department of Natural Resources Geological Survey, 2000, pp. 1–6.
CURRENT SCIENCE, VOL. 88, NO. 10, 25 MAY 2005