Fault Slip Through Measurement in Software Development Process Denis Duka, Lovre Hribar Research and Development Center Ericsson Nikola Tesla Split, Croatia
[email protected];
[email protected]
Abstract—The pressure to improve software development process is not new, but in today’s competitive environment there is even greater emphasis on delivering a better service at lower cost. In market-driven development where time-to-market is of crucial importance, software development companies seek improvements that can decrease the lead-time and improve the delivery precision. One way to achieve this is by analyzing the test process since rework commonly accounts for more than half of the development time. A large reason for high rework costs is fault slippage from earlier phases where they are cheaper to find and remove. As an input to improvements, this article introduces a measure that can quantify this relationship. That is, a measure called faults-slip-through, which determines the faults that would have been more cost-effective to find in an earlier phase. Keywords-fault metric; detection, fault latency
I.
faults-slip-through,
early
fault
High amounts of avoidable rework commonly occur when having many faults left to correct in late stages of a project. In fact, research studies indicate that the cost of rework could be decreased by up to 50 percent by finding more faults earlier [2]. Therefore, the interest from industry to improve this area is large. It might appear easy to reduce the amount of rework just by putting more focus on early verification activities, e.g. reviews. However, activities such as reviews and testing are good at catching different types of faults at different stages in the development cycle. Further, some system characteristics such as system capacity and backward compatibility might not be feasible to verify early through, for example, reviews or unit tests. Therefore, the objective should not just be to find and remove all faults as early as possible. Instead, the costeffectiveness of different techniques in relation to different types of faults should be in focus [3].
INTRODUCTION
Research and development of techniques for making software development easier and faster have been going on for as long as software has existed. Still, projects commonly spend at least 50 percent of their development effort on rework that could have been avoided or at least been fixed less expensively. That is, 20-80 percent depending on the maturity of the organization and the types of systems the organization develops [1]. In a larger study on productivity improvement data, most of the effort savings generated by improving software process maturity, software architectures and software risk management came from reductions in avoidable rework. A major reason for this is that faults are cheaper to find and remove earlier in the development process. Omitting early quality assurance results in significantly more faults found in testing. Such an increase commonly overshadows the benefits from omitting early quality assurance. It has also been reported that the impact of defective software is estimated to be as much as almost 1 percent of the Gross Domestic Product (GDP) of the U.S.A. [2]. Further, fewer faults in late test phases lead to improved predictability and thereby increased delivery precision since the software processes become more stable when most of the faults are removed in earlier phases. Therefore, there is a large interest in approaches that can reduce the cost of rework, e.g. make sure that more faults are found earlier.
II.
PURPOSE OF FAULT SLIP THROUGH
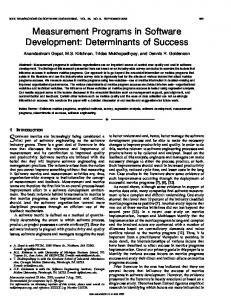
As the quality level of the final product is set at the beginning of the project, a large number of faults can result in project delays and cost overruns. The number of faults in a large software project has a significant impact on project performances. In order to keep project performances, development teams require fast and accurate feedback on the quality at the early stages of the design cycle. Since the primary output of testing is found faults, a possible approach to such an evaluation is to look at differences in fault distributions. Many different measurements exist today aiming either to achieve higher quality or to decrease rework costs during development. One possibility is to measure the number of faults that should have been found in an earlier phase, i.e. Faults Slip Through (FST). Although this method was originally intended for process assessment, it could also be used for quantifying the benefits of an improvement that should result in finding more faults early [3]. Figure 1. demonstrates how the cost of faults typically rises by development stages. The implication of such a cost curve is that the identification of software fault earlier in the development cycle is the quickest way to make development more productive. As already mentioned, the cost of rework
could be reduced up to 30-50 percent by finding more faults earlier. FAULTS REMOVING COST
if the test strategy states that certain types of tests are to be performed at certain levels, the FST measure determines to what extent the test process adheres to this test strategy. This means that all faults that are found later than when supposed are considered as slipped.
COS T
The test strategy, test processes and complete development process define in which phase different kind of faults are supposed to be detected. The primary purpose of measuring FST is to make sure that the test process finds the right faults in the right phase, i.e. commonly earlier. The main effects of doing this are [5]: •
Fewer stopping faults (slipping faults tend to be stopping),
•
Less redundant testing (when finding the right faults in the right phase),
•
Less process variation because fewer faults in late phases leads to improved delivery precision,
•
Avoid doing the same mistakes → supports a learning organization,
•
Improved product quality: only some of the faults slipping from earlier phases are found in Integration & Verification (I&V) part,
•
Earlier and cheaper fault removal.
M
AI N
TE N
AN
CE
DF U
N
Y
TI O EX EC U
AS I
BI LI T
DY FE
ES TU PR
RE Q
U
IR
EM
EN
T
COST
DEVELOPMENT PHASES
Figure 1. Cost of Rework
Fault Slip Through represents the number of faults not detected in a certain activity. These faults have instead been detected in a later activity [4]. Figure 2. visualizes the difference between Fault Latency and FST.
(faults)
Fault Slip Through analysis brings many advantages:
Figure 2. Example od Fault Latency and FST
•
Early and cost effective fault detection,
•
Provides useful feedback regarding fault introduction in product and process,
•
Enables fault slippage measurements which help us to identify improvements areas throughout the development process,
•
Learning from earlier mistakes and avoid doing them again,
•
Less redundant testing and closer test coordination,
•
Improved quality and less stopping Trouble Reports (TR-s),
•
Shorter lead times and improved delivery precision.
The Fault Slip Through process is a way to secure that faults are detected in the right phase. By learning of our earlier mistakes the organization can avoid doing them again. The process also implements mechanisms for enabling future efficiency work.
Fault Slip Through can also be used to:
Right phase means the most cost efficient phase. A general guideline is that it is cheaper to detect faults early in the development process, “earlier is cheaper”. This is not always true since it is also related to a cost to detect faults. Some faults might be more cost efficient to detect later in a development process. When measuring Fault Slip Through, the norm for what is considered right is the test strategy of the organization. That is,
•
Evaluate effectiveness of verification methods and tools,
•
Evaluate and predict product quality in a project,
•
Input to characterize the capability and fault detection profile of an organization.
III.
FAULT SLIP THROUGH AND DEVELOPMENT PROCESS
The FST can be related to the whole software development process, from specification to design and test. The quality of a product is built in during early phases. The test at the end is only meant to be a confirmation of the adherence to the
requirements. However, FST is not supposed to be used just as a measure, it is a concept for continuous improvements. Otherwise its intentions will not be fulfilled [6]. Different kinds of faults are supposed to be found in different phases. The most efficient and cost effective is though to capture the fault close to the introduction. Each development activity has to be responsible for its own errors. An outstanding quality assurance method is reviewing each others work. It is no matter if it is a specification, source code or other kinds of written text. It is much more cost efficient to find faults in reviews and inspections than executing test cases. With the FST measurements we are aiming for to give feedback to the different actors and teams. They have the responsibility to improve their own process and fault prevention strategy.
There are many ways to measure FST and it is up to the user of the process to decide how the measurements shall be performed. Using FST for performance benchmarking of products and organizations is not recommendable because of: •
Product differences: Product maturity, complexity and architecture will affect fault slippage ratios,
•
Process differences: Organizations using parallel testing processes tends to have higher fault slippage,
•
Definition differences: Fault Slip Through might be defined differently.
C. Analyze the Fault Slip Through Once the measurement results are available it is time to analyze the Fault Slip Through results.
A Fault Slip Through process can be divided into the following steps [4]:
FST can be measured on the following ways: •
Phases with low slippage,
A. TR Fault Slip Through Analysis The TR Fault Slip Through analysis shall be made for all TR-s and is an extension of the ordinary TR analysis. This analysis is the base for all further measurements and analyses and can be seen as a part of the daily work.
•
Phases with high slippage.
Five fields have been introduced in the TR analysis in order to do the FST analysis. The five fields are: •
DIDDET – Where the fault was detected,
•
SHODET – Where the fault was supposed to be detected,
•
INTROD – Where the fault was introduced,
•
TC – Was there a Test Case in the SHODET phase,
•
INFO – Free text field for additional information,
B. Measure Fault Slip Through Step two of the Fault Slip Through analysis is to measure fault slippage. Only the DIDDET and SHODET fields shall be used for Fault Slip Through measurements. There are two ways to measure FST: •
Fault slippage from a phase,
•
Fault slippage to a phase.
The project and/or line organization have the responsibility to generate the Fault Slip Through measurements. The Fault Slip Through matrix (as presented in Table 1.) is the source to all measurements and further analysis. Fault Slip Through to a phase is measured vertically in the matrix. The summary of all phases above the measured phase is compared to the total number of TR-s in that phase. Fault Slip Through from a phase is measured horizontally in the matrix. The summary of all phases after the measured phase is compared to the total number of TR-s in that phase.
Phases with low slippage can be used as good practices. Phases with high slippage can trigger an Root Cause Analysis (RCA) in order to identify why there are slippage problems in this phase. D. Identify and Implement Improvements Fault Slip Through is not just a measure, it is a concept for continuous improvements and phases with high fault slippage need to be improved. A Root Cause Analysis is one way to deal with the problems in this phase. An RCA is a problem analysis aimed at investigating why faults were not detected in the phase where they were supposed to be detected. It is the line organization that is responsible to identify improvements, perform RCA-s and implement improvements. E. Reporting and Follow Up Reporting and follow up of Fault Slip Through is important to keep focus on results and implemented improvements. It is up to the process user to decide in what way and how often FST shall be reported. Reporting can be made both by project and/or the line organization. Recommendation is to use already established ways of reporting such as: •
Monthly Reports from Line and Project Management,
•
Line Management meetings,
•
Operating Steering Group (OSG) meetings,
•
Project meetings.
IV.
FAULT SLIP THROUGH GOALS
It is recommended that Fault Slip Through goals are used by the organization. The goals can be set for the entire organization or for a certain phase as follows: •
Get baseline,
•
Set improvement goals (e.g. FST Verification shall decrease by 10%),
•
Determine how to achieve the goal (e.g. perform RCA on phases with high slippage and identify and implement suitable improvements),
•
Decide how and when to follow up goals. V.
to
Success factors/important considerations From experience, the concept will not have the intended effect in practice unless the factors below are adhered to. The lists further below outlines some major success factors. Additionally, the most important success factors in measurement work are outlined on the following figure:
System
IMPLEMENTATION PROCESS
When getting started with Fault Slip Through measurements, some activities are required to make it work. Generic advice is hard in this area since many activities depend on how different organizations operate. In order to implement the FST in the organization, the following steps are recommended [5]: •
Determine the business goal of introducing FST i.e. whether the goal is to reduce the number of faults or to reduce the lead-time.
•
Create a common understanding and commitment.
•
Identify a driver. Someone with authority and true interest in implementing the concept is crucial to make the implementation successful. Otherwise, it will as most other improvement work be down-prioritized every time a project emergency occur (which tend to be very often).
•
Make sure that the test strategy is well-defined and communicated throughout the organization.
•
Perform a baseline measurement on a finished project (or at least a subset of TR-s from a project). Doing this is a good test to see that the measure is possible to apply in relation to the defined test strategy and the baseline is very good to have as comparison when applying it on the first new project.
•
Add the measure to the local TR process. If the measure is included in the TR process, follow-up will be a lot easier.
•
Educate. People most understand how to report the measure and even more importantly understand why it is important to measure.
•
•
Identify a pilot project to apply it in. This first project needs extra attention regarding follow-up of how well the measurement reporting works. Correct eventual issues directly. Visualize results early to determine status and to further show people that it is important (people tend to care more about visible measurements).
Figure 3. FST Success Factors
Generic success factors are: •
One must accept the current situation and then improve it, especially reward systems might cause accurate data to be withheld and contra-productive improvements to be implemented.
•
Organizations with successful measurement programs actively respond to what the measurement data tell them.
•
Appropriate and timely communication of metrics results are critical in order to be used - make the results visible.
•
Measurement results must be examined in the context of the processes and environments that produced them.
•
The effort to collect metrics should not add significantly to the organization's workload.
•
The success of a measurement program is dependent on the impact it has on decision making, not the longevity of it.
FST specific success factors are: •
When introducing FST measurement into the fault reporting process, a guard is needed at least in the beginning to make sure that the faults are classified as they should (for example Maintenance Handling Office expert, test leader or fault review board).
•
Make sure to have a common and project independent test strategy developed and communicated because it is very tightly connected to the FST measure. Developing and deploying a common test strategy is in it self a driver for improvements since it tends to identify flaws in the process.
VI.
FST RESULTS ANALYSIS
The main objective of the case study presented in this chapter was to investigate how fault statistics could be used for removing unnecessary rework in the software development process. This was achieved through a FST measure, i.e. the measure tells which faults that would have been more costeffective to find in earlier phases. From the measure, the improvement potential of different parts of the development process can be estimated by calculating the cost of the faults that slipped through the phase where they should have been found. According to the test strategy, the faults that belong to different phases are divided on the following way:
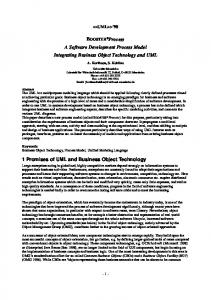
the faults should have been found (phase belonging). For example, 41 of the faults that were found in function test should have been found during unit test (e.g. through inspections or code reviews). Further, the rightmost column summarizes the amount of faults that belonged to each phase whereas the bottom row summarizes the amount of faults that were found in each phase. For example, 78 faults belonged to the unit test phase whereas most of the faults were found in function test (84). Graphical interpretation of table data is given on the following figure presenting the results of the FST to each phase. FST to Phase
•
Design (DC): Faults found during document inspection, code review/desk check and basic test,
•
Unit Test (UT): Faults found during unit tests of a component,
•
Function Test (FT): Faults found when testing the features of the system, e.g. faults in user interfaces and protocols,
100 80 60 40 20 0
•
System Test (ST): Faults found when integrating with external systems and when testing non-functional requirements,
•
Field Test (FiT): After ST completed, the product is commonly tested in a real environment, e.g. installed into a trial customer’s mobile network. When eventual issues have been resolved, the product becomes accepted for full operation.
The following data were obtained after applying Fault Slip Through measurement on completed development project: TABLE I.
Design
FT
ST
FiT
Figure 4. Fault Slip Through to Phase
Measurement results obtained from each phase are shown on this figure: FST from Phase 100
60 Design
4
UT
UT
FT
ST
FiT
FST TRs
Total Belong.
FST from
TRs
6
24
8
2
40
44
91%
41
21
5
67
78
86%
19
14
6
20
39
51%
18
4
4
22
18%
0
0
1
0%
ST Operation FST TRs
0
6
65
43
17
Total Found TRs
4
17
84
61
17
0%
35%
77%
70%
100%
40 20
11
FT
FST to
UT
80
FAULT SLIP THROUGH MATRIX
Phase Found (DIDET) Phase Belonging (SHODET)
D
/o fault slippage Fault slippage /ot relevant
Table 1. provides an example of FST between several development phases. The columns represent in which phase the faults were found (phase found) and the rows represent where
0 D
UT
FT
ST
FiT
Figure 5. Fault Slip Through from Phase
This type of fault classification can provide feedback on the development process. As it can be seen from the figures above, many faults are originating from early development phases indicating that not enough effort was put on specifying the functions in the design phase. As an opportunity for improvement came from this project new approach was introduced in the following one i.e. more emphasize was put in pre-study/feasibility phase of project leading to better function understanding. High percentage in late phases can be explained by missing the right test cases in specific test phases. As a consequence of that new test cases were added in verification part covering the weak test areas but also improving the regression part of test.
VII. CONCLUSION To be able to measure the benefits, the degree of fault cost reduction needs to be determined. The expected effects of the implemented concept are that the Faults Slip Through rates should decrease because the concept should decrease the number of basic faults that slip through to later phases. In order to obtain the FST measure, the organization must first define which faults should be found in each phase, e.g. based on what should be tested in each phase. When using fault data as basis for determining the improvement potential of an organization’s development process, the essential analysis to perform is whether the faults should have been avoided or at least have been found earlier. FST measurement should be used for determining this, i.e. it evaluates whether each fault slipped through the phase where it should have been found or not. The main difference between FST measurement and other related measurements is when a fault is introduced in a certain phase but it is not efficient to find in the same phase. This measurement framework also provides Key Performance Indicators associated to the practice goal (e.g. fault slipping through at any development and test phases and fault density per feature during Design Follow Up) The practice is applied to developments typically having a time frame of 6-12 months and the results are to be validated on a statistical basis, by means of a meaningful number of
applications. The statistical prediction of rework level at specific development phases requires time (e.g. 2-3 years) for gathering data and elaborating them into a consistent and proven statistical model. However, improvements might be visible in a shorter term. Nevertheless, performing the FST analysis gives the opportunity to review/reinforce the under-lying processes, because it highlights process lacks and quantitative levels of process applications. REFERENCES [1]
[2]
[3] [4] [5]
[6]
L.-O. Damm, L. Lundberg, “Results from introducing component-level test automation and Test-driven Development”, Journal of Systems and Software, Volume 79, Issue 7, July 2006. L.-O. Damm, L. Lundberg, “Early and Cost-Effective Software Fault Detection”, International Conference on Software Engineering, Proceedings of the 29th international conference on Software Engineering, pp. 560–570. L. Hribar, S. Sapunar, A. Burilovic, “First Time Right in AXE using One track and Stream Line Development”, Proceedings MIPRO 2008. Fault Slip Through Measurements, Internal Ericsson Documentation, Sweden 2005 L.-O. Damm, L. Lundberg, C. Wohlin, “Faults-slip-through – A Concept for Measuring the Efficiency of the Test Process”, Wiley Software Process: Improvement and Practice, Special Issue, 2006. Z. Antolic, FST Measurement Process Implementation in CPP Software Verification, Proceedings MIPRO 2005.