Fault-Mode Classification for Health Monitoring of Electronics Subjected to Drop and Shock Pradeep Lall, Prashant Gupta, Dhananjay Panchagade, Arjun Angral Auburn University Department of Mechanical Engineering NSF Center for Advanced Vehicle and Extreme Environment Electronics (CAVE3) Auburn, AL 36849 Tele: (334) 844-3424 E-mail:
[email protected] Abstract Failures in electronics subjected to shock and vibration are typically diagnosed using the built-in self test (BIST) or using continuity monitoring of daisy-chained packages. The BIST which is extensively used for diagnostics or identification of failure, is focused on reactive failure detection and provides limited insight into reliability and residual life. In this paper, a new technique has been developed for health monitoring and failure mode classification based on measured damage pre-cursors. A feature extraction technique in the joint-time frequency domain has been developed along with pattern classifiers for fault diagnosis of electronics at product-level. The Karhunen Loéve transform (KLT) has been used for feature reduction and de-correlation of the feature vectors for fault mode classification in electronic assemblies. Euclidean, and Mahalanobis, and Bayesian distance classifiers based on joint-time frequency analysis, have been used for classification of the resulting feature space. Previously, the authors have developed damage precursors based on time and spectral techniques for health monitoring of electronics without reliance on continuity data from daisy-chained packages. Statistical Pattern Recognition techniques based on wavelet packet energy decomposition [Lall 2006a] have been studied by authors for quantification of shock damage in electronic assemblies, and auto-regressive moving average, and time-frequency techniques have been investigated for system identification, condition monitoring, and fault detection and diagnosis in electronic systems [Lall 2008]. However, identification of specific failure modes was not possible. In this paper, various fault modes such as solder inter-connect failure, inter-connect missing, chip delamination chip cracking etc in various packaging architectures have been classified using clustering of feature vectors based on the KLT approach [Goumas 2002]. The KLT de-correlates the feature space and identifies dominant directions to describe the space, eliminating directions that encode little useful information about the features [Qian 1996, Schalkoff 1972, Theodoridis 1998, Tou 1974]. The clustered damage precursors have been correlated with underlying damage. Several chip-scale packages have been studied, with leadfree second-level interconnects including SAC105, SAC305 alloys. Transient strain has been measured during the dropevent using digital image correlation and high-speed cameras operating at 100,000 fps. Continuity has been monitored simultaneously for failure identification. Fault-mode classification has been done using KLT and joint-time-
978-1-4244-4476-2/09/$25.00 ©2009 IEEE
frequency analysis of the experimental data. In addition, explicit finite element models have been developed and various kinds of failure modes have been simulated such as solder ball cracking, trace fracture, package falloff and solder ball failure. Models using cohesive elements present at the solder joint-copper pad interface at both the PCB and package side have also been created to study the traction-separation behavior of solder. Fault modes predicted by simulation based pre-cursors have been correlated with those from experimental data. Introduction Currently in electronic packaging, BIST, fuses and canaries are extensively used for failure detection in electronics. These forms of failure detection procedures in IC’s ensure high level of product functionality. The goal is of monitoring electronics is a trade off between the effectiveness and cost/time involved in the process of design/manufacturing and maintenance. BIST has several advantages which provide reduction of cost and time. For example BIST reduces dependence on ATE (Automatic Test Equipment) which reduces the effect of current in the design. BIST is also effective in many ways. It provides speed in system testing of Circuit Under Test (CUT) [Hamzaoglu 2000]. It also overcomes the limitation of pins in the packaging and utilizes the extra area available on the chip there by more information about faults in obtained. BIST is used in several forms such as On-Line-BIST and Off-LineBIST. On line BIST is mostly used for electrical monitoring of the chips or functionality of the IC. On line BIST is used for monitoring whether the circuit is behaving correctly or not. For detecting and monitoring of actual physical damage in the circuit, off line BIST is used. Structural faults in the circuit are mainly due to external loads experienced by the packages in manufacturing and field operations. Ideally a BIST should have high fault coverage and low overheads on its circuit design. But there always exists a trade-off which leads to compromising the effectiveness of the BIST. One of the major concerns for a packaging and design engineer is the size of the BIST logic. Fault coverage and overheads are directly driven by size of the BIST. 100% fault coverage will also lead to increase in the overheads involved in the design and implementation of the BIST. Hence application of BIST is always a compromise of cost and effectiveness. Fuses and Canaries are also used for detecting and controlling faults in electronic system. Fuses [Anderson 2004] are used to sense any abnormality such as surge and fluctuations in voltage and temperature limits in the system
668
2009 Electronic Components and Technology Conference
and restore normal operating conditions. Canaries are special devices which are mounted on the standard device which is being monitored. Canaries have accelerated form of same failure mechanism as that of standard device on which it is mounted. Hence they fail faster. This property of canaries is used for measuring the actual time to failure [Mishra 2002] of the standard device. Canaries are used for identification of physics of failure in electronic packages. They are used for studying low cycle fatigue (solder joint fatigue) [Anderson 2004], corrosion, changes and sudden exposure to temperature and vibration transients. One of the major challenges in use of fuses, canaries is that they need frequent replacements and repairs. Hence it is difficult to integrate them with the main system. The health monitoring techniques discussed above in electronic packaging have limited scope. They are all based on reactive failure and hence they are primarily diagnostic in nature. They do not give any information on remaining residual life, how and when the damage starts initiating, what is trend of damage progression, what kind of failure mode is dominant in the electronic system. These questions are better tackled and answered by techniques which are predictive in nature. Previously authors have developed techniques driven by statistical pattern recognition for structural health monitoring of electronics. These studies quantified damage initiation and progression [Lall 2006a, 2007a, 2008] in electronics subjected to drop and shock. Statistical Pattern Recognition techniques based on wavelet packet energy decomposition [Lall 2006a] have been studied by authors for quantification of shock damage in electronic assemblies, and auto-regressive moving average, and time-frequency techniques have been investigated for system identification, condition monitoring, and fault detection and diagnosis in electronic systems [Lall 2008]. Leading indicators for system level damage in portable electronics are developed based on wavelet packet energy decomposition [Lall 2006a], joint time frequency analysis [Lall 2007a] and auto-regressive moving average, and time-frequency techniques have been investigated for system identification, condition monitoring, and fault detection and diagnosis in electronic systems [Lall 2008]. Currently damage quantification is based on electrical continuity, which limits visibility into damage initiation, progression. Damage pre-cursors based on time and spectral techniques for health monitoring of electronics do not rely on continuity data from daisy-chained packages. This technique of structural health monitoring involves extensive off-line processing of data obtained from the sensors strategically placed at various target points. Techniques such as digital image correlation [Lall 2006b] are also used for data acquisition of global and local responses of the electronic system subjected to drop and shock. Structural health monitoring, i.e. assessing the current state of the system and establishing a knowledge data based on predictions about the system state is previously used in various engineering fields such as delamination in composites [Saravanos 1994], damage detection in aerospace structures [Robinson 1996, Doebling 1995], off shore structures [Brinker 1995]. These methods of structural health monitoring have found application in performace assessment
of machinery systems [Lee 1995, Chuang 2004]. Structural health monitoring by statistical pattern recognition has been previously applied in other scientific disciplines such as biology [Christodoulou 1999], psychology [Dellaert 1996], medicine [Holt 1998], marketing [Apte 1997], Artificial Intelligence [Kohonen 1988], computer vision [Low 1990] etc. SHM of electronics by statistical pattern recognition is relatively new. In this paper various dominant failure modes occurring with every drop and shock event in electronics are classified using pre-failure feature space. Damage due to drop and shock in electronic packages can have a wide variety of failure modes occurring at various competing locations in different packaging architectures. The damage is due to overstresses developed by repetitive loading occurring with each drop event. Previously, the authors have developed damage pre-cursors based on time and spectral techniques for health monitoring and damage detection in electronics without reliance on continuity data from daisy-chained packages. This paper focuses on classification of failure modes based on leading indicators in pre-failure space. The methodology developed in this work is based on decorrelation of joint time frequency feature space by Karhunen Loéve transform (KLT). Various fault modes such as solder inter-connect failure, inter-connect missing, chip delamination chip cracking etc are classified. These fault modes are found as most frequently occurring in electronic packages subjected to drop and shock. Fault mode classification for assessing system level damage of electronics subjected to drop and shock is relatively new. Test Vehicles Two test vehicles have been used to study classification of failure mechanisms and modes in electronics under shockimpact loading. The test vehicles have been labeled as test board A and B. The test vehicle-A is a multilayer FR4 printed circuit board with four 1156 I/O FPGAs. The packages are fully functional field programmable gate arrays (FPGA) and not daisy-chained devices. The FPGA test board has been connected to a LabView data-acquisition system through a NI 6541 Digital generator and CB 2162 connector board to collect the digital data.
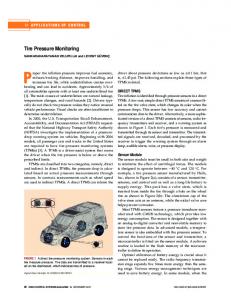
(a) (b) Figure 1: Test Vehicle-A Packages, 1156 FPGA (a) 35 x 35 mm with 34 x 34 solder array. (b) Interconnect Array Configuration. The set-up enables each FPGA to write a square-pulse across the solder interconnects, charge an external capacitor and read the square-pulse back from the second pair of second-level interconnects for the package being tested. Figure 1a shows
669
2009 Electronic Components and Technology Conference
the location of FPGA solder interconnects being tested for detection of damage initiation and propagation. The solder interconnects being tested have been strategically selected based on the location of failure under thermo-mechanical loads and shock, vibration loads. Area-array packages often fail in the die-shadow area under thermo-mechanical loads, while the corner interconnects fail under shock and vibration loads. Figure 1b shows the interconnect array configuration of the 1156 I/O FPGA Package. The package is 35 x 35 mm in size, and has a full-array of solder interconnects in a 34 x 34 array configuration at 1 mm pitch. The packages have Sn3Ag0.5Cu solder interconnects
0.56 mm thick, 4-layer FR4. Test Board B consists of ballgrid array (BGA) and chip-scale packages (CSP). Two versions of the test vehicle were constructed including 8 mm flex-substrate chip packages with 132 I/O, 0.5 mm pitch and 10 mm flex-substrate chip-scale packages with 100 I/O, 0.8 mm pitch. The printed circuit assembly is made of FR4 with SAC405 interconnects. Figure 3 shows the test vehicle and interconnect configuration. Table 1 gives the summary of the package attributes for test vehicles A and B. Table 1: Attributes of Test Vehicles-A and B. Package FG1156 TABGA100 TABGA132 Size 35 x 35 10 x 10 8x8 I/O 1156 100 132 Pitch (mm) 1.00 0.8 0.5 Ball Size (mm) 0.60 0.46 0.3 Pad Opening 0.46 0.3 0.28 Pad Type SMD SMD Thru-Flex Die Size (mm) 23x21x0.3 5 x 5 3.98 x 3.98 Substrate 0.56 0.5 0.1 Thickness (mm) Development of Training Signal The test boards are subjected to horizontal orientation 0 deg drop according to JEDEC standards. Figure 4 shows the Lansmont drop table used for drop testing of the test vehicles. Both the test vehicles have been mounted in face-down configuration specified by the JEDEC test standard JESD22B111. The shock-impact test for test vehicle –A has been carried out with all the four FPGAs in powered-up state.
Figure 2: Test Vehicle-A Printed Circuit Assembly
TABGA 100
TABGA 132
Figure 3: (a) Test Vehicle-B Printed Circuit Assembly and (b) BGA Inter-connect Configuration The test board has mounting holes at the board corners to enable board test in the JEDEC configuration (Figure 2). Package substrate is multi-layer glass-epoxy substrate with solder-mask defined package-side pads. The die is 0.3 mm thick with in-plane dimensions 23 mm x 21 mm. Solder interconnects are 0.6 m in diameter. The pads are solder mask defined 0.46 mm diameter. The package substrate is
Figure 4: Lansmont Drop Table with Test Vehicle-A. The waveform generated by the FPGA’s has been acquired using a high sampling-rate data-acquisition card and digital storage oscilloscope. Strain gauges have been mounted on the board side at various target points of interest. High speed imaging of the drop event has also been acquired at a frame rate of 50,000 fps. The printed circuit assemblies have been
670
2009 Electronic Components and Technology Conference
speckle coated. Transient strain histories have been acquired from both strain gages and high-speed imaging using digital image correlation. The high-speed cameras have been placed on rigid floor with an angle of 25 deg between them while facing the speckle of the board. The board displacement have been measured by calibrating the cameras before the drop experiment. Figure 5 shows the strain contours acquired during the drop event of test vehicle-A. Figure 6 shows the sample strain history of test vehicle-B along with the daisy chain continuity, which is also used to monitor the packages during drop events.
time= 0 ms
time= 2.5 ms
time= 4.8 ms
time= 5.7 ms
assemblies has frequency content that varies over time in the signal. Joint time frequency analysis of the signal has been used to study the temporal behavior of the frequency content. Previously authors have implemented JTFA for early failure detection. In this paper time-frequency distribution has been used to form a combined feature space of different drop event. The combined feature space is used for classifying dominant failure modes during drop events. [Wigner 1932, Ville 1948, Grossmann 1984, Cohen 1995]. Time-Frequency Analysis In this paper, the Cohen class of transforms has been applied to compute the joint time frequency distribution. A Reduced Interference Distribution (RID) kernel has been used as an auxiliary function to reduce cross-terms and thereby reducing the interference, which is seen in other popular joint time frequency analysis techniques such as Wigner-Ville transforms [Cohen 1989, 1995, Williams 1994]. In this study, the binomial time-frequency kernel proposed by [Jeong 1992a,b] has been applied to study the drop and shock characteristics of an electronic assembly. The binomial timefrequency Distribution defined by [Jeong 1992a,b] is, TFR (n , )
Figure 5: 3D contour of strain in longitudinal direction from DIC of FPGA Test Board in 0-degree orientation.
Strain
2 1 0 -0.01 -1
0.04
-2
9 7 5 3 1 -1 0.09-3 -5 -7
g ( ) 2 f (n f (n e i 4 2 2
(1) where h ( and g( is the time smoothing window and the frequency smoothing window respectively and f(n) represents the signal where n 1,2 N . The term , and is used to define the RID kernel as the RID kernel constraint is that 0 . The frequency smoothing window g( and the time smoothing window h ( used here is a hamming window of size (N) as outlined in [Jeong 1991, Jeong 1992a,b, Williams 1994]. Figure 7 shows a time frequency distribution of a transient strain history obtained from the JEDEC drop of the test vehicle.
Voltage (V)
3
h (
Time(sec) Strain
Continuity
Figure 6: Sample Strain History and damage detection by daisy chain monitoring. Development of Feature Vectors for Failure Mode Classification Different fault modes for health monitoring of test vehicles subjected to drop and shock have been classified using Karhunen Loéve transforms of feature vectors based on joint time frequency analysis. A comprehensive data set of assembly response in JEDEC configuration has been obtained from time-frequency distributions of the strain histories obtained from different error seeded simulations and experimental measurements from strain sensors and highspeed imaging based digital image correlation of test assemblies. Transient response of the circuit board
Figure 7: Joint time Frequency Feature Space of a Transient Strain signal. The time frequency analysis of the signal has been used to obtain the frequency content of the transient strain signal at each given time instant. The time-frequency signature is based on transient strain signal obtained from two sources including the strain sensors placed on the electronic assembly and digital image correlation based on high-speed imaging during the shock event. The time moment and frequency moment distributions shown are unique to a given signal and represent the strain signals in the joint time-frequency
671
2009 Electronic Components and Technology Conference
spectrum. The first order moments, in time and in frequency, of a time-frequency energy distribution, tfr, describe the averaged positions and spreads in time and in frequency of the signal. The time moment represents an estimation of instantaneous frequency at a given time instant during the drop event [Boashash 1989, Cohen 1995, Tacer 1995]. The frequency moment represents an estimation of the group delay of the signal for each frequency in the signal. [Cohen 1995, Tacer 1996, Georgopoulos 1997]. As the time moment and frequency moment feature vectors are unique for each signal they are an appropriate choice for prognostics of electronic assemblies in drop and shock. Once the joint time-frequency distribution of the drop events has been calculated, a comprehensive data set has been developed using the TFR distributions of several drop events for each test assembly from pristine-state to failure. A two dimensional image has been made by stacking the TFR distribution of each drop events side by side (Figure 8). The TFR distribution for each transient strain history has been binned by frequency. A sample plot of combined TFR distributions is shown in Figure 8. Figure 8 (a) shows the image of the combined TFR distributions and Figure 8 (b) presents the data matrix which is used as an input data for fault mode classification. 4 3.5
2
Drop Events
4
2.5 2
6
A XTq qT X
0.5
2 E[ A 2 ]
0
12 200
400
600
Frequency Bin
800
(4)
The variance of A has been represented as a function of unit vector, q,
1
10
(2)
The data set X has been centered and scaled to eliminate a non-zero mean of matrix X. ‘Since the input matrix has been cenetered and scaled, the expected value of the input matrix is zero, E[X ] 0 (3)
1.5
8
0
KLT
Xm dimensions Zm dimensions
The input matrix X has been projected on a unit vector, q in the de-correlated feature space, also of dimension-m. The projection is represented as an inner product of vectors X and q is the matrix of principal components, A,
3
COMBINED TFR FEATURE SPACE OF DIFFERENT DROP EVENTS
classification of feature space has been done based on the variability of the data. The time-frequency feature space has been clustered into most dominant directions of variability. Previously, KLT has been used for data compression in classical communication theory [Ogawa 1986, Yamashita 1996, Shawn 2004]. The use of KLT for failure-mode classification of electronic modules is new. The data set described in Figure 8 has been de-correlated using KL transform. Let X is the representation of the variable-space in the environment of interest. Joint Time frequency distributions of the strain histories from successive drop events from pristine assembly configuration to failure for each board assembly has been used as the input matrix, X. A de-classified feature space Z has been obtained using the KL transform of the matrix, X [Fukunaga 1972, Haykin 1999]. The de-classified set of vectors is a linear combination of principal components with decreasing order of importance. The initial k-vectors are important as they account for most of the variance in the data.
-0.5
E[(q T X )( X T q )]
-1
q T E[ XX T ]q
1000
(5)
q T Rq Where, the outer-product of X, has been represented as R. The variance probe, Ψ has been computed, since it relates correlation matrix, R, the unit vector in de-correlated space, q, and standard deviation, σ.
(a)
(q) 2 q T Rq
(b) Figure 8: Representative Sample (a) Image of Combined TFR feature Space, (b) data matrix of combined TFR feature Space. Decorrelation of Feature Space using Karhunen Loéve Transforms (KLT) KLT is a statistical classifier which has been used for decorrelation of feature space of damage progression in package interconnects during successive drop events. The de-
(6)
The equation that governs the unit vectors, q, and variance probe Ψ is an eigenvalue problem, which has a non-trivial solution, q 0 ,
Rq q
(7)
The eigenvalues have been arranged in descending order. (8) 1 2 3 ..... m The eigenvector matrix Q is orthogonal consisting of columnvectors which satisfy the condition of orthonormality, (9) Q q 1 q 2 q 3 ... q n
672
2009 Electronic Components and Technology Conference
1 j i T qi q j 0 j i
(10)
Using eigen-decomposition, the correlation matrix R has been written in terms of eigenvalues and eigenvectors as, m
R i q i q iT
(11)
i 1
The eigenvectors of the correlation matrix R represent the principal directions along which the variance probes Ψ(qj) have extreme values. The associated eigenvalues define the extreme values of the variance probe Ψ(qj). There are m possible projections of x, corresponding to m possible solutions of unit vectors q. Projections aj , which are the principal components, have been combined into a single vector as follows,
A [a 1 , a 2 , a 3 ,........., a m ]T
(12)
A [ x T q 1 , x Tq 2 , x T q 3 ,........., x T q m ]T A QT x
(13)
The original data-vector has been synthesized from the transformed feature space of principal components by premultiplying the above equation by Q,
package. One package has been modeled in detailed format in turn for each package on the test assembly. Strain histories during the drop event have been retrieved from the model predictions for studying fault mode classification. Since drop impact failures are accompanied by competing failure modes, including solder interconnect failure, trace fracture, chip delamination, chip fracture, each failure mode has been modeled by error-seeding the pristine configuration model. Various package locations have been modeled for each test vehicle. Strain histories have been extracted for each case. The board has been modeled using reduced integration conventional shell S4R elements. The solder interconnects have been modeled using two node element Timoshenko beam elements (B31). Various elements of the package including the copper pad, mold, die, BT-epoxy substrate have been modeled using C3D8R elements. The floor of impact has been modeled using R3D4 element. The JEDEC orientation for test vehicle A and test vehicle B are shown in Figure 9. Figure 10 shows the cross sectional detail of the modeled packages for the test vehicles. The faults occurring in the test vehicle during drop event are simulated in the simulation by error seeding the assembly manually. This manual error seeding is used to form a data set which can be used to classify the actual fault modes occurring due to the physical damage taking place in experimental data.
X QA m
(14)
X a jq j j 1
The original data vector x has reduced dimensions from the transformed feature space a as, a 1 a 1 xˆ a jq j (15) xˆ q 1 q 2 . . q . j1 . a
(a)
where l < m. The KL transform has been used to create a linear projection of feature space from m- dimensions to l – dimensions, which approximates the original data x. Dominant directions of the de-correlated feature space have been determined by first few largest eigenvalues. The principal components entering transformation are also determined by the dominant eigenvalues. Modeling of Competing Failure-Modes by Explicit Finite Elements Simulation Explicit finite element models have been developed for shock-impact of both test vehicles in the JEDEC configuration. Interconnects have been modeled with conventional shell-beam elements. In order to reduce computational time, only one package has been modeled in the detailed configuration at one time, while the rest have been modeled using smeared properties. Details of the smearing scheme can be found in [Lall 2004, 2006b]. Competing failure modes have been modeled for the detailed
(b) Figure 9: JEDEC Drop Orientation of (a) Test Vehicle-A and (b) Test Vehicle-B.
673
2009 Electronic Components and Technology Conference
assembly. A comprehensive simulation data set have been developed by simulation of more interconnects with sustained damage in the test vehicle. Two Interconnects with Damage
One Interconnect with Damage
Mold Chip
Three Interconnect with Damage
Four Interconnects with Damage
Die-attach Solder Interconnects
Substrate PCB
Cu Pad
(a) (a)
Mold
Die attach
Solder Interconnect Substrate (b) Figure 10: Modeling details. (a) Test Vehicle -A (b) Test Vehicle-B PCB
Two Interconnects with Damage
One Interconnect with Damage
Chip
Three Interconnect with Damage
Solder Ball failure and Cracking: The solder balls in the drop event are subjected to mechanical shock. During shock-impact the board undergoes considerable bending for small duration. Therefore the shockevent is transient in nature. Due to repeated drop events of the board assembly the solder balls undergo fatigue failure leading to complete failure or solder interconnect missing. The explicit finite element models of the board assembly have been error seeded to simulate the effect of solder ball fracture and failure. Corner-most solder balls in the package experience maximum shear strain making the corner-most solder interconnects most likely to fail during shock events. Commercial packages may use one or more cornerinterconnects as redundant grounds. It is therefore feasible to sustain damage in the corner interconnects while the package continues to function normally. Solder ball damage and failure has been simulated in the explicit model by reduction in the cross-section area of the corner interconnects followed by elimination of the corner interconnects from the package. Figure 11 shows a schematic of solder interconnect array simulated with each solder ball cracking and solder ball missing for test vehicle A and test vehicle B. Interconnects with simulated damage in the test vehicle have been selected sequentially on the periphery for each package in the test
Four Interconnects with Damage
(b) Figure 11: Simulation of Solder Interconnect Damage for (a) Test Vehicle A (b) Test Vehicle B Transient strain histories have been obtained for the simulated shock-impact at the center of the package-location on top of the mold-compound as well as on PCB side. Experimental strain histories have been extracted from high-speed dataacquisition in conjunction with strain gages and high-speed imaging using digital image correlation. Chip Fracture Chip fracture has been simulated in the detailed package on both test vehicles on the silicon die. The fracture on the chip has been modeled as a crack occurring in the underside of the chip. The crack has been modeled by removing elements at location of the crack and replacing them with contact elements which form a fracture surface. The contact surfaces present in the chip represent a crack. The chip fracture mode of failure is shown in Figure 12.
674
2009 Electronic Components and Technology Conference
least 95% of the total variance in the data have been selected from both simulation and experimental data sets. A value of zero indicates no similarity, while a value of one signifies identical data sets.
Contact Surface Representing Die fracture
trace(E T SS T E ) (16) k Where, [E] and [S] are k most important principal component matrix of the two n dimensional data sets from experimental and simulation respectively. S PCA
Y Z
X
Figure 12: Simulated Chip Fracture in Drop Event. Chip Delamination Chip delamination during shock-impact has been modeled by progressive detachment of the bond between the chip and package-substrate. Contact elements have been used to represent the fracture surface between the package-substrate and the die-attach. Figure 13 shows the model of chip delamination.
Mahalonobis Distance Classifier Mahalonobis distance classifier has been used to quantify the statistical difference between the KL coefficients of the healthy transient strain history and different error seeded models. It is also used to calculate the statistical difference for the experimental data set, where drop-1 is the healthy training signal and subsequent drops are the unhealthy signals with some damage initiation and progression in them. Mahalonobis distance is defined as the measure of dissimilarity between two random variables X and Y which have same distribution of covariance matrix ,
d ( x , y) Y Z
X
Delamination between Chip and Substrate
Figure 13: Simulation of chip delamination in the package. Validation of Clustering The feature space formed by time-frequency distribution has been de-correlated using KLT into clusters. These clusters have been formed from both the simulation data-set as well as experimental data-sets. For simulation data set since the explicit finite element models are error seeded with a specific failure mode, hence we the region of the feature space which belongs to each failure mode is known. The simulation dataset clusters have been overlapped on the clusters formed by experimental data to quantify the type of failure mode. In a practical scenario, there are multiple failure modes which can occur in the test vehicle when subjected to repeated shockimpact phenomenon. Hence the overlapping of the clusters helps in finding the most dominant direction of the failure mode occurring in the test vehicle. Correlation of the prediction from the simulation and experimental data sets has been quantified using the similarity factor, SPCA. Objects or classes grouped together in a cluster have been verified to be similar, and objects placed in different clusters have been verified to be dissimilar in their inherent failure modes. To see the statistical resemblance of KL coefficients of first three principal components for different types of failure modes in simulation and experiment, the mahalonobis distance classifier along with SPCA has been used [Krzanowski 1979, Singhal 2001]. The similarity factor SPCA provides a single value for quantification of similarity between the two data sets. First k-principal components which account for at
x y T 1 x y
(17)
Results of Classification of Failure Modes In this section, the potential of the presented methods for failure mode classification has been investigated. Data from test assemblies with multiple failure modes has been collected with a combination of high-speed data acquisition and highspeed video in conjunction with digital image correlation. Simulation models have been error seeded with specific failure modes. Time-frequency analysis based feature vectors have been created based on both experimental data and the model predictions. Experimental data-sets have been acquired for both pristine assemblies and after each drop to capture the damage progression in the assemblies. The feature space has been populated with the response from pristine assemblies, assemblies with progressive damage, and failed assemblies. Error seeding of the simulation models with specific failure mode has been used to guide the identification of the region in the pre-failure feature space belonging to the particular failure mode. Dominant locations of each failure mode in the feature space have been identified based on the overlap between the error-seeded simulation models and experimental data-sets in the feature space. Experimental data-sets from both pristine assemblies and assemblies with impending failure have been analyzed. Feature space in this study has been defined based on the first three principal components. The first three principal components have been chosen because they account for 95percent of the variability in the input data. Figure 14 and Figure 15 show the scree plot for test vehicle A and test vehicle B respectively. The scree plots demonstrate that majority of the variability in the data is explained by the first three principal components of the data-set. .This has been found to be true for feature vectors developed from both the experimental and simulation data-sets.
675
2009 Electronic Components and Technology Conference
Figure 16 and Figure 17 show the de-correlated feature space of test vehicle-A and test vehicle-B for simulation data. Figure 16a and Figure 17a show the clusters of different failure modes for test vehicle A and test vehicle B respectively. Figure 16b and Figure 17b show the surfaces defined by the three principal components. The descentdirection in the surface gradient has been used to detect the progression direction of a specific failure mode in feature space for both test vehicles. Since feature vectors from multiple assemblies have been plotted in feature space and failure modes verified by cross-sectioning, the results are repeatable and representative of the failure modes. In addition, movement of the Karhunen Loéve Coefficients in a particular direction signifies the expected migration of the assembly response in feature space with damage progression.
Cumulative Percentage Contribution
1 0.998 0.996 0.994 0.992 0.99 0.988 0.986 0.984 0.982 0.98 0
1
2
3
4
5
6
7
8
9
10
11
Principal Component
(a) 1 Cumulative Percentage Contribution
0.9998 0.9996 0.9994 0.9992 0.999 0.9988 0.9986 0.9984 0
1
2
3
4
5
Principal Components
(b) Figure 14: Test Vehicle-A- Scree Plot of cumulative contribution of principal components. (a) Simulation data (b) Experimental data
Cumulative Percentage Contribution
1
(a)
0.9998 0.9996 0.9994 0.9992 0.999 0.9988 0.9986 0
1
2
3
4
5
6
7
8
9
10
11
12
13
Principal Component
(a)
Cumulative Percentage Contribution
1 0.9 0.8 0.7 0.6 0.5 0.4 0.3 0
10
20
30
40
50
Principal Component
(b) Figure 15: Test Vehicle-B- Scree Plot of cumulative contribution of principal components. (a) Simulation data (b) Experimental data
(b) Figure 16: (a) De-correlated Pre failure feature Space of Test Vehicle-A. (b) Dominant direction of failure mode in prefailure feature space in Test Vehicle A.
676
2009 Electronic Components and Technology Conference
predicted failure modes and their classification in the feature space.
Figure 18: Test Vehicle-A, Overlap of Simulation and Experimental feature spaces. (a)
Figure 19: Test Vehicle-B, Overlap of Simulation and Experimental feature spaces.
chip delamination
chip cracking
four_interconnec t crack
three_interconne ct crack
two_interconnect crack
one_interconnect crack
four_interconnec t miss
three_interconne ct miss
two_interconnect miss
one_interconnect miss
Healthy
1.2 1 0.8 0.6 0.4 0.2 0
Failure Mode
(a)
Package Fall off
chip delamination
chip cracking
four_interconnect crack
three_interconnect crack
two_interconnect crack
one_interconnect crack
four_interconnect miss
three_interconnect miss
two_interconnect miss
one_interconnect miss
1.2 1 0.8 0.6 0.4 0.2 0 Healthy
The migration direction of the KL coefficients in the feature space has also been used identify the relative dominance of failure modes in the test assemblies with accrued latent damage. In this study, the dominant failure modes, i.e. failure modes which are most likely to occur with subsequent drop events have been identified in pre-failure feature space. Figure 18 and Figure 19 show the superimposed feature space of the simulation on experimental feature space. Correlation between of the experimental and simulation feature vectors has been statistically quantified using principal component similarity factor (SPCA). A similarity factor (SPCA) between the first three principal components for experimental and simulation data sets for test vehicle A is 0.9521(>0.95) and for test vehicle B is 0.9689 (>0.95). The high value of SPCA indicates that simulation feature space is statistically similar to experimental feature space at a confidence level of 95%. Hence the superposition of the feature space is statistically validated. Since simulation has been performed exclusively for a particular failure mode, the superposition of simulation and experimental KL coefficients validates the
Confidence Value
(b) Figure 17: (a) De-correlated Pre failure feature Space of Test Vehicle-B. (b) Dominant direction of failure mode in prefailure feature space of Test Vehicle B.
Confidence Value
In addition, the Mahalonobis distance classifier has been used to quantify the statistical dissimilarity between the various KL coefficients. The confidence values computed for various failure modes based on Mahalanobis distance have been plotted in Figure 16 to Figure 19.
Failure Mode
(b) Figure 20: Confidence Plot based of mahalonobis distance classifier for simulation data set. (a) Test Vehicle-A (b) Test Vehicle-B.
677
2009 Electronic Components and Technology Conference
Experimental and simulation data sets for each drop and failure mode case in simulation. Table 2: SPCA calculation for simulation vs. simulation cases. (a) Test Vehicle-A (b) Test Vehicle-B. (a) Inter-Connect Fracture
1.2 1 0.8 0.6 0.4 0.2 0
One
Two
Three
Four
Chip cracking
Chip Delamination
Healthy
1
0.79
0.78
0.79
0.79
0.42
0.38
One
0
1
0.80
0.79
0.79
0.41
0.33
Two
0
0
1
0.78
0.76
0.43
0.34
0
0
Three
0
Four
0
Chip Cracking
0
0
Chip Delamination
0
0
1
0.79
0.42
0.42
0
1
0.43
0.41
0
0
0
1
0.39
0
0
0
0
1
Diagonal Matrix 0 0 Cut off Level- 90%
(b) Inter-Connect Fracture
Drop-1
Drop-5
Drop-10
Drop-15
Healthy
One
Two
Three
Four
Chip cracking
Chip Delamination
Package Fall-off
Healthy
1
0.39
0.38
0.39
0.38
0.38
0.36
0.41
One
0
1
0.78
0.78
0.78
0.77
0.78
0.37
Two
0
0
1
0.78
0.79
0.79
0.79
0.36
Three
0
0
0
1
0.78
0.78
0.79
0.37
Four
0
0
0
0
1
0.81
0.78
0.37
Chip Cracking
0
0
0
1
0.78
0.36
Chip Delamination
0
0 Cut-off 0 Level 90% 0
0
0
1
0.36
Package Fall-off
0
0
0
0
0
1
Simulation
Inter-Connect Fracture
Drop Number (a) 1.2
Confidence Value
Healthy
Simulation
Inter-Connect Fracture
Confidence Value
Since the cut off level in the study is 95%, hence the confidence plot shown in Figure 20a-b indicate that statistically there exists a significant difference between the KL coefficients of the healthy strain signal and error seeded strain signals from the simulation. Similarly a statistically significant difference has been demonstrated between in the experimental data set for both the test vehicles, where drop-1 is taken as the healthy signal and the subsequent drops are studied to see any damage initiation and progression in them. Figure 21a-b shows the combined confidence plot of mahalonobis distance classifier for experimental data set for test vehicle A and test vehicle B.
1 0.8 0.6
0 0 Diagonal Matrix
0
0
Table 3: SPCA calculation for experiment vs. experiment cases. (a) Test Vehicle-A (b) Test Vehicle-B. (a)
0.4 0.2
Drop-44
Drop-40
Drop-35
Drop-30
Drop-25
Drop-20
Drop-15
Drop-10
Drop-5
Drop-1
0
Experiment
Drop-1
Drop-5
Drop-10
Drop-15
Drop-1
1
0.54
0.52
0.51
0
1
0.59
0.59
1
0.57
0
1
Drop-5
Drop Number
Diagonal Matrix 0 0 Cut-off Level 90%
Drop-10
(b) Figure 21: Combined confidence plot based of mahalonobis distance classifier for experimental data set. (a) Test VehicleA (b) Test Vehicle-B. Similarity factor is also calculated between various specific failure modes for three cases for both test vehicles A and B. SPCA has been calculated for following cases to show the statistical similarity or dissimilarity between them (a). Simulation vs. simulation. (b). Experimental vs. experimental and (c). Experimental vs. Simulation. Table 2a-b shows the SPCA calculation for the simulation data set with different cases of failure modes. Statistical significance has been computed at a confidence value of 90%. A value of SPCA > 0.90 will indicate statistical similarity where as SPCA