source and camera interfaced with Silicon Graphics machine. 3-D mesh representation of the surface of the object is obtained from the acquired range images.
©2010 International Journal of Computer Applications (0975 - 8887) Volume 1 – No. 17
Feature Detection of an Object by Image Fusion Umesh C. Pati
Pranab K. Dutta
Alok Barua
Dept. of Electronics and Comm. Engineering National Institute of Technology Rourkela, Orissa, India
Dept. of Electrical Engineering Indian Institute of Technology Kharagpur, West Bengal, India
Dept. of Electrical Engineering Indian Institute of Technology Kharagpur, West Bengal, India
ABSTRACT In this paper, we propose a novel method for feature detection of an object by fusion of range and intensity images. For this purpose, we have developed a data acquisition system with a laser source and camera interfaced with Silicon Graphics machine. 3-D mesh representation of the surface of the object is obtained from the acquired range images. Extraction of structural features from the range images has been performed by two methods i.e. coordinate thresholding technique and Laplacian of Gaussian (LoG) edge detector. Extraction of structural features from the intensity image of the object has been performed by the Hough transform technique and Canny edge detector. An approach using shape signatures has been proposed to detect corner points in the edge maps obtained using LoG detector as well as Canny detector. The extracted 3-D edge maps as well as the detected corner points have been mapped to 2-D plane. The methodology for manual fusion of edge maps with the help of affine transformation and the concept of automatic fusion of edge maps by affine transformation followed by iterative closest point (ICP) algorithm have been introduced in this work. The automated technique for fusion overcomes the drawbacks associated with manual fusion. The fusion algorithm provides a composite image with more accurate and reliable information about the important features of the object.
Categories and Subject Descriptors I.4.6 [Image Processing and Computer Vision]: Segmentation – edge and feature detection; I.4.8 [Image Processing and Computer Vision]: Scene Analysis – range data, sensor fusion.
General Terms Algorithms, Experimentation.
Keywords Range image, Intensity image, Features, Fusion, Control point.
1. INTRODUCTION Feature detection involves simplifying the amount of resources required to describe a large set of data accurately. The goal is to locate points in the scene that lie along boundaries. Features can be classified into three types: spectral features (color, tone, ratio, spectral index etc.), geometric features (edges, corner points etc.) and textural features (pattern, homogeneity, spatial frequency
etc.). The common feature to be extracted is an edge, therefore, edge detection is referred frequently. Edges provide important visual information since they correspond to discontinuities in the physical, photometrical and geometrical properties of objects. The principal edges correspond to significant variations in the reflectance, illumination, orientation and depth of surfaces. Subdividing an image into its constituent parts, segmentation is usually the first step in image analysis. Range image segmentation algorithms can be broadly classified into two categories: regionbased and edge-based segmentation. Region-based approaches group pixels into connected regions based on homogeneity measures, while boundaries between regions are located by edge detection methods. There are many techniques in literature for range image edge detection [1, 2, 3, 4, 5, 6]. Intensity image segmentation algorithms generally are based on one of two basic properties of intensity values, which are discontinuity and similarity. The approach is to partition an image based on abrupt changes in intensity in the first category where as partitioning an image into regions that are similar according to a set of predefined criteria is the approach in the second category. Edge detection in particular has been a staple of segmentation algorithms. It is the most common approach for detecting meaningful discontinuities in gray level. Several novel edge detection algorithms have been proposed over the years [7, 8, 9, 10, 11]. Feature level fusion is a medium level image fusion. This level can be used as a means of creating additional composite features. At first, relevant features are abstracted from the input images and then combined. Fusion algorithms that rely on pixel manipulation are fast, simple and require fewer calculations than feature based fusion methods. However, these algorithms are limited in the amount of information extracted from the input images. Sensitivity to noise and blurring effects are other problems associated with processing individual pixels. To minimize the problems, while attempting to maximize the information content of the fused image, feature-based fusion algorithms have been developed [12, 13, 14, 15, 16]. It is not feasible to depend on any type of image to provide a complete edge map for the scene. However, some edge information may exist in one type of image and may not exist in another. Range images contain edges solely because of the changes in physical shape and structure of the object. Intensity images are reliable information source for step, texture and shadow edges. Therefore, combining the two sources of information can help to locate most of the important discontinuities in the image and provide more reliable information about the scene or object. 50
©2010 International Journal of Computer Applications (0975 - 8887) Volume 1 – No. 17 In this paper, we propose a new method for the detection of all edge features in an object by fusion of range and intensity images. We have developed a data acquisition system with a laser source and camera to acquire range images. To achieve our objective, we have introduced two new techniques for the fusion of edge maps extracted from both the sources. The result of the fusion process provides high level description of the object by a composite image with all the edge features. We have also presented an algorithm using shape signature for the detection of corner points of different shapes in the object. The rest of the paper is configured as follows: we first describe the generation of the 3-D mesh surface of the object from the acquired range images in section 2. Section 3 and 4 present the feature extraction techniques from the range and intensity images of the object respectively. Mapping of 3-D edge features to 2-D plane by perspective transformation is discussed in section 5. Two novel techniques for the fusion of edge features from both the sources are introduced in section 6. Finally, we conclude the paper in section 7.
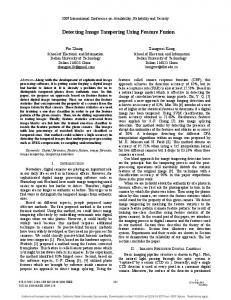
the object with the help of a manually operated mechanical arrangement on the mount. The intersection of the laser plane and the object creates a stripe of illuminated points on the surface of the object. Part of the laser stripe falls on both sides of the object on the platform. A charge-coupled device (CCD) camera interfaced with Silicon Graphics machine acquires series of range images while scanning is performed. The experimental setup and the object are shown in Figure 1.
2. GENERATION OF 3-D MESH SURFACE
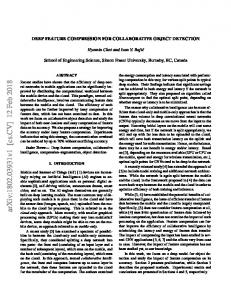
The process is repeated for the rest three different views by rotating the object manually by 90 degrees in anticlockwise direction each time so that all of the surface detail is captured. The captured RGB images are converted into grayscale and then binary images. The binary image is subjected to thinning algorithm so that a single pixel thin line representing the illuminated region is obtained. A laser scanned RGB image (299 ×322 pixels) is shown in Figure 2.
Generation of 3-D mesh surface of the object is accomplished by following three steps. These are data acquisition, registration and integration [17]. Shape is acquired as a set of coordinates corresponding to points on the surface of the object. These coordinates measure the distance or depth of the point from a measuring device and are called range values. Range image acquisition techniques can be divided into two broad categories: passive methods and active methods. Passive methods do not interact with the object, whereas active methods do, making contact with the object or projecting some kind of energy onto the surface of the object [18]. Optical triangulation is one of the most popular approaches for data acquisition. A single scan by a structured light scanner provides a range image that covers only part of an object. Therefore, multiple scans from different view points are necessary to capture the entire surface of the object. Registration is the process in which the multiple views and their associated coordinate frames are aligned into a single global coordinate frame. Existing registration techniques can be mainly categorized into feature matching and surface matching. Iterative closest point (ICP) algorithm proposed by Besl et al. is the most popular algorithm for accurately registering a set of range images [19]. Successful registration aligns all the range images into a common coordinate system. However, the registered range images taken from adjacent viewpoints will typically contain overlapping surfaces with common features in the areas of overlap. The integration process eliminates the redundancies and generates a single connected surface model from the range samples.
2.1 Data Acquisition and Processing We have made an object of wood having external dimensions of 12.2 × 12.5 × 3.5 cm for the experimentation purpose. The surface of the object contains features of different shapes like triangle, notch, rectangle and circle. The object is placed on a horizontal and smooth platform. The method of optical triangulation is being used to acquire 3-D data of the object. A red line diode laser which spreads the laser beam into a sheet of light with a cylindrical lens is placed on a mount. The laser plane scans
Figure 1. Experimental setup and the object
Figure 2. Laser scanned image We have calculated the coordinate values in 3-D space (X, Y, Z) for all the illuminated pixels using the method of optical triangulation. The laser line on the platform is considered as the base line for the particular scan. The displacement between the illuminated point on the surface of the object and the base line is proportional to the depth at that point. The conversion from image coordinates to world coordinates is performed using Xcoeff and Ycoeff (interpixel distance) obtained experimentally. The calculation of 3-D coordinates is performed for all the images of the four views.
2.2 Registration When aligning two range images, the translation and rotation that bring the points as close together as possible have to be found out. For rigid surfaces, the transformation consists of a rotation matrix R and a translation vector t [20]. The rigid transformation is defined as y = Rx + t
(1)
51
©2010 International Journal of Computer Applications (0975 - 8887) Volume 1 – No. 17
where x is the point in camera frame coordinates and y is the same point in world coordinates. We have applied feature matching technique for coarse registration followed by ICP algorithm for fine registration. In this work, the left bottom corner point on the surface of the object has been chosen as the feature for registration of different views. We have registered the range images of other three views with that of the first view. For that purpose, the coordinate values of the range images of all the views except the first one have been rotated in clockwise direction by an angle that the object was rotated to take the images. This is
gridding and surface fitting have been accomplished using the griddata function of MATLAB. It uses triangle-based cubic interpolation method based on Delaunay triangulation of data for surface fitting. A median filter of window size 5 × 5 is used to create a smooth surface. The mesh representing the surface of the object has been shown in Figure 4.
accomplished by the application of the rotational matrix Rθ in Eq. (1) where θ is the corresponding angle of rotation. As there is no translation, translation vector t has been assumed to be zero. The rotation matrix Rθ is given by
R
θ
cos θ − sin θ = 0 0
sin θ
0
cos θ
0
0
1
0
0
0 0 1
Figure 4. Mesh representation of the surface
0
(2)
For fine registration, iterative closest point algorithm has been implemented which performs process of registration iteratively. Besl et al. [19] have used an efficient solution proposed by Horn [21] to obtain R and t using unit quaternions. The same solution has been implemented in this work. The range images of the four different views after being subjected to feature based registration followed by ICP algorithm have been shown in Figure 3.
Figure 3. Registered range images
2.3 Integration We have removed the laser points on the platform for the integration purpose as the points on the surface of the object are the desired points. The steps of integration algorithm include detection of overlapping points, merger of corresponding points and generation of a single connected surface model. Closest points from two registered views are obtained using dsearchn function of MATLAB. The points which have found correspondents are stored in Sold- overlapping and Snew- overlapping where as the points without correspondents is stored in Sold-non-overlapping and Snew-non-overlapping respectively [22]. Overlapping point sets are merged by evaluating average of each correspondent pairs of coordinates in Sold- overlapping and Snew- overlapping. Non-overlapping points in Sold-non-overlapping and Snew-non-overlapping are directly augmented with the integrated overlapping point set to get the set of confident points from which surface would be rendered. Data
3. FEATURE EXTRACTION FROM RANGE IMAGE In this work, we have utilized two methods for the extraction of structural features like edges and corner points from the range images.
3.1 Coordinate Thresholding Technique As we have mentioned earlier, the surface of the object contains features of different shapes like circle, triangle, notch, rectangle along with external object boundary. The extraction of 3-D edge points of these features is based on coordinate thresholding between two consecutive laser scan points. The threshold values for edge detection of different shapes are determined with human intervention by having initial idea about few edge points from the point cloud of different views and thereafter fixing nearby values. The different shapes on the surface of the object can be divided into two categories depending on the discontinuity in the depth value. In the case of abrupt change in coordinates, edge points are detected by applying certain threshold on the distance between two consecutive points by taking into consideration all the X , Y and Z coordinates. For the shapes where the depth varies gradually, the edge points are detected by finding the lowest point inside the shape and then moving in both directions to find the edge points. The algorithm is applied to all the four views separately for the detection of edge points. The coordinates of the edge points of the different shapes along with main boundary are combined together forming arrays of data points. The 3-D plot of all the edge points on the surface of the object is shown in Figure 5.
Figure 5. 3-D edge map 52
©2010 International Journal of Computer Applications (0975 - 8887) Volume 1 – No. 17
3.2 Laplacian of Gaussian (LoG) Detector The purpose of the Gaussian function in the LoG formulation is to smooth the image and the purpose of the Laplacian operator is to provide an image with zero crossings used to establish the location of edges [23]. Instead of applying segmentation process directly on the discrete point domain, the LoG edge detector has been applied on the interpolated mesh surface. The edge features are extracted based on the discontinuity in depth. This method does not require any user interaction and provides more number of edge points. The detected edge points are shown in Figure 6.
distance from the centroid. Corner points of the various shapes have been detected out of the prominent peak values from the shape signature. These prominent peaks along with the associated angle values have been transferred from polar coordinates to Cartesian coordinates and have been denormalized to obtain original corner coordinates. Detected corner points of the triangle boundary from the prominent peak points have been shown in Fig. 8 (a). The same process is repeated for all the segmented shapes and the detected corner points from all the shapes are shown in Fig. 8 (b).
Figure 6. 3-D edge map
3.3 Corner Point Detection
(a) triangle boundary
We propose a novel method for the detection of corner points with the help of shape signature from the edge map obtained using LoG edge detector. For this purpose, the various connected shapes in the edge map have been further segmented and labeled using 8 connectivity. The original signature has been constructed by measuring and plotting the distance from the centroid of the shape to the boundary at all discrete positions along the digitized boundary as a function of angle [24]. Signatures along with the peaks have been obtained for all segmented shapes on the surface of the object. A peak is a local maximum vertical displacement occurring between the horizontally nearest local minimum vertical displacements on each side of the peak. From the shape signatures, derived signatures are constructed on the basis of preserving important shape features emphasized by the original version of the signature. This is achieved by considering prominent peaks in the signature plot as important features. Prominent peaks are obtained which have values above the mean value of the peaks. The segmented triangle boundary, its shape signature with peaks and prominent peaks from shape signature has been shown in Figure 7.
(b) complete edge map
Figure 8. Detected corner points
4. FEATURE EXTRACTION FROM INTENSITY IMAGE Two methods have been used for the extraction of structural features from the intensity image of the object.
4.1 Hough Transform Technique Circular, rectangular and triangular shapes on the surface of the object have been painted with black color to minimize the effect of shadows. The notch shape is not colored to observe the effect of shadow in the edge map. The object is placed on a horizontal and smooth platform. The illumination light is turned on and an intensity image is obtained with the same CCD camera interfaced with Silicon Graphics machine. The camera image of the object has been shown in Figure 9.
Figure 9. Intensity image (a)
(b)
(c)
Figure 7. (a) Triangle boundary (b) shape signature with peaks (c) prominent peaks In the present case, those points are considered to be corner points, which are at a significant distance from the centroid. Shape signatures have described the shape that is based on
The captured image is converted into gray scale image and gradient based edge detection algorithm using Sobel operator has been applied to the converted image. The Hough transform has been implemented to find and link the line segments in the gradient image [24]. It is computed and has been displayed in Figure 10.
53
©2010 International Journal of Computer Applications (0975 - 8887) Volume 1 – No. 17
Figure 10. Hough transform with peaks Hough transform peaks that are likely to be significant have been found out after specifying maximum number of peak locations to look for. Simultaneously, a threshold value is also defined and values below threshold are not considered to be peaks. The locations of peaks inside red squares have been shown in Figure10. Line segments are found out and have been linked after specifying fillgap and minlength values. Two line segments separated by less than fillgap pixels have been merged into a single line segment. Merged line segments less than minlength pixels long have been discarded. The line segments produced due to the implementation of the Hough transform have been superimposed on the intensity image of the object and are shown in Figure 11.
Figure 12. Edge map using Canny detector
4.3 Corner Point Detection For the determination of corner points from the edge map obtained using Canny edge detector, the various connected shapes in the edge map have been further segmented and labeled using 8 connectivity. The corner points of different shapes in the edge map have been detected using shape signatures as described earlier. The segmented circle boundary, its shape signature with peaks and prominent peaks from shape signature has been shown in Figure 13.
(a)
(b)
(c)
Figure 13. (a) Circle boundary (b) shape signature with peaks (c) prominent peaks
Figure 11. Hough lines on the intensity image
Detected corner points of the circle boundary from the prominent peak points have been shown in Figure 14 (a) where as all the detected corner points from different shapes on the surface of the object have been shown in Figure 14 (b).
4.2 Canny Edge Detector The captured intensity image is converted into gray scale image and Canny edge detection algorithm is applied to the converted image. The Canny method finds edges by looking for local maxima of the gradient of the image [25]. The gradient is calculated using the derivative of a Gaussian filter. The method uses two thresholds, to detect strong and weak edges and includes the weak edges in the output only if they are connected to strong edges. This method is therefore less likely than the others to be fooled by noise and more likely to detect true weak edges. The processed image has been shown in Figure 12 (a) circle boundary
(b) complete edge map
Figure 14. Detected corner points
5. MAPPING OF 3-D EDGE POINTS The structural features extracted from range images of the object are in 3-D plane where as the structural features from the intensity image are in 2-D plane. Structural features from both the 54
©2010 International Journal of Computer Applications (0975 - 8887) Volume 1 – No. 17
modalities should be in same plane for the fusion. For this purpose, the 3-D edge points have been projected onto a 2-D plane by perspective transformation [26]. With the help of experimentally obtained scene-image coordinate pairs of the control points painted on the object, the perspective transformation matrix has been obtained as c c c c
h1
h2
h3
h4
=
1 0 a 0
0
− 0 .8 6 6 0
0 .5
a 32
a 33
− 0 .0 0 0 4
0 .0 0 4 1
31
X Y 3 0 8 .8 1 6 0 a Z 0 .6 8 8 0 1
− 3 5 .0 6 5 7
0
34
(3)
where ( ch 1 , ch 2 , ch 3 , ch 4 ) are camera coordinates in homogeneous representation and
(X ,Y , Z )
are world coordinates. The
unknown coefficients a31 , a32 , a33 and a34 are not computed as these are related to z .The camera coordinates in Cartesian form are x =
c h1
and
ch4
y =
(4)
ch2 ch4
For any world point ( X , Y , Z ) on the object, the image coordinates ( x , y ) can now be computed with the help of Eqs. (3) and (4). The image coordinates are computed for all the points in the 3-D edge map of the object obtained using coordinate thresholding technique and LoG edge detector. The projected 2-D edge maps have been shown in Figure 15 (a) and (b) respectively.
6. FEATURE LEVEL FUSION We have proposed two novel techniques i.e. manual and automatic for the feature level image fusion.
6.1 Manual Fusion of Edge Maps The 3-D edge map of the object obtained using coordinate thresholding has been mapped to 2-D plane by perspective transformation. This edge map and the edge map from the intensity image of the object obtained using the Hough transform technique have been chosen for the manual fusion due to the human intervention in their extraction process. In general, the affine transformation matrix can be written as
x′ a y′ = a 1 a
(b) LoG
a12
a13
21
a 22
a 23
31
a32
a33
11
a12
a13
A = a21
a a
a22
a23
31
a32
a33
(5)
sets by affine transformation, a set of control points must be identified that can be located on both the maps. Since the general affine transformation is defined by six constants, at least three control points must be identified. Generally, more number of control points is identified for optimal result. For the fusion of extracted edge maps, maximum number of control points distributed over the whole image (in this case thirteen) has been visually identified in both the edge maps for optimal result. No method for establishing the correspondence of control points automatically has been made here. A least-square technique has been used to determine the six affine transformation parameters from the matched control points. For the thirteen number of control points, Eq. (5) can be written as 11
a12
a13 x1
x2
.....
21
a22
a23
y2
.....
31
a32
a33
y 1 1
x′ y = y′ 1 1 x13 13
1 .....
1
x2′
.....
x13′
1
y2′
.....
y13′
1 .....
or, AX = X ′
Figure 15. Projected 2-D edge maps The corner points detected using shape signatures have also been perspectively projected onto 2-D plane and the projected points have been shown in Figure 16.
x y where 1
The elements a31 = a32 = 0 and a33 = 1 . In order to fuse two data
a a a (a) coordinate thresholding
11
1
(6)
Simple mathematical operation on Eq. (6) yields
A = X ′X ( XX ) T
T
−1
(7)
The affine transformation matrix A has been computed from Eq. (7) using the coordinate values of the control points in X (range image) and X ′ (intensity image) and is given as follows:
1.2556 A = 0.0148 0
0.0353 1.6958 0
−346.7782 1 23.7833
(8)
The affine transformed coordinates in terms of original coordinates of the points in the range image edge map are obtained from Eq. (5) as follows:
Figure 16. Projected corner points
x ′ = 1.2556 x + 0.0353 y + 23.7833
55
©2010 International Journal of Computer Applications (0975 - 8887) Volume 1 – No. 17 and y ′ = 0.0148 x + 1.6958 y − 346.7782
(9)
Equation (9) is applied to all the points in the range image edge map for fusion with the intensity image edge map. Both the edge maps after fusion have been shown in Figure 17.
Equation (11) is applied to all the points in the range image edge map for fusion with the intensity image edge map. Both the edge maps after fusion have been shown in Figure 18 (a). The coarsely fused edge points by affine transformation have been subjected to fine fusion using ICP algorithm. The calculation of transformation parameters has been made using the singular-value decomposition (SVD) method [27]. Both the edge maps after fusion using ICP algorithm are shown in Figure 18 (b).
Figure 17. Manual fusion of edge maps (a) affine transformation
6.2 Automatic Fusion of Edge Maps The 3-D edge map of the object obtained using LoG edge detector has been mapped to 2-D plane by perspective transformation. This edge map and the edge map from the intensity image of the object obtained using Canny edge detector have been chosen for the automatic fusion as there is little human intervention in their extraction process. The first step for implementing affine transformation for fusion is to select a set of control points in both the edge maps. The perspective projected corner points from the range image edge map have been shown in Fig. 16 where as the detected corner points in the intensity image edge map have been shown in Fig. 14. The correspondence and detection of control points in both the edge maps have been performed using a novel method by finding the geometric orientation of corner points based on length and angle with respect to the centroid. The corner points satisfying the minimum angle and length criterion are considered as control points from which the affine transformation matrix is computed. Fifteen number of corresponding corner points in both the edge maps are saved as control points. The affine transformation matrix A has been computed from Eq. (7) using the coordinate values of the identified control points and is given as follows:
1.4152 A = 0.0046 0
−0.0363 1.6523 0
−341.7584 1 31.9664
(10)
With the help of Eq. (10), the transformation equations are obtained from Eq. (5) as follows: x ′ = 1.4152 x − 0.0363 y + 31.9664 and y ′ = 0.0046 x + 1.6523 y − 341.7584
(11)
(b) ICP algorithm
Figure 18. Automatic fusion of edge maps
7. CONCLUSIONS In this paper, we have proposed a novel method for the feature detection of a 3-D object by fusion of images from two different modalities i.e. range and intensity. To acquire range images, single laser beam has been used in this work, which can be extended into multiple beams at a time. The optical triangulation method provides dense and accurate 3-D data compared to passive sensing methods. For the detection of corner points in various shapes in the edge map, a novel technique using shape signatures has been implemented. Corner points help in establishing correspondence between edge maps from both modalities. The edge maps from both the modalities should be in same plane for fusion. For this purpose, the extracted 3-D edge maps as well as the detected corner points are mapped to 2-D plane with the help of perspective transformation. We have proposed two new techniques for the fusion of edge maps from both modalities. The manual fusion has been accomplished with the help of affine transformation matrix, which is computed using the coordinate values of the control points visually detected in both the edge maps. A large number of control points must be selected across the whole image in order to get reasonably good result. The accuracy of fusion depends on the accuracy of the selected control points. This is very tedious, labour-intensive and repetitive work. Therefore, there is a critical need to develop an automated technique that requires little or no human supervision for the fusion of images when higher accuracy is desired and image analysis is subject to time constraints. For this reason, the concept of automatic fusion has been introduced in this work. The coarse fusion has been accomplished using affine transformation. Fine fusion is accomplished by implementing ICP algorithm using SVD method for the calculation of transformation parameters. Feature extraction, 56
©2010 International Journal of Computer Applications (0975 - 8887) Volume 1 – No. 17 correspondence and fusion are accomplished automatically by this technique. Feature level fusion of range and intensity images of the object provides a high-level description of the object. It increases the degree of confidence regarding the presence or absence of edge feature in the depicted scene. There are no edges due to shadow in range image edge map where as shadow edges exists in the intensity image edge map. Intensity edge map is a source of information for texture edges where as range image edge map is not able to detect them because they do not introduce discontinuities in depth. The complementary as well as the redundant information from both modalities increase the information content of the composite image manifold. This method can be applied when surface quality is not proper. Undulation in hot rolled strips due to inhomogeneous cooling rate can also be detected by this method. Future work may include improvement in feature extraction as well as representation by incorporating higher order and joint information.
8. REFERENCES [1] Jiang, X., and Bunke, H. 1999. Edge detection in range images based on scan line approximation. Comput. Vis. Image Und. 73, 2 (Feb. 1999), 83-199. [2] Baccar, M., Gee, L.A., Gonzalez, R.C., and Abidi, M.A. 1996. Segmentation of range images via data fusion and morphological watersheds. Pattern Recogn. 29, 10 (Oct. 1996), 1673-1687. [3] Qi, Z., Weikang, G., and Xiuqing, Y. 1997. Real-time edge detection of obstacles in range image by automatically thresholding the normalized range difference. In Proceedings of the IEEE International Conference on Intelligent Processing Systems (October 1997), 2, 1047-1051. [4] Yu, Y., Ferencz, A., and Malik, J. 2001. Extracting objects from range and radiance images. IEEE T. Vis.Comput. Gr. 7, 4 (Oct. 2001), 351- 364. [5] Woo, H., Kang, E., Wang, S., and Lee, K.H. 2002. A new segmentation method for point cloud data. Int. J. Mach. Tool. Manu. 42, 2 (Jan. 2002), 167-178. [6] Huang, J., and Menq, C.H. 2001. Automatic data segmentation for geometric feature extraction from unorganized 3-D coordinate points. IEEE T. Robotic. Autom. 17, 3 (June 2001), 268-279. [7] Qian, R.J., and Huang, T.S. 1996. Optimal edge detection in two-dimensional images. IEEE T. Image Process. 5, 7 (July 1996), 1215-1220. [8] Liang, L.R., and Looney, C.G. 2003. Competitive fuzzy edge detection. Appl. Soft Comput. 3, 2 (Sept. 2003), 123-137. [9] Kim, D.S., Lee, W.H., and Kweon, I.S. 2004. Automatic edge detection using 3×3 ideal binary pixel patterns and fuzzy-based edge thresholding. Pattern Recogn. Lett. 25, 1 (Jan. 2004), 101-106. [10] Rakesh, R.R., Chaudhuri, P., and Murthy, C.A. 2004. Thresholding in edge detection: a statistical approach. IEEE T. Image Process. 13, 7 (July 2004), 927-936. [11] Kang, C.C., and Wang, W.J. 2007. A novel edge detection method based on the maximizing objective function. Pattern Recogn. 40, 2 (Feb. 2007), 609-618.
[12] Kor, S., and Tiwary, U. 2004. Feature level fusion of multimodal medical images in lifting wavelet transform domain. In Proceedings of the 26th Annual International Conference of the IEEE Engineering in Medicine and Biology Society (San Francisco, CA, USA, September 2004), 1, 1479-1482. [13] Liao, Z. W., Hu, S.X., and Tang, Y.Y. 2005. Region-based multifocus image fusion based on Hough transform and wavelet domain hidden Markov models. In Proceedings of the 4th International Conference on Machine Learning and Cybernetics (Guangzhou, August 2005), 5490-5495. [14] Cvejic, N., Lewis, J., Bull, D., and Canagarajah, N. 2006. Region-based multimodal image fusion using ICA bases. In Proceedings of the IEEE International Conference on Image Processing (October 2006), 1801-1804. [15] Lisini, G., Tison, C., Tupin, F., and Gamba, P. 2006. Feature fusion to improve road network extraction in high-resolution SAR images. IEEE Geosci. Remote S. 3, 2 (Apr. 2006), 217221. [16] Tupin, F., and Roux, M. 2003. Detection of building outlines based on the fusion of SAR and optical features. ISPRS J. Photogramm. 58, 2 (June 2003), 71-82. [17] Zhang, Z., Peng, X., Shi, W., and Hu, X. 2000. A survey of surface reconstruction from multiple range images. In Proceedings of the 2nd Asia-Pacific Conference on Systems Integrity and Maintenance (Nanjing, China, 2000), 519-523. [18] Zhang, Z., Peng, X., and Zhang, D. 2004. Transformation image into graphics. In Integrated Image and Graphics Technologies, D. Zhang, M. Kamel and G. Baciu, Eds. Kluwer Academic Publishers, USA, 111-129. [19] Besl, P. J., and McKay, N. D. 1992. A method for registration of 3-D shapes. IEEE T.Pattern Anal. 14, 2 (1992), 239-256. [20] Planitz, B. M., Maeder, A. J., and Williams, J. A. 2005. The correspondence framework for 3-D surface matching algorithms. Comput. Vis. Image Und. 97, 3(2005), 347-383. [21] Horn, B. K. P. 1987. Closed-form solution of absolute orientation using unit quaternions. J. Opt. Soc. Am. A. 4, 4 (1987), 629-642. [22] Zhou, H., and Liu, Y. 2005. Incremental point-based integration of registered multiple range images. In Proceedings of the IEEE International Conference on Industrial Electronics, Control and Instrumentation (North Carolina, USA, 2005), 468-473. [23] Gonzalez, R. C., and Woods, R.E. 2003 Digital Image Processing. Pearson Education. [24] Gonzalez, R. C., Woods, R. E., and Eddins, S. L. 2004 Digital Image Processing using MATLAB. Pearson Education. [25] Canny, J. F. 1986. A computational approach to edge detection. IEEE T. Pattern Anal. 8, 6(1986), 679-698. [26] Gonzalez, R. C., and Woods, R. E. 1999. Digital Image Processing. Addison-Wesley Publishing Company. [27] Madhavan, R. and Messina, E. 2003. Iterative registration of 3-D LADAR data for autonomous navigation. In Proceedings of the IEEE Intelligent Vehicles Symposium (Columbus, OH, 2003), 186-191. 57