2014 Seventh International Conference on Mobile Computing and Ubiquitous Networking (ICMU)
Feature Selection for Floor-changing Activity Recognition in Multi-Floor Pedestrian Navigation Sara Khalifa∗‡ , Mahbub Hassan∗‡ , and Aruna Seneviratne†‡ ∗ School
of Computer Science and Engineering, University of New South Wales, Sydney, NSW 2052, Australia Email: sarak,
[email protected] † School of Electrical and Telecommunication Engineering, University of New South Wales, Sydney, NSW 2052, Australia Email:
[email protected] ‡ National ICT Australia, Locked Bag 9013, Alexandria, NSW 1435, Australia Email: sara.khalifa, mahbub.hassan,
[email protected] additions, multiplications, and function evaluation operations, where No represents the number of output classes, and Ni the o) number of input features (assuming that it employs (Ni +N 2 neurons in its hidden layer) [3]. Therefore, given a target set of activities, the number of operations to be completed by the MLP classifier increases quadratically with the number of features. These observations motivate us to investigate feature selection that leads to the minimal number of features for FCAR without sacrificing the detection accuracy. To carry out our investigations, we collected accelerometer data from several volunteers riding escalators and lifts in different buildings. We then applied a number of different feature selection methods and classifiers to this data and compared their performances in terms of detection accuracy and the number of features. The main floor-changing activities considered are riding an escalator (E) and a lift (L) in a standing position, which initially gives two output classes for the classifier. However, because standing still anywhere on the floor (S) could be potentially confused with E and L, we finally consider three activities in our studies. The results show that an accelerometer embedded in a smartphone can achieve 94% recognition accuracy using only 5 features. The rest of the paper is organized as follows. Related work is reviewed in Section II. We explain the data collection process in Section III, followed by the feature selection and classification methodology in Section IV. Results are discussed in Section V. We conclude the paper in Section VI with a discussion of future work.
Abstract—In large shopping malls and airports, pedestrians often change floors using conveniently located lifts and escalators. Floor changing activity recognition (FCAR) therefore can be a vital aid to multi-floor pedestrian navigation systems. The focus of this paper is to achieve accurate FCAR with the minimal number of features. Using experimental data, we compare the performance of various feature selection methods and classifiers trained to detect whether the user is using an escalator or a lift. The results show that an accelerometer embedded in a smartphone can achieve 94% recognition accuracy using only 5 features.
I. I NTRODUCTION In multi-floor pedestrian navigation systems, such as pedestrian dead reckoning (PDR) implemented in a smartphone [1], it is necessary to reset the pointer to a new starting location in a new floor plan whenever the user moves from one floor to another. Since pedestrians often change floors using conveniently located lifts and escalators, floor changing activity recognition (FCAR), such as riding an escalator or a lift, is considered a critical component of these emerging personal indoor navigation systems [2]. Activity recognition involves periodic computation of a set of features (feature extraction) from smartphone sensors and feeding them to a pre-trained classifier that matches the input features to one of the known output classes or activities. For example, an FCAR module may consider three accelerometer features, such as the average accelerations in x, y, and z directions in the last 3 seconds, to detect whether the pedestrian is riding an escalator or a lift using a multi-layer perceptron (MLP) classifier, which was trained a priori with a large amount of accelerometer data collected from many pedestrians. The number of features used for activity recognition directly contributes to the computational complexity (or overhead) of the overall FCAR process. First, a higher number of features means the FCAR will need to extract (compute) more information from the accelerometer each time it needs to make a decision about the current activity, which could be every 2-4 seconds in some practical systems [2]. Second, a classifier trained to work with a larger set of inputs or features is expected to have a larger computational requirement. For example, a threelayer MLP executes a total of (Ni + No )2 + 1.5(Ni + 3No )
978-1-4799-2231-4/14/$31.00 ©2014 IEEE
II. R ELATED W ORK FCAR is a part of the Human Activity Recognition (HAR) Research. HAR has been an area of significant research in the literature over the past years. All the approaches for HAR share 3 basic components, data collection, feature extraction, and classification. In the data collection phase, most of the published work relied on attaching accelerometer sensors to different places on the human body (wearable sensors). However, the popularity of smartphones in the recent years has shifted the focus to smartphone-based HAR. Table I summarizes some of the studies related to performing HAR using either wearable sensors or smartphones, in terms of the
1
2014 Seventh International Conference on Mobile Computing and Ubiquitous Networking (ICMU)
TABLE I S UMMARY OF SOME PRIOR WORKS ON ACCELEROMETER - BASED HAR Device
Ref.
Position of the device
Wearable Sensors
[4]
Five 2-axis accelerometers (different places) Five 3-axis accelerometer (different places)
[5]
Smartphone
[2]
In the user hand in front of the body
E and/or L included? Both
# of features 75
L only
30
L only
25
Features
Classifiers
Mean, FFT Energy, Frequency Domain Entropy, Correlation Mean, Variance, Skewness, Kurtosis, Autocorrelation, The Peaks of the DFT
DTL, KNN , DT , NB BDM, RBL,LSM , KNN, DTW, ANN, SVM SVM
Velocity, Distance, Mean, Variance, Standard deviation, Interquartile Range, Root Mean Square, Correlation [6] Strapped to the user’s an- L only 4 Mean, Variance, Skewness, Kurtosis, EccenNB, DTW kle tricity, Correlation Note: Features No. means the exact number of features to be fed to the classifier. Abbreviations: Fast Fourier Transform (FFT), Discrete Fourier Transform (DFT), Decision Table (DTL), Decision Tree (DT), Na¨ıve Bayes (NB), K Nearest Neighbour (KNN), Support Vector Machine (SVM), Bayesian Decision Making (BDM), Rule Based Learner (RBL), Least square method (LSM), Dynamic Time Wrapping (DTW), Artificial Neural Network (ANN).
use of PDR can be curbed drastically by identifying more ASPs. Khalifa and Hassan [9] considered the problem of multiple lifts or escalators existing near a pedestrian leading to the possibility of matching to the wrong lifts (escalators) despite the classifier detecting the activity correctly. They found that such mismatch probabilities vary from location to location in the same building and can be pre-computed offline, which could be later used by a PDR system to make decisions about whether to accept the outcome of an activity detection module or ignore it. Khalifa et al. [10] considered the problem of reducing the classification complexity of FCAR. They observed that at any time, there is only a small subset of facilities in the immediate proximity of the user yielding the opportunity to train multiple low-complexity classifiers each trained to detect only a small number of activities. The actual classifier to be used then can be adaptively switched during run time. Using practical data, the authors have shown that adaptive classification can reduce classification complexity significantly.
position of the device on the user’s body, when either E or L or both activities are included, the number and description of the features, and the classifier(s) used. We note from Table I that, although the number of the basic features used seems small, the exact number of features to be fed to the classifier is very large (up to 75) [4] which increases the HAR overheads not only in terms of the computational time needed to calculate all of these features but also the complexity of the classifier to be used. Reference [6] uses simple (time domain) and small number of extracted features. However, the authors strapped the phone to the user’s ankle to keep the y-axis of the phone aligned to the lower leg at all times. Therefore, the activities have had distinguishable characteristics in the accelerometer data. This distinction in the signals have made the classification process, to some extent, an easy job and has allowed the authors to rely on only 4 features. It can be seen from Table I that, both L and E are studied in only one reference while three references studied L alone. It is also worth noting that the single paper which included both E and L [4] reported a poor recognition accuracy (70.56% for E), and (43.58 % for L) in spite of using a large number of sensors attached to different positions of the user’s body and the high number of features, up to 75 (some of which are extracted from the frequency domain).
III. DATA C OLLECTION We collected accelerometer data using an Android Galaxy Nexus smartphone and a publicly available accelerometer data collection software called AccelerometerValues [11]. The data is collected at 20 Hz from nine different indoor complexes including 18 different escalators and 11 different lifts. Five volunteers, 3 males and 2 females of ages between 25 and 35, were asked to hold the smartphone in their right or left palms in front of the body1 and perform the three specified activities, S, L, and E. While riding lift or escalator, the subjects were told to simply stand on the moving platform and not walk around or climb up or down. For escalators, data collection begins and ends at two end points of the escalator, giving a trace length proportional to the length of the escalator. For most of the escalators, the traces were about 20sec long. For lifts, it is harder to control the trace length as lifts are stopped arbitrarily by other users in the
FCAR, or any other activity recognition, for the purposes of correcting pedestrian dead reckoning (PDR) errors in indoor environments has attracted attention of several research groups. With a practical implementation on a smartphone, Gusenbauer et al. [2] have convincingly demonstrated that FCAR can reduce PDR positioning error significantly when the user travels through multiple floors. The same observation was later confirmed by Altun et al. [5], [7] with a simultaneous activity recognition and dead reckoning implementation using inertial measurement units (IMUs) attached to body parts. For a random walk model, Hassan [8] has shown that the distance a pedestrian is expected to travel before the PDR error is reset is reciprocal of the density of activity switching points (ASPs), such as lifts and escalators, in the indoor environment. The implication of this finding is that the continuous unaided
1 This is the most natural holding position when using the phone for navigation.
2
2014 Seventh International Conference on Mobile Computing and Ubiquitous Networking (ICMU)
building. Therefore, our lift trace lengths varied widely ranging from a mere 5sec (one floor) to 20sec (5 floors). To match the majority of traces, all S activity traces are 20sec long. From five subjects, we collected a total of 177 traces, including 64 E’s, 80 L’s, and 33 S’s. With a 20Hz data collection frequency, we have 20 three-dimensional data for each second of the trace. Because our data were collected from natural settings outside the lab, the raw data was subject to noise from various sources, including unexpected movement of the subjects and platform vibrations caused by other people riding the same lift or escalator. Such noise could potentially reduce FCAR accuracy and (or) increase the number of features needed for classification. We therefore decided to study the effect of filtering or pre-processing the raw data before used for feature selection and classification. In particular, we used a moving average filter (MAF), which is simple but effective for removing random noise from time series while retaining a sharp step response [12]. A MAF smooths data by replacing each data point with the average of the neighboring data points defined within the span. This process is equivalent to lowpass filtering with the response of the smoothing given by the following difference equation
TABLE II T HE INITIAL FEATURE SET BEFORE APPLYING FEATURE SELECTION (7 BASIC FEATURES YIELDING A TOTAL OF 19 EXTRACTED FEATURES ) Feature Name
Computational Formula
Mean of the three axes
µ(x) =
1 n
σ(x) =
p 1 Pn
Standard deviation (Std) of the three axes
i=1
Skew(x) =
Kurtosis of the three axes
Kurt(x) =
(xi − µ)2
1 n
Pn
(xi −µ)3
1 n
P
1 n
Pn
Average Absolute Deviation of the three axes
AAD(x) =
Pairwise-Correlation the three axes
Corr(x, y) =
of
xi
i=1
n
Skewness of the three axes
i=1 σ3 n
(xi −µ)4
i=1 σ4
i=1
−3
|xi − µ|
Cov(x,y) σ(x)σ(y)
Pn p
1 Average Resultant Accel- ARA(x, y, z) = n x2i + yi2 + zi2 i=1 eration The “minus 3” in the kurtosis equation, is often used as a correction to make the kurtosis of the normal distribution equal to zero.
TABLE III D EFAULT WEKA CONFIGURATIONS FOR THE FIVE CLASSIFIERS .
1 (y(i+N )+y(i+N −1)+· · ·+y(i−N )) (1) 2N + 1
Classifier DTL
where ys (i) is the smoothed value for the ith data point, N is the number of neighboring data points on either side of y(i), and 2N + 1 is the span. We have considered a span of 3 (N = 1). For the points on the edges, i.e., the first and the last points of the input trace, a padding of zero is used. The MAF was applied to each of the 177 collected traces, generating two sets of data traces, one containing the raw data and the other filtered. To observe the effect of filtering, these two data sets are used separately for feature selection and classification.
DT (J48)
ys (i) =
Pn
NB KNN
MLP
Configuration Evaluation Measure: Accuracy, Search Algorithm: BestFirst. Confidence Factor = 0.25, The minimum number of instances per leaf = 2. A default precision of 0.1 for numeric attributes. K = 1, No distance weighting, Nearest Neighbour Search Algorithm: LinearNNSearch (Euclidean Distance). Hidden Layers = (Features+classes)/2, Learning Rate = 0.3, Momentum = 0.2, Training time = 500 epochs.
dimensional data. Using the concept of entropy, it computes the IG of each feature individually as a measure of its suitability to classify the training data. The higher the IG, the more informative the feature is. The output of IG is a ranked list of individual features along with their IG values. From this list, we consider only those features that have an IG greater than zero. Unlike IG, which works on each feature individually, CFS [14] evaluates subsets of features, where a good subset is the one that contain features highly correlated with the classification, yet uncorrelated to each other. The final output of CFS is the subset that is considered the best among all possible subsets. Unlike IG and CFS, DTP is an ‘unorthodox’ feature selection method that uses the Decision Tree of a C.45 Decision Tree (DT) classifier to select features. After a DT classifier is trained, the tree may be too complex if the training data contains a lot of noise. Post-prunning is a method often used to remove some of the nodes or branches of the trained tree to improve the efficiency of the trained model. This process, however, essentially remove some of the features that are deemed not so relevant. Therefore, in theory, if someone extract the remaining features from a pruned tree, the feature
IV. F EATURE S ELECTION AND C LASSIFICATION From the many features used in the literature for accelerometer-based HAR, as shown in Table I, we chose 19 time-domain features (see Table II) as our original feature set to start the feature selection process. Our traces are of variable length containing as few as 150 samples to 750 samples, where each sample is a 3D reading of the accelerometer. For each of the 177 traces, we divide the entire trace into a few non-overlapping windows each 100-sample long2 . For each window, we extract 19 features, but the feature values across all windows of a given trace are averaged to represent the final 19 feature values for that trace. Thus, after the feature extraction, we have 19 feature values for each of the 177 traces. We repeat the process for the 177 filtered traces. We consider and compare three different types of feature selection algorithms, Information Gain (IG), Correlation Feature Selection (CFS), and Decision Tree Pruning (DTP). IG [13] is a highly successful feature selection method for high 2 For a sampling rate of 20Hz, this corresponds to 5 seconds, which has been found to be sufficient to detect a human activity [5].
3
2014 Seventh International Conference on Mobile Computing and Ubiquitous Networking (ICMU)
TABLE IV F EATURE SELECTION WITH I NFORMATION G AIN (IG). F OR FILTERED DATA , 16 FEATURES HAVE GAIN GREATER THAN ZERO Raw Data Feature AAD(z) Std(z) Corr(y,z) AAD(y) Std(y) ARA(x,y,z) Corr(x,y) Mean(y) Std(x) AAD(x) Mean(z) Kurt(z) Corr(x,z) Skew(z) Mean(x) Kurt(x) Kurt(y) Skew(x) Skew(y)
Gain 0.73 0.70 0.53 0.39 0.39 0.22 0.21 0.20 0.20 0.20 0.20 0.15 0.12 0.07 0 0 0 0 0
TABLE VI F EATURE SELECTION WITH DTP. W HETHER THE DATA IS FILTERED OR NOT, IT SELECTS ONLY 5 FEATURES .
Filtered Data Feature Gain AAD(z) 0.99 Std(z) 0.73 Corr(y,z) 0.64 Kurt(y) 0.46 AAD(y) 0.40 Skew(y) 0.33 Kurt(z) 0.29 Skew(z) 0.28 Std(y) 0.27 Mean(y) 0.20 Mean(z) 0.19 AAD(x) 0.12 Corr(x,y) 0.11 Std(x) 0.11 ARA(x,y,z) 0.10 Corr(x,z) 0.07 Mean(x) 0 Kurt(x) 0 Skew(x) 0
Raw Data AAD(z) Corr(y,z) Mean(y) Mean(x) Corr(x,z)
V. R ESULTS AND D ISCUSSIONS A. Feature Reduction Tables IV-VI show the features selected by the three feature selection methods for both raw and MAF-filtered data. In terms of the number of selected features, CFS and DTP have clearly outperformed IG for both raw and filtered data sets. DTP selects only 5 features irrespective of whether the data is filtered or not. CFS, on the other hand, selects 10 features for the raw data and 6 when data is filtered. This remarkable performance of DTP is interesting considering that it is rarely mentioned in the literature as a feature selection tool.
TABLE V F EATURE SELECTION WITH CFS. I T SELECTS 10 FEATURES FOR THE RAW DATA AND 6 FOR THE FILTERED . Raw Data Mean(z) Std(y) Std(z) Skew(z) Kurt(z) AAD(x) AAD(z) Corr(x,y) Corr(y,z) ARA
Filtered Data Std(z) AAD(z) Std(x) Kurt(y) Mean(x)
B. Classification Performance
Filtered Data Mean(y) Std(z) Kurt(y) AAD(x) AAD(z) Corr(y,z)
Table VII shows the classification results in term of accuracies on the test set (averaged over 10-fold cross validation), without feature selection (original 19 features) and using the three feature selection methods and 5 classifiers for both raw and filtered data. The number of features is shown in the brackets and the best accuracy result for each feature selection method is in bold. A comparison between raw and filtered data across all classifiers shows that the best accuracies are obtained (with MLP) when data is filtered. This outcome highlights the need for filtering the accelerometer data of a smartphone when used for FCAR, as these data are likely to contain some noise. With regards to the performance of feature selection methods, DTP again beats CFS. With only 5 features, DTP achieves an accuracy of 94.42% for the filtered data, which is higher than that achieved by CFS. Therefore, we find that feature selection not only reduces the number of features for FCAR, but it also increases the recognition accuracy by eliminating irrelevant and potentially interfering (noisy) features. As mentioned earlier, complexity reduction in the classifier could be a motivation behind feature reduction for FCAR.
subset is likely to produce better results than the original set used to train the tree in the first place. Using publicly available data sets, Ratanamahatana and Gunopulos [15] have recently provided experimental evidence that this theory is indeed valid, i.e., DTP can be used as an effective feature selection method. All of the three feature selection algorithms are available in the WEKA software [16]. We use the 19 extracted features from each of the 177 traces (a matrix of 19x177) as input to WEKA, select a specific feature selection algorithm in WEKA, and obtain a reduced feature set for that algorithm. After the feature selection experiments, we have four alternative sets of features, the original set of 19 features and the three reduced sets obtained using three feature selection algorithms. To evaluate the performance of the different feature sets, we train and test five different classifiers, Decision Tree (DT) [17], Decision Tables (DTL) [18], Na¨ıve Bayes (NB) [19], K-Nearest Neighbour (KNN) [20], and Multilayer Perceptron (MLP) [21], which are all available in WEKA. Table III shows the (default) WEKA configurations for these five classifiers. Because we have a limited data set of 177 examples, we used a 10-fold cross validation to experiment with many different training and testing sets.
TABLE VII C LASSIFICATION ACCURACIES (%). Data Raw
Feature Set Original (19) IG (14) CFS (10) DTP (5) Filtered Original (19) IG (16) CFS (6) DTP (5)
4
DTL 80.59 79.58 80.25 83.06 80.22 80.40 82.23 82.38
DT 82.97 81.44 82.01 87.95 90.57 90.57 89.66 90.63
NB 87.49 88.05 88.32 89.46 85.84 84.37 89.56 88.32
KNN 89.20 85.46 87.44 87.95 85.67 82.18 84.88 93.77
MLP 87.86 86.34 84.34 88.74 91.40 91.11 93.01 94.42
2014 Seventh International Conference on Mobile Computing and Ubiquitous Networking (ICMU)
TABLE VIII T HE EFFECT OF USING D IFFERENT W INDOW L ENGTH Window 5 sec 4 sec 3 sec 2 sec 1 sec
# of features 5 5 6 10 9
Accuracy 94.42 94.93 94.74 92.94 89.60
classification and detection of two floor changing activities, riding on an escalator and a lift. The selected feature sets are tested with five different types of classifiers. We have found that DTP, albeit little-known as a feature selection tool, outperforms the other two methods. DTP reduced the number of features from 19 to only 5, which in turn reduced (MLP) classification complexity from 526 operations to only only 85 operations. As a result of removing noisy features, the activity recognition accuracy increased from 91.40% (without feature selection) to 94.42% (with 5 features). While we experimented with only two floor-changing activities in this paper, an important extension of the current work would be to examine other such activities, including climbing stairs, climbing on an escalator, walking on a ramp, and so on. Similarly, it would be useful to extend the list of feature selection methods beyond the three. How other filtering techniques (other than MAF) affect the performance is also worthy of future works. Finally, we only considered one holding position for the smartphone. Given that users often carry smartphones in pockets and bags, it would be interesting to see how different positions affect the number of features and the accuracies.
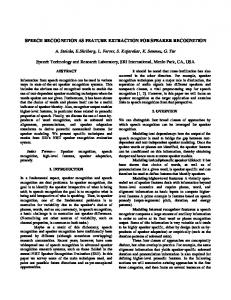
Fig. 1. Classifier (MLP) complexity reductions for different feature selection methods.
As MLP turns out to be the best performing classifier (see Table VII) for our filtered data set, let us examine how the different feature sets affected the computation complexity of o) MLP. Because the WEKA default configuration used (Ni +N 2 neurons in the hidden layer, the number of MLP operations is given by (Ni +No )2 +1.5(Ni +3No ), where Ni is the number of features and No = 3. Fig. 1 shows the number of MLP operations for four different feature sets, original (19 features), IG (16 features), CFS (6 features), and DTP (5 features). We can see that DTP reduces MLP complexity from 526 operations to only 85 operations. This remarkable reduction in classification complexity comes without sacrificing accuracy. In fact, as a result of removing noisy features, the accuracy increased slightly from 91.40% (without feature selection) to 94.42% (with 5 features).
ACKNOWLEDGMENT We thank the anonymous reviewers for their detailed comments, which helped improving the final version of this paper.
C. Effect of Sampling Window Size The results discussed in the preceding sections are all based on a sampling window size of 100 samples, which corresponds to 5 seconds worth of acceleration data at 20Hz. 5 seconds window is often used for accelerometer-based human activity detection as most human activities are found to be better detected when observed over 5 seconds [5]. However, for our investigations, all the 3 activities were basically standing still without performing any real activity. As such, one may wonder whether it would be possible to accurately detect these activities with smaller windows. To investigate this, we repeat our experiments for several smaller window sizes using the 5 features selected by DTP and employing MLP for classification. Table VIII shows that even with a small window of 1 second, we can achieve an accuracy close to 90%, but at the expense of increasing the number of features nearly by a factor of 2 (from 5 to 9).
R EFERENCES [1] D. Pai, M. Malpani, I. Sasi, N. Aggarwal, and P. Mantripragada, “Padati: A robust pedestrian dead reckoning system on smartphones,” in 2012 IEEE 11th International Conference on Trust, Security and Privacy in Computing and Communications (TrustCom), Liverpool, United Kingdom, 25-27 June 2012. [2] D. Gusenbauer, C. Isert, and J. Kr¨osche, “Self-contained indoor positioning on off-the-shelf mobile devices,” in ”International Conference on Indoor Positioning and Indoor Navigation (IPIN10), Z¨urich, Switzerland, 15–17 Septemper 2010. [3] K. Roy, C. Chaudhuri, M. Kundu, M. Nasipuri, and D. K. Basu, “Comparison of the multi layer perceptron and the nearest neighbor classifier for handwritten numeral recognition,” Journal of Information Science and Engineering, vol. 21, pp. 1247–1259, 2005. [4] L. Bao and S. S. Intille, “Activity recognition from user-annotated acceleration data,” Pervasive Computing, vol. 3001, pp. 1–17, 2004. [5] K. Altun, B. Barshan, and O. Tunc¸el, “Comparative study on classifying human activities with miniature inertial and magnetic sensors,” Pattern Recognition, vol. 43, no. 10, pp. 3605–3620, October, 2010. [6] A. Parnandi, K. Le, P. Vaghela, A. Kolli, K. Dantu, S. Poduri, and G. S. Sukhatme, “Coarse in-building localization with smartphones,” in Mobile Computing, Applications, and Services, Lecture Notes. Springer Berlin / Heidelberg, 2010, vol. 35, pp. 343–354. [7] K. Altun and B. Barshan, “Pedestrian dead reckoning employing simultaneous activity recognition cues,” Measurement Science and Technology, vol. 23, no. 2, pp. 1–20, February, 2012.
VI. C ONCLUSIONS AND F UTURE W ORK Based on empirical data, we evaluated and compared three different feature selection methods, IG, CFS, and DTP, for
5
2014 Seventh International Conference on Mobile Computing and Ubiquitous Networking (ICMU)
[8] M. Hassan, “A performance model of pedestrian dead reckoning with activity-based location updates,” in IEEE International Conference on Networks (ICON), Singapore, 12-14 December, 2012. [9] S. Khalifa and M. Hassan, “Evaluating mismatch probability of activitybased map matching in indoor positioning,” in International Conference on Indoor Positioning and Indoor Navigation (IPIN12), Sydney, Australia, 15-17 November 2012. [10] S. Khalifa, M. Hassan, and A. Seneviratne, “Adaptive pedestrian activity classification for indoor dead reckoning systems,” in International Conference on Indoor Positioning and Indoor Navigation (IPIN13), Montb´eliard-Belfort, France, 28-31 October 2013. [11] “The application used to collect the accelerometer reading,” http://androidapplications.com/23458-accelerometervalues, accessed on 1 August, 2012. [12] R. Koswatta and N. Karmakar, “Moving average filtering technique for signal processing in digital section of uwb chipless rfid reader,” in Microwave Conference Proceedings (APMC), 2010 Asia-Pacific, Yokohama, Japan. [13] X. Geng, T.-Y. Liu, T. Qin, and H. Li, “Feature selection for ranking,” in Proceedings of the 30th annual international ACM SIGIR conference on Research and development in information retrieval, Amsterdam, The Netherlands, 23-27 July 2007. [14] M. A. Hall, “Correlation-based feature selection for machine learning,” Ph.D. dissertation, Department of Computer Science, University of Waikato, Hamilton, New Zealand, 1998. [15] C. A. Ratanamahatana and D. Gunopulos, “Scaling up the naive bayesian classifier: Using decision trees for feature selection,” in Proc. Workshop Data Cleaning and Preprocessing (DCAP 02), at IEEE Intl Conf. Data Mining (ICDM 02), 2002. [16] “WEKA Software,” http://www.cs.waikato.ac.nz/ml/weka/, accessed on 15 August, 2012. [17] J. R. Quinlan, C4.5: programs for machine learning. San Francisco, CA, USA: Morgan Kaufmann Publishers Inc, 1993. [18] R. Kohavi, “The power of decision tables,” in Proceedings of the European Conference on Machine Learning. Springer Verlag, 1995. [19] G. John and P. Langley, “Estimating continuous distributions in bayesian classifiers,” in Proceedings of the Eleventh Conference on Uncertainty in Artificial Intelligence. Morgan Kaufmann, 1995. [20] D. W. Aha, D. Kibler, and M. K. Albert, “Instance-based learning algorithms,” Machine Learning, vol. 6, no. 1, pp. 37–66, 1991. [21] S. Pal and S. Mitra, “Multilayer perceptron, fuzzy sets, and classification,” IEEE Transactions on Neural Networks, vol. 3, no. 5, pp. 683 –697, 1992.
6